[中文](./README.md) | English
# JimuReport (Free Report Tool)
v2.3.0 | 2025-12-22
[](https://guojusoft.com)
[](https://github.com/jeecgboot/JimuReport)
[](http://jimureport.com)
[](https://github.com/jeecgboot/JimuReport)
[](https://github.com/jeecgboot/JimuReport)
JimuReport is a free data visualization reporting tool that includes reports, printing, dashboards, and data screens. Design completely online like building blocks! Features include: complex reports, print design, chart reports, portal design, dashboard design, etc.!
It consists of two main modules: JimuReport focuses on traditional complex reports and printing, while JimuBI focuses on data dashboard and dashboard visualization design!
- JimuReport uses a Web-based report designer with Excel-like operation style, completing report design through drag-and-drop, what you see is what you get.
- Leading enterprise-level Web reports, supporting various complex reports, focusing on solving enterprise reporting challenges.
- JimuBI is a tool focused on digital twins and data visualization, aiming to present real-time business data in an intuitive, dynamic and visually appealing way, especially good at creating interactive dashboards and data screens.
- JimuBI is the only one in the industry that achieves full-scenario coverage: supports dashboards (cool dynamics), data screens (professional analysis), portals (interactive business dashboards), and mobile (view anytime, anywhere), truly achieving "develop once, adapt to multiple terminals".
- Dashboards adopt a Word-like style, allowing you to drag components freely and design however you want, creating cool dashboards like Baidu and Alibaba!
- Adhering to the product concept of "simple, easy-to-use, professional", greatly reducing report development difficulty, shortening development cycles, and saving costs.
```
Focus on open source, creating "professional, easy-to-use, AI-intelligent" data visualization reports, dashboards, portals
Open source license: `Free functionality, commercial use allowed, code not open`
```
Technical Documentation
-----------------------------------
- Official Website: http://jimureport.com
- Online Demo: http://jimureport.com/login
- Quick Start: [Quick Integration of JimuReport](https://help.jimureport.com/quick.html) | [Development Documentation](https://help.jimureport.com) | [Video Tutorials](http://jimureport.com/doc/video)
- Technical Support: [Found a bug? Please report an issue on GitHub](https://github.com/jeecgboot/JimuReport/issues/new)
- QQ Groups: 854804538、③596660273(full)、①212391162(full)、②929646317(full)
Quick Integration of JimuReport
-----------------------------------
> Supports quick integration into SpringBoot scaffold projects. SpringBoot3 requires JDK17+, SpringBoot2 requires JDK8+
#### Step 1: Add JimuReport Dependencies
- springboot3
```
org.jeecgframework.jimureport
jimureport-spring-boot3-starter
2.3.0
org.jeecgframework.jimureport
jimureport-nosql-starter
2.1.0
org.jeecgframework.jimureport
jimureport-echarts-starter
2.2.0
```
- springboot2
```
org.jeecgframework.jimureport
jimureport-spring-boot-starter
2.3.0.1
org.jeecgframework.jimureport
jimureport-nosql-starter
2.1.0
org.jeecgframework.jimureport
jimureport-echarts-starter
2.2.0
```
#### Step 2: Add JimuBI Dependencies (Dashboard and Data Screens)
- springboot3
```
org.jeecgframework.jimureport
jimubi-spring-boot3-starter
2.3.0
```
- springboot2
```
org.jeecgframework.jimureport
jimubi-spring-boot-starter
2.3.0
```
#### Step 3: Initialize SQL and Required Configuration
- https://help.jimureport.com/quick.html
jimureport-example Environment Requirements
-----------------------------------
- Requires JDK17+ (this project uses SpringBoot3 architecture)
- Requires MySQL 5.7+, manually execute db/jimureport.mysql5.7.create.sql, will automatically create jimureport database
- Project configuration: src/main/resources/application-dev.yml
- Requires Redis (optional)
Green Installation-Free Version
-----------------------------------
- [Integrated Source Code Run](https://github.com/jeecgboot/JimuReport/tree/master/jimureport-example)
- [Docker Quick Run](https://help.jimureport.com/docker.html)
- [Green Installation-Free Version](https://pan.baidu.com/s/1z9VmMz4HCc7GMVbzugetLQ?pwd=xafr)
> Default account and password: admin/123456, [Password change supported](https://help.jimureport.com/qa?_highlight=%E5%AF%86%E7%A0%81#4-jimureport-example%E9%A1%B9%E7%9B%AE%E6%80%8E%E4%B9%88%E4%BF%AE%E6%94%B9%E9%BB%98%E8%AE%A4%E5%AF%86%E7%A0%81)
License Agreement
-----------------------------------
The open source version is released under the LGPL license. If you cannot accept LGPL and need to use this project for commercial purposes without retaining copyright information (preview "Powered by JimuReport", "JimuReport Logo" and other copyright and links), you need to purchase [commercial license](http://jimureport.com/vip) to protect your legal rights.
Background
-----------------------------------
Reports are an essential requirement for enterprise IT services, but there is no free and easy-to-use reporting tool in the industry. Most free reports have weak functionality and are not intelligent enough, while commercial reports are expensive. This is why we had the original intention to develop a set of free reporting tools.
What kind of report should we make? With the rise of the low-code concept, the previous mode of designing templates through reporting tools and then integrating them with systems has become outdated. What we pursue now is completely online design, visual, fool-proof operations, and simple, easy-to-use and intelligent reports!
Why Choose JimuReport?
-----------------------------------
> Permanently free, supports various complex reports, and features fool-proof online design, very intelligent. In the era of low-code, this is your first choice!
- Can be quickly integrated into SpringBoot scaffold projects
- Web-based designer with Excel-like operation style, completing report design through drag-and-drop
- Bind data sources to templates through SQL, API and other methods. Also supports expressions and automatic calculation of totals, greatly reducing calculation workload
- High development efficiency, fool-proof online report design, design a report in one minute, simple yet powerful
- Supports ECharts, currently supports 28 chart types, online drag-and-drop design, supports SQL and API data sources
- Supports complex reports such as grouping, cross-tabulation, totals, expressions, etc.
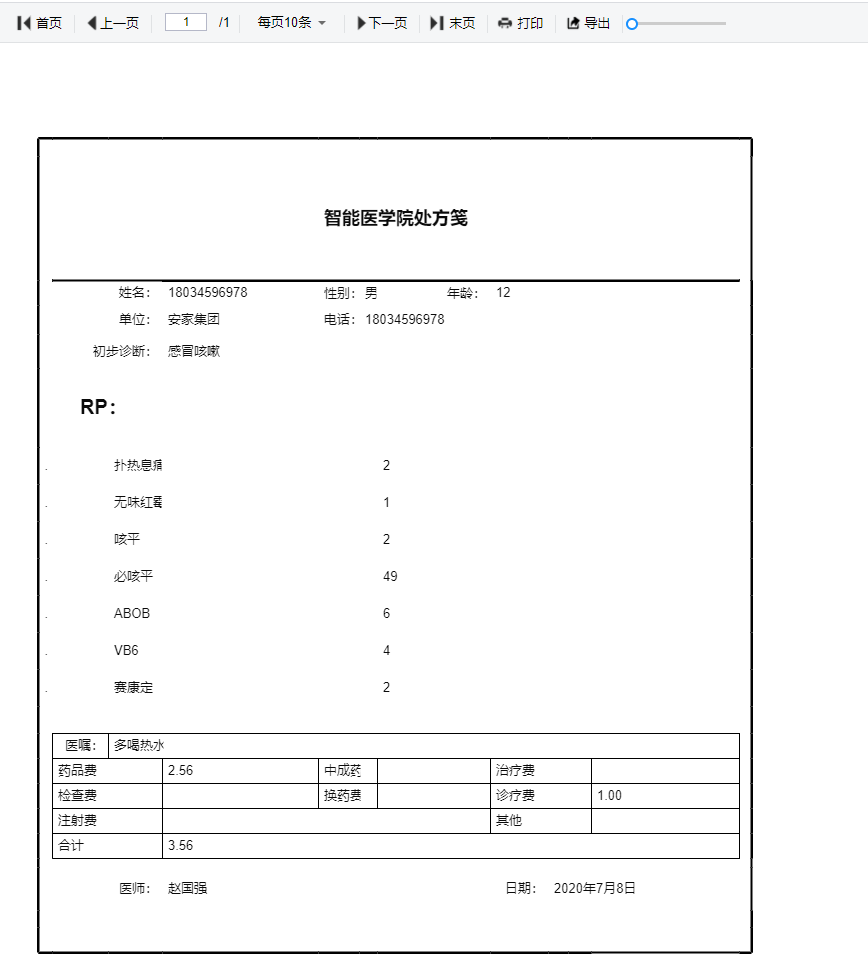
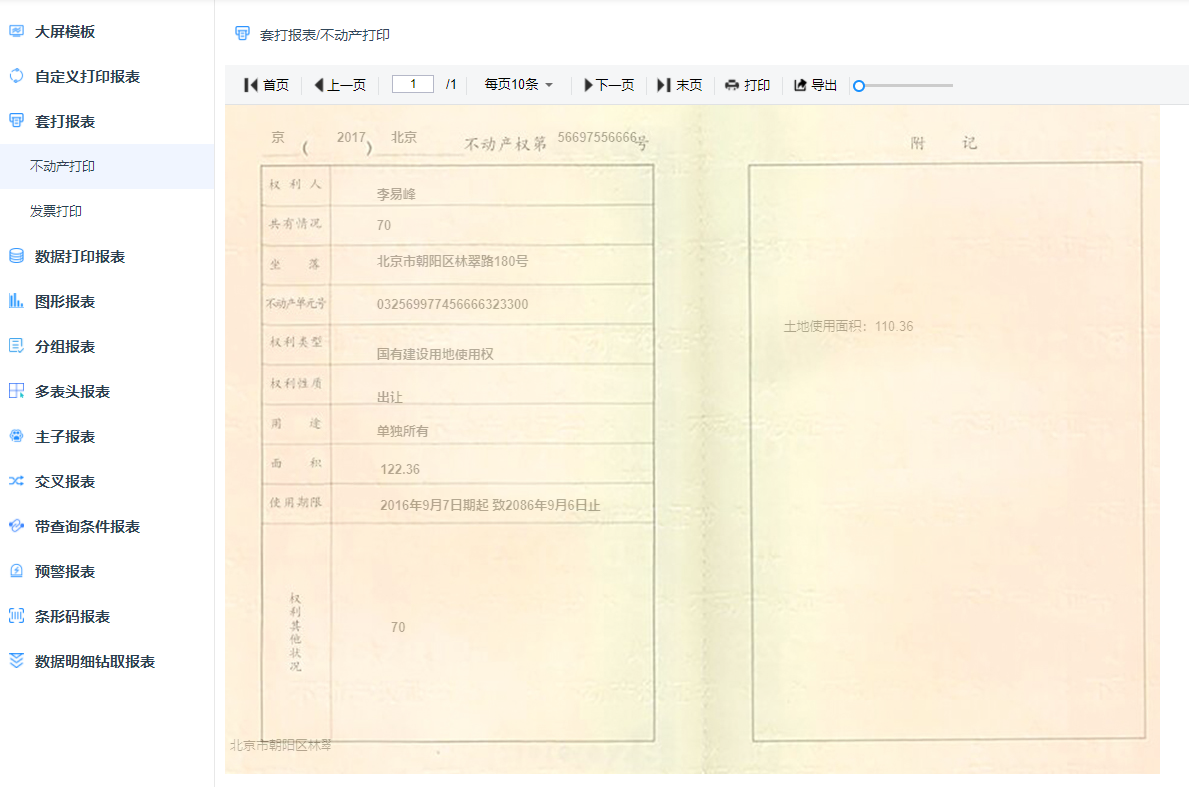
- Supports print design (supports form overlay, background printing, etc.) Can set print margins, orientation, headers and footers, one-click quick printing, and can achieve invoice overlay printing, real estate certificates and other precise, seamless printing
- Supports exporting Excel, PDF, Word, image and other format files
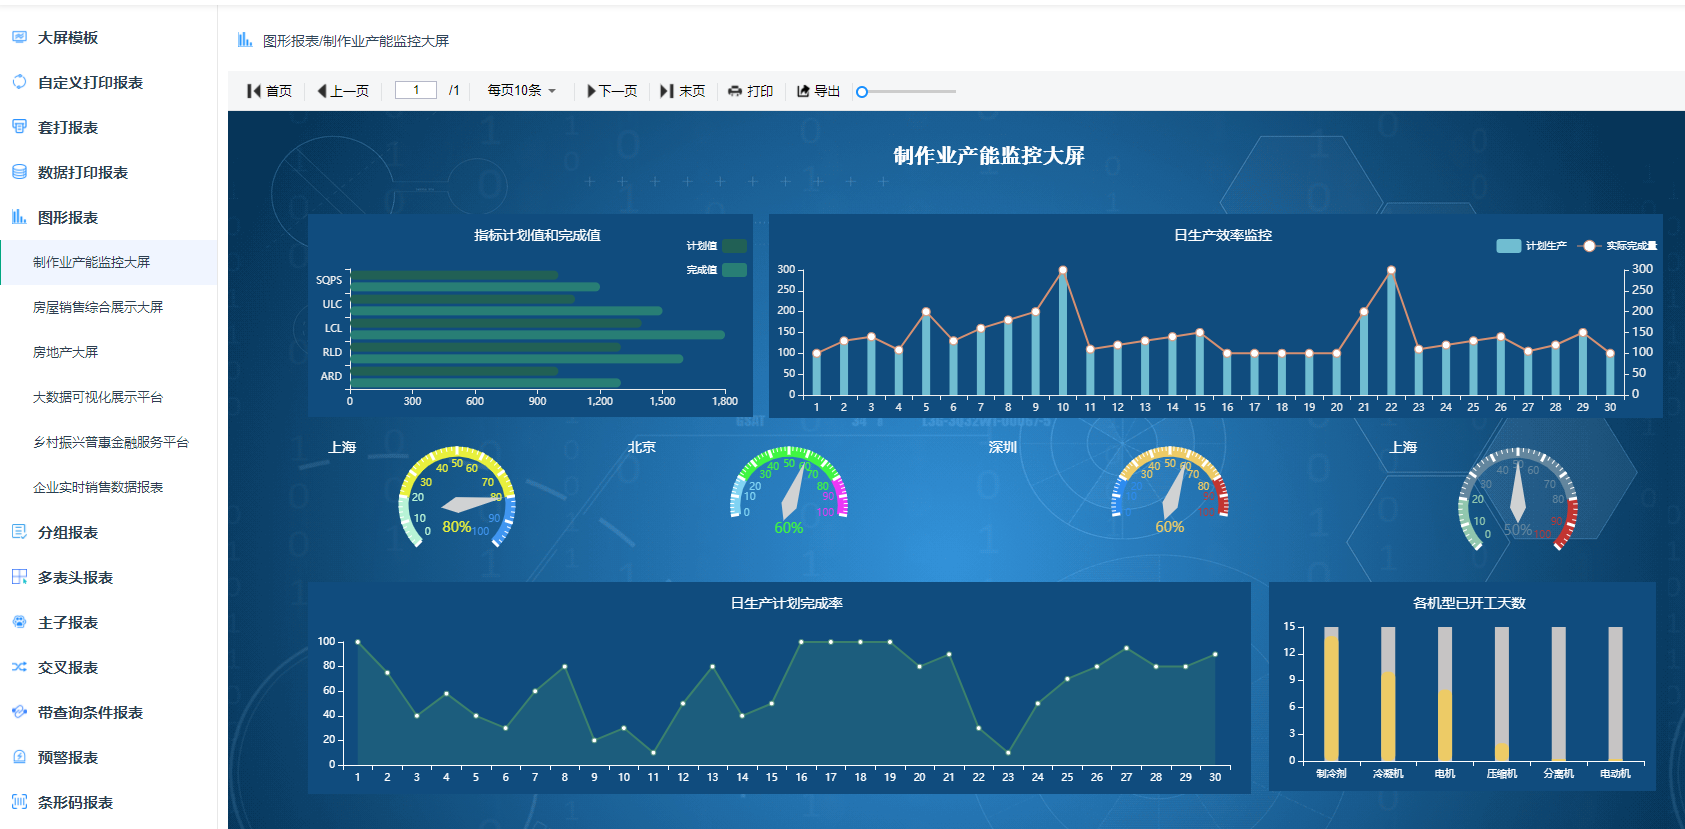
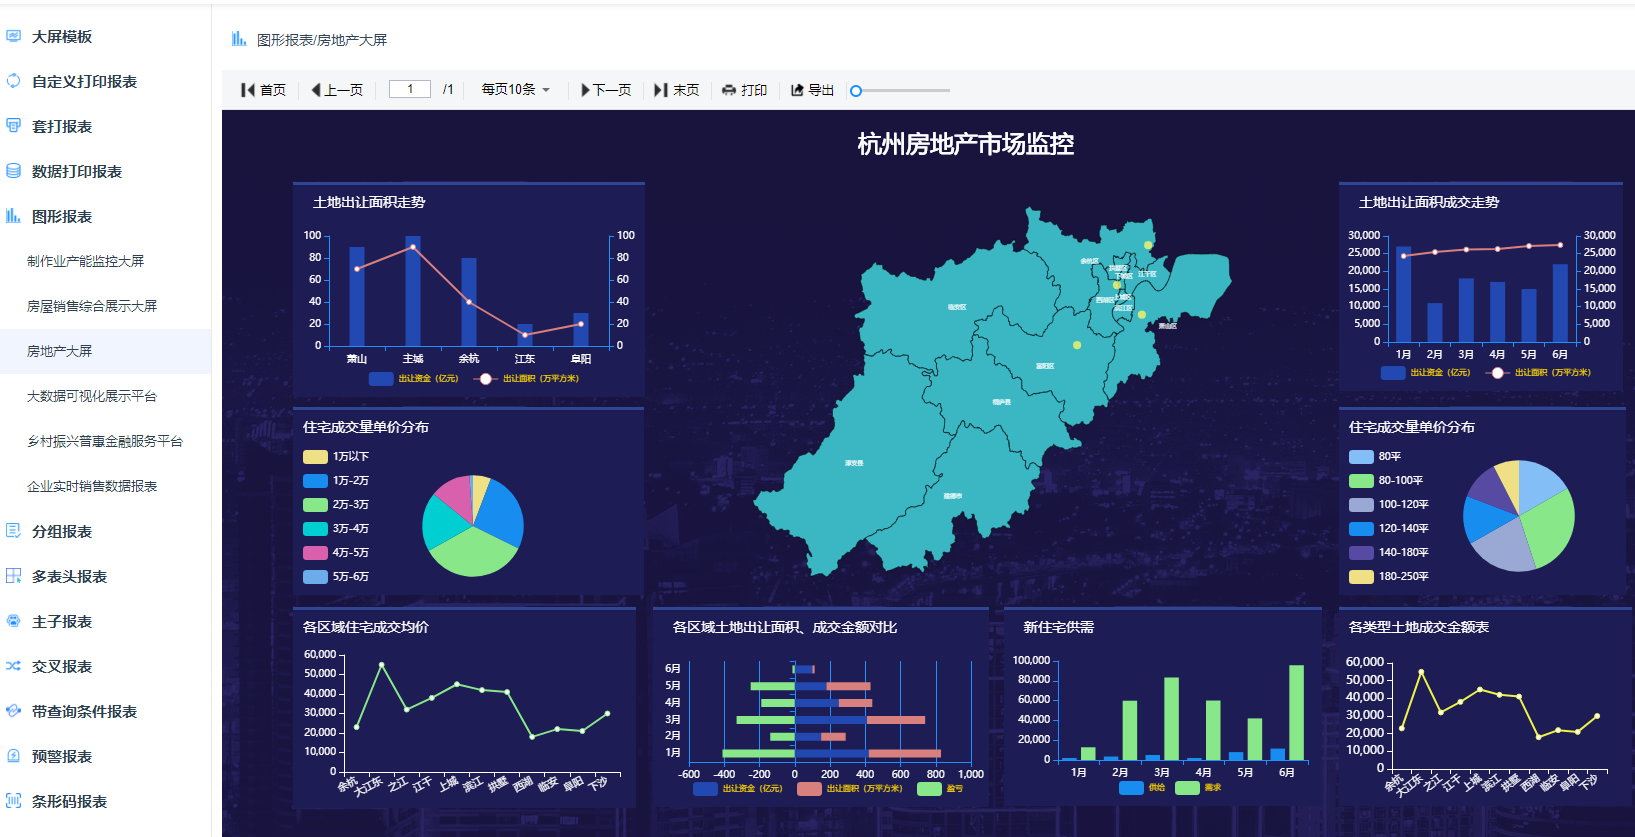
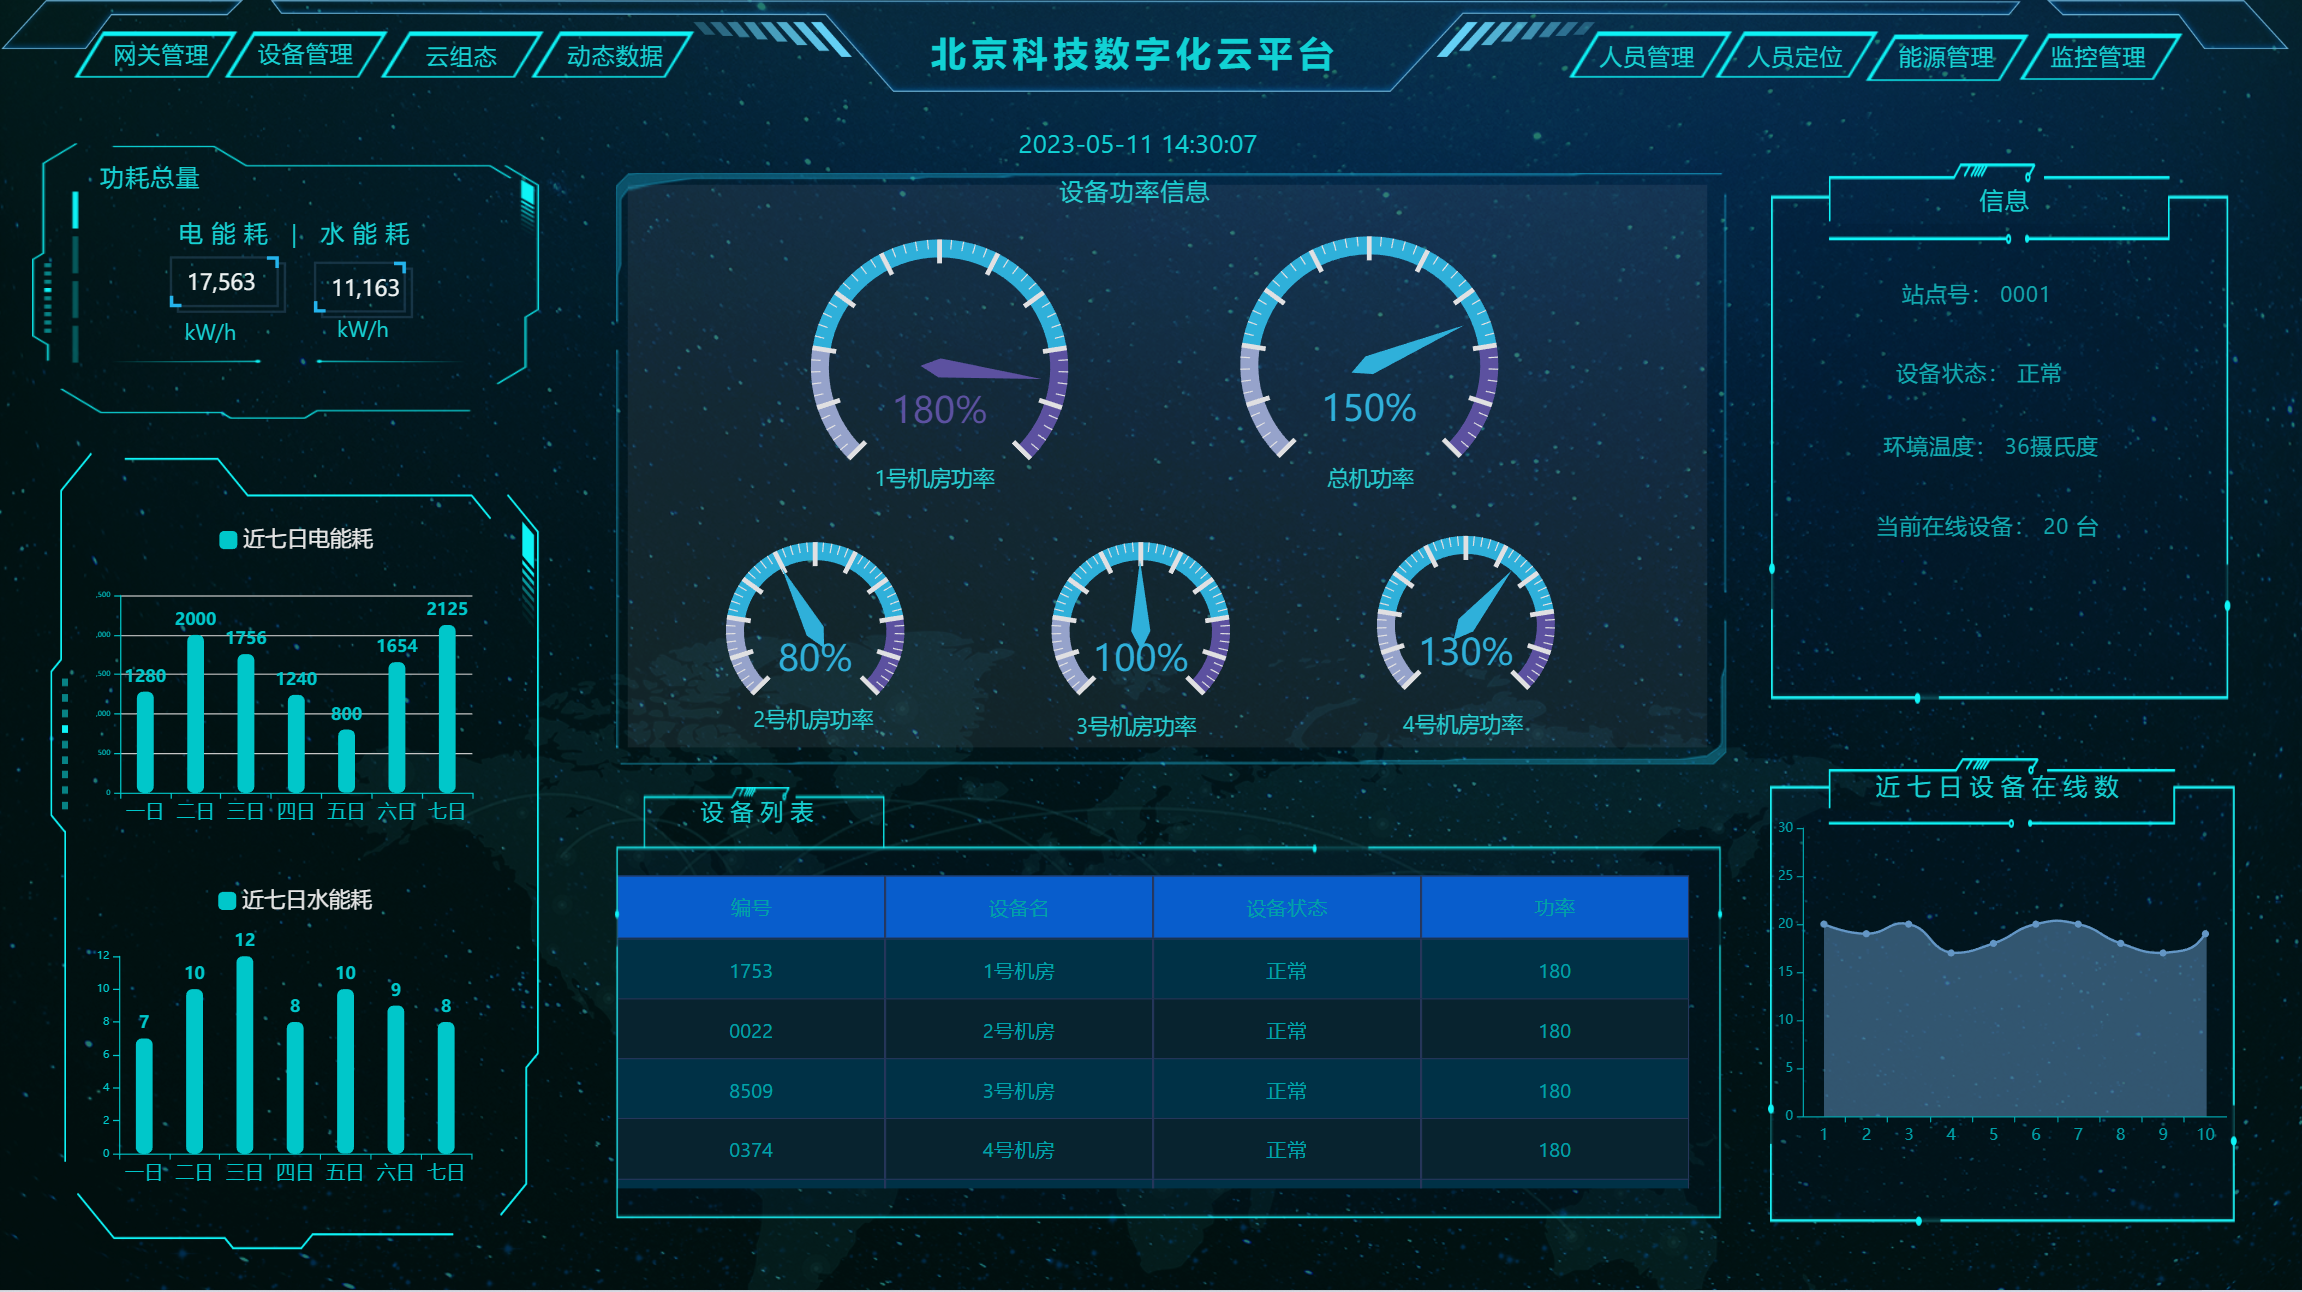
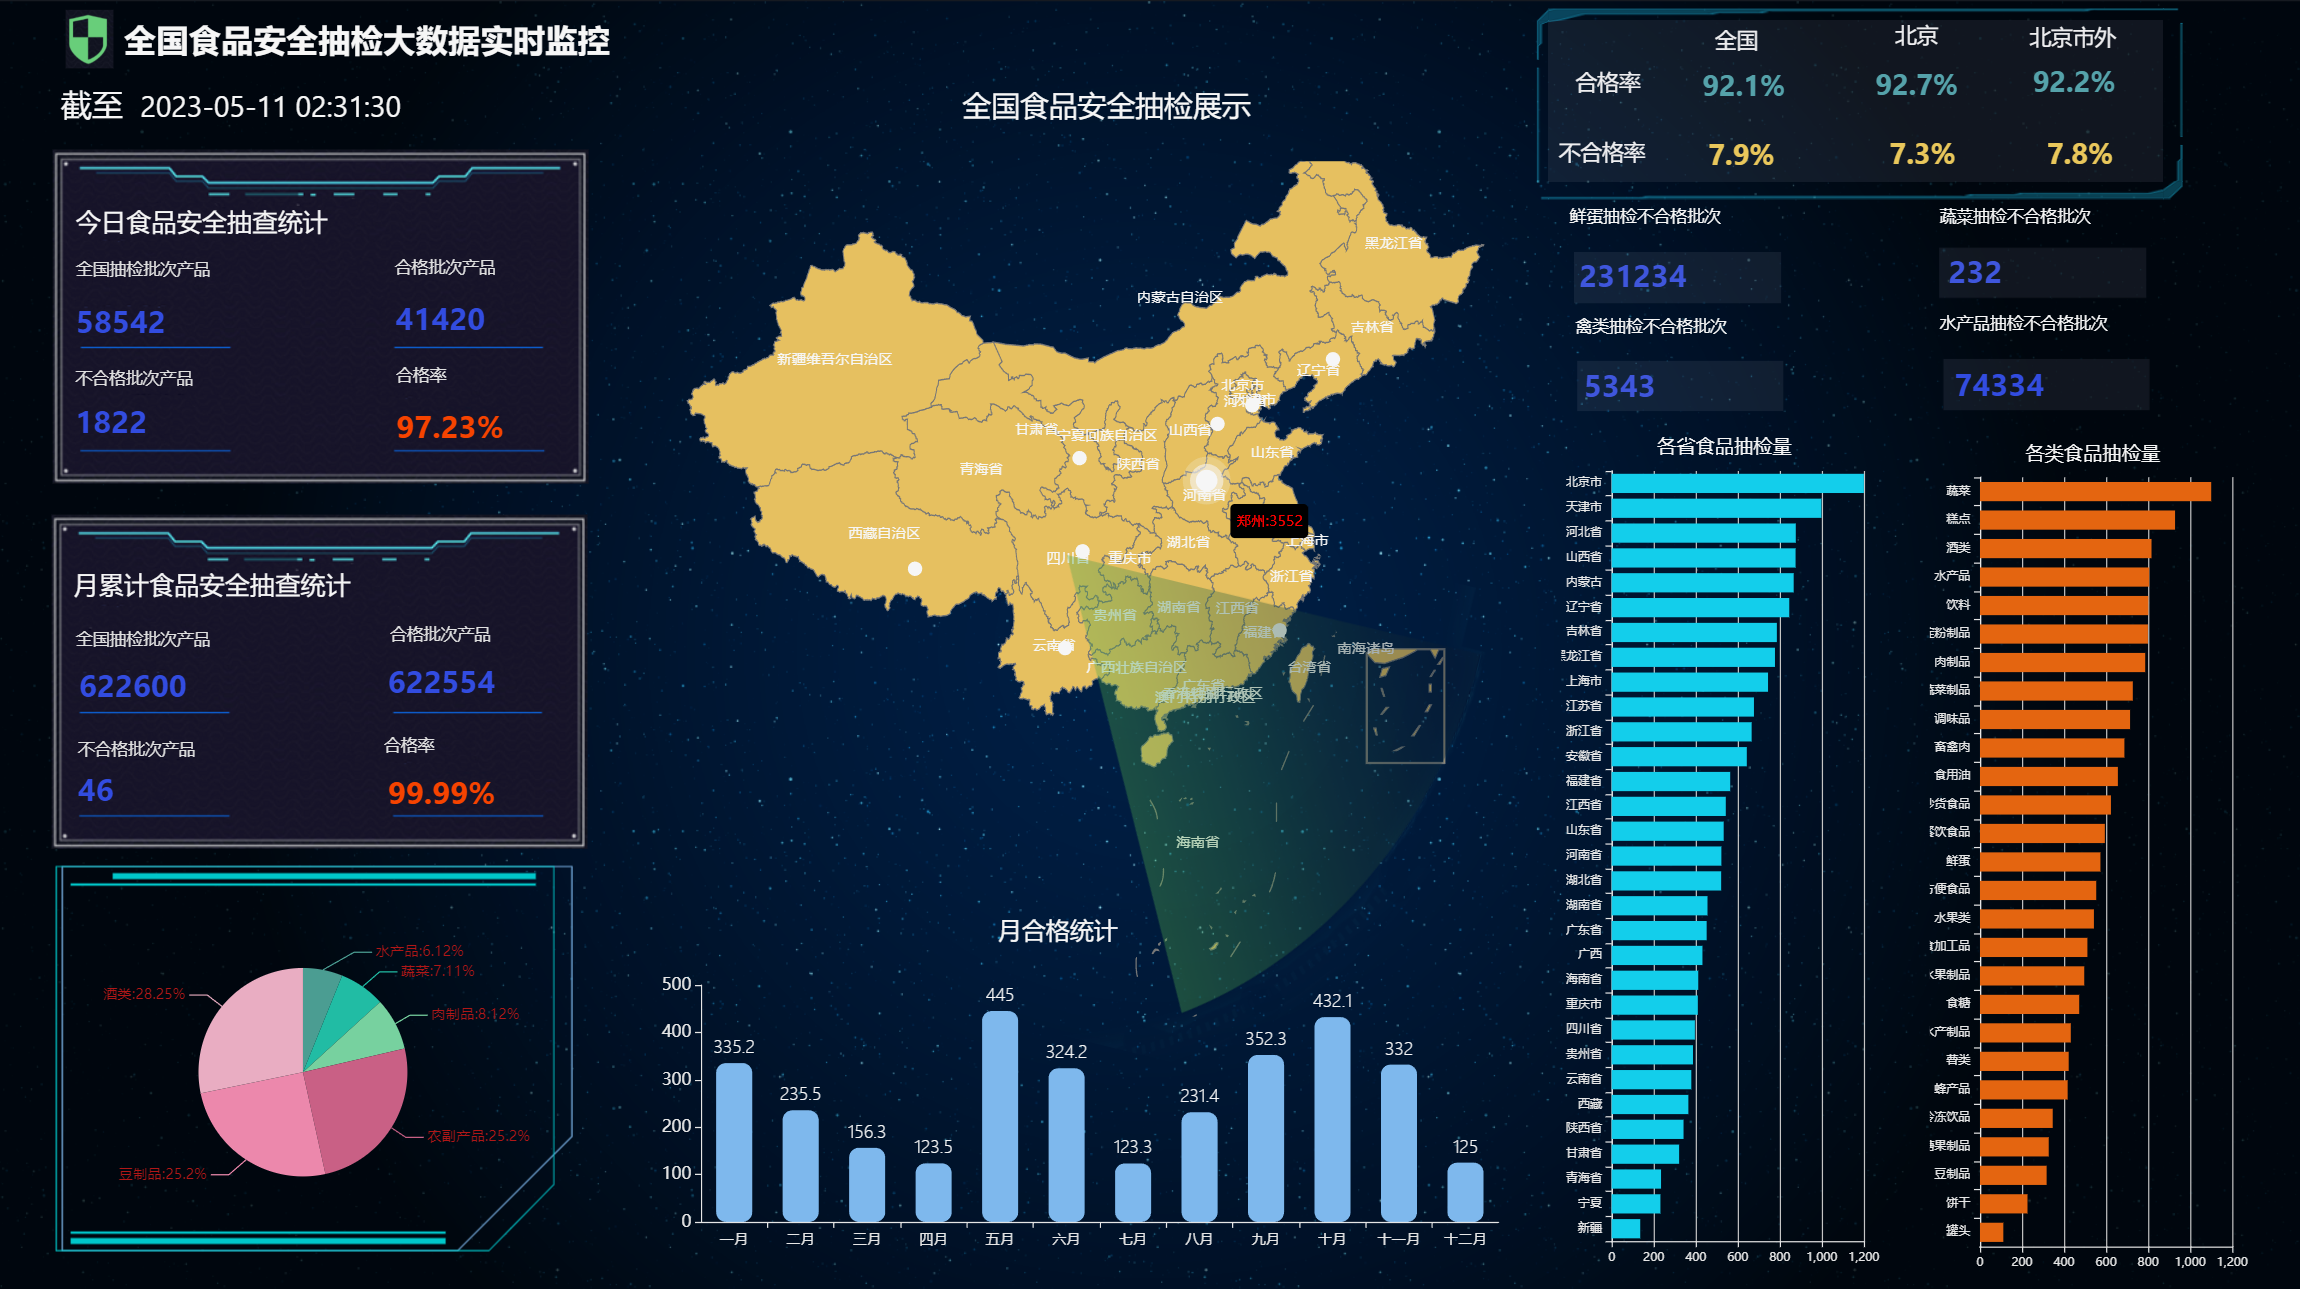
- Visual charts, dashboard designer for large screen design, supports rich data source connections and mobile terminals, quickly create charts and portal design through drag-and-drop; supports multiple chart types: column charts, line charts, scatter plots, pie charts, ring charts, area charts, funnel charts, progress charts, dashboards, radar charts, maps, etc.
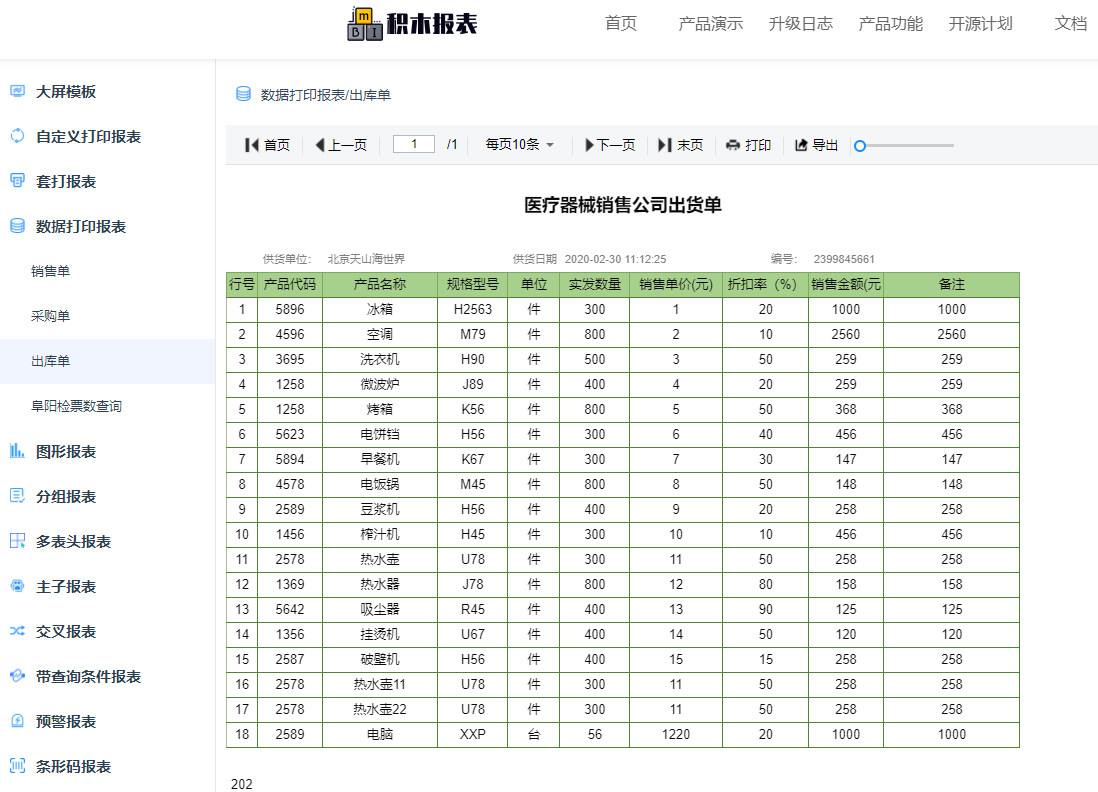
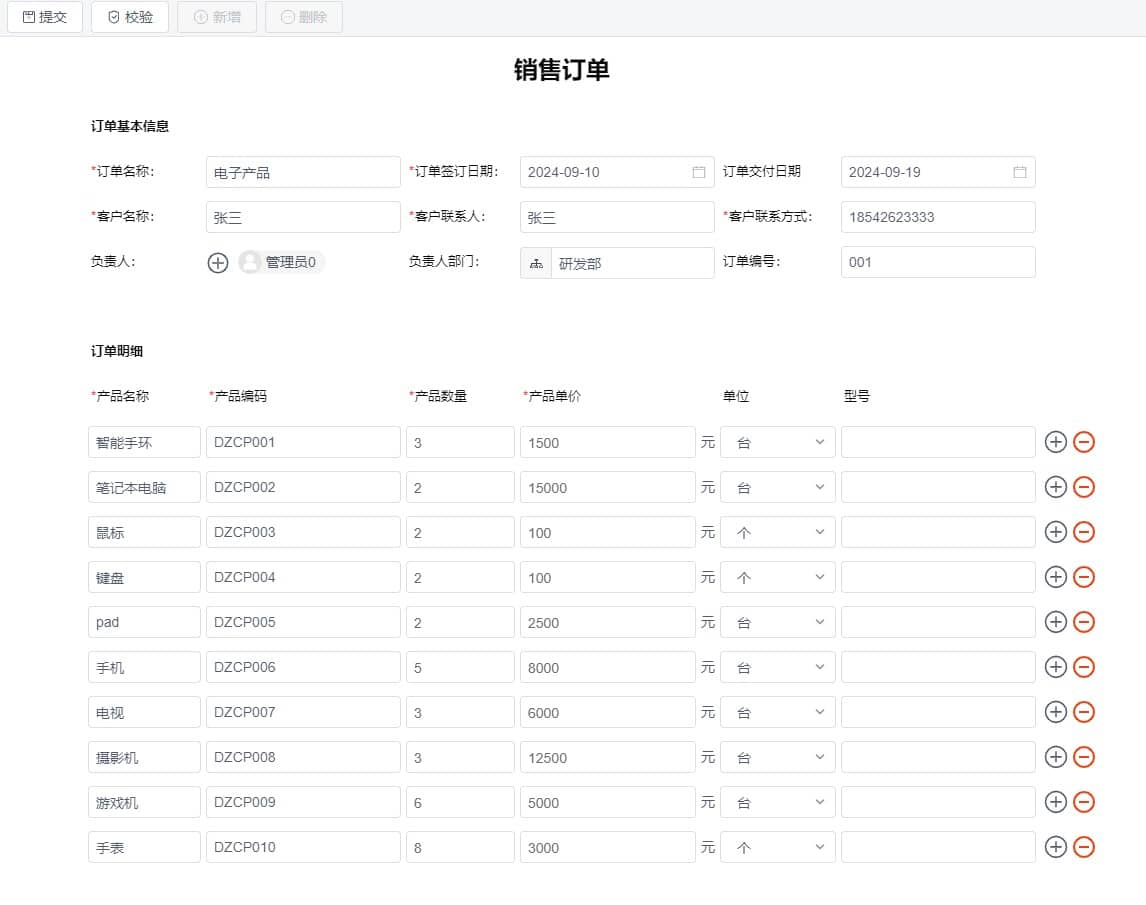
- Can design various types of documents and large screens, such as inventory receipts, sales orders, financial reports, contracts, monitoring screens, tourism data screens, etc.
- Large screen designer supports dozens of chart styles, can be freely spliced and combined to design cool large screens
- Data visualization, open source alternative to DataV and FineReport, with better experience and simpler usage than FineReport
- [JimuReport Official Website](http://jimureport.com/login) allows you to create reports and large screens online for free. One-click registration with mobile number for permanent use. Large screens adopt Word-like style, you can drag components freely and design however you want, creating cool visual screens like Baidu and Alibaba! The important thing is: Free! Free! Free!
Database Compatibility
-----------------------------------
Supports more than 30 data sources including domestic, conventional, and NoSQL databases. Supports querying CSV, MongoDB and other non-physical databases using SQL.
| Database | Support |
| --- | --- |
| MySQL | √ |
| Oracle, Oracle9i | √ |
| SqlServer, SqlServer2012 | √ |
| PostgreSQL | √ |
| DB2, Informix | √ |
| MariaDB | √ |
| SQLite, Hsqldb, Derby, H2 | √ |
| DM, KingbaseES, ShenTong | √ |
| Huawei GaussDB, XuGu, HighGo, TDengine | √ |
| Alibaba Cloud PolarDB, PPAS, HerdDB | √ |
| Hive, HBase, CouchBase | √ |
| Import Excel, CSV, JSON file datasets | √ |
| SQLite, TiDB, Doris, ClickHouse, MongoDB-BI | √ |
| Elasticsearch, MongoDB | √ |
For databases without provided scripts, you can refer to the [documentation](https://my.oschina.net/jeecg/blog/4905722) to convert them yourself.
Report Workbench
-----------------------------------
- Data Visualization (Professional and first-class, data visualization, solving various reporting challenges)

- Report Designer (Completely online design, simple and easy to use)
- Print Design (Supports form overlay, background printing)
- Data Reports (Supports complex reports such as grouping, cross-tabulation, totals, etc.)

- Chart Reports (Currently supports 28 chart types)
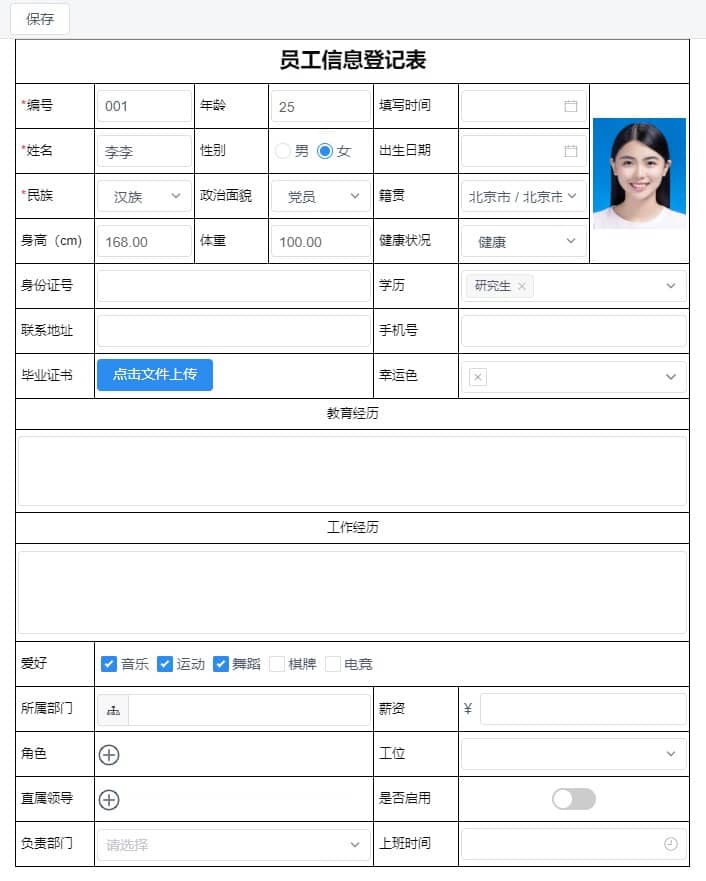
- Form Filling

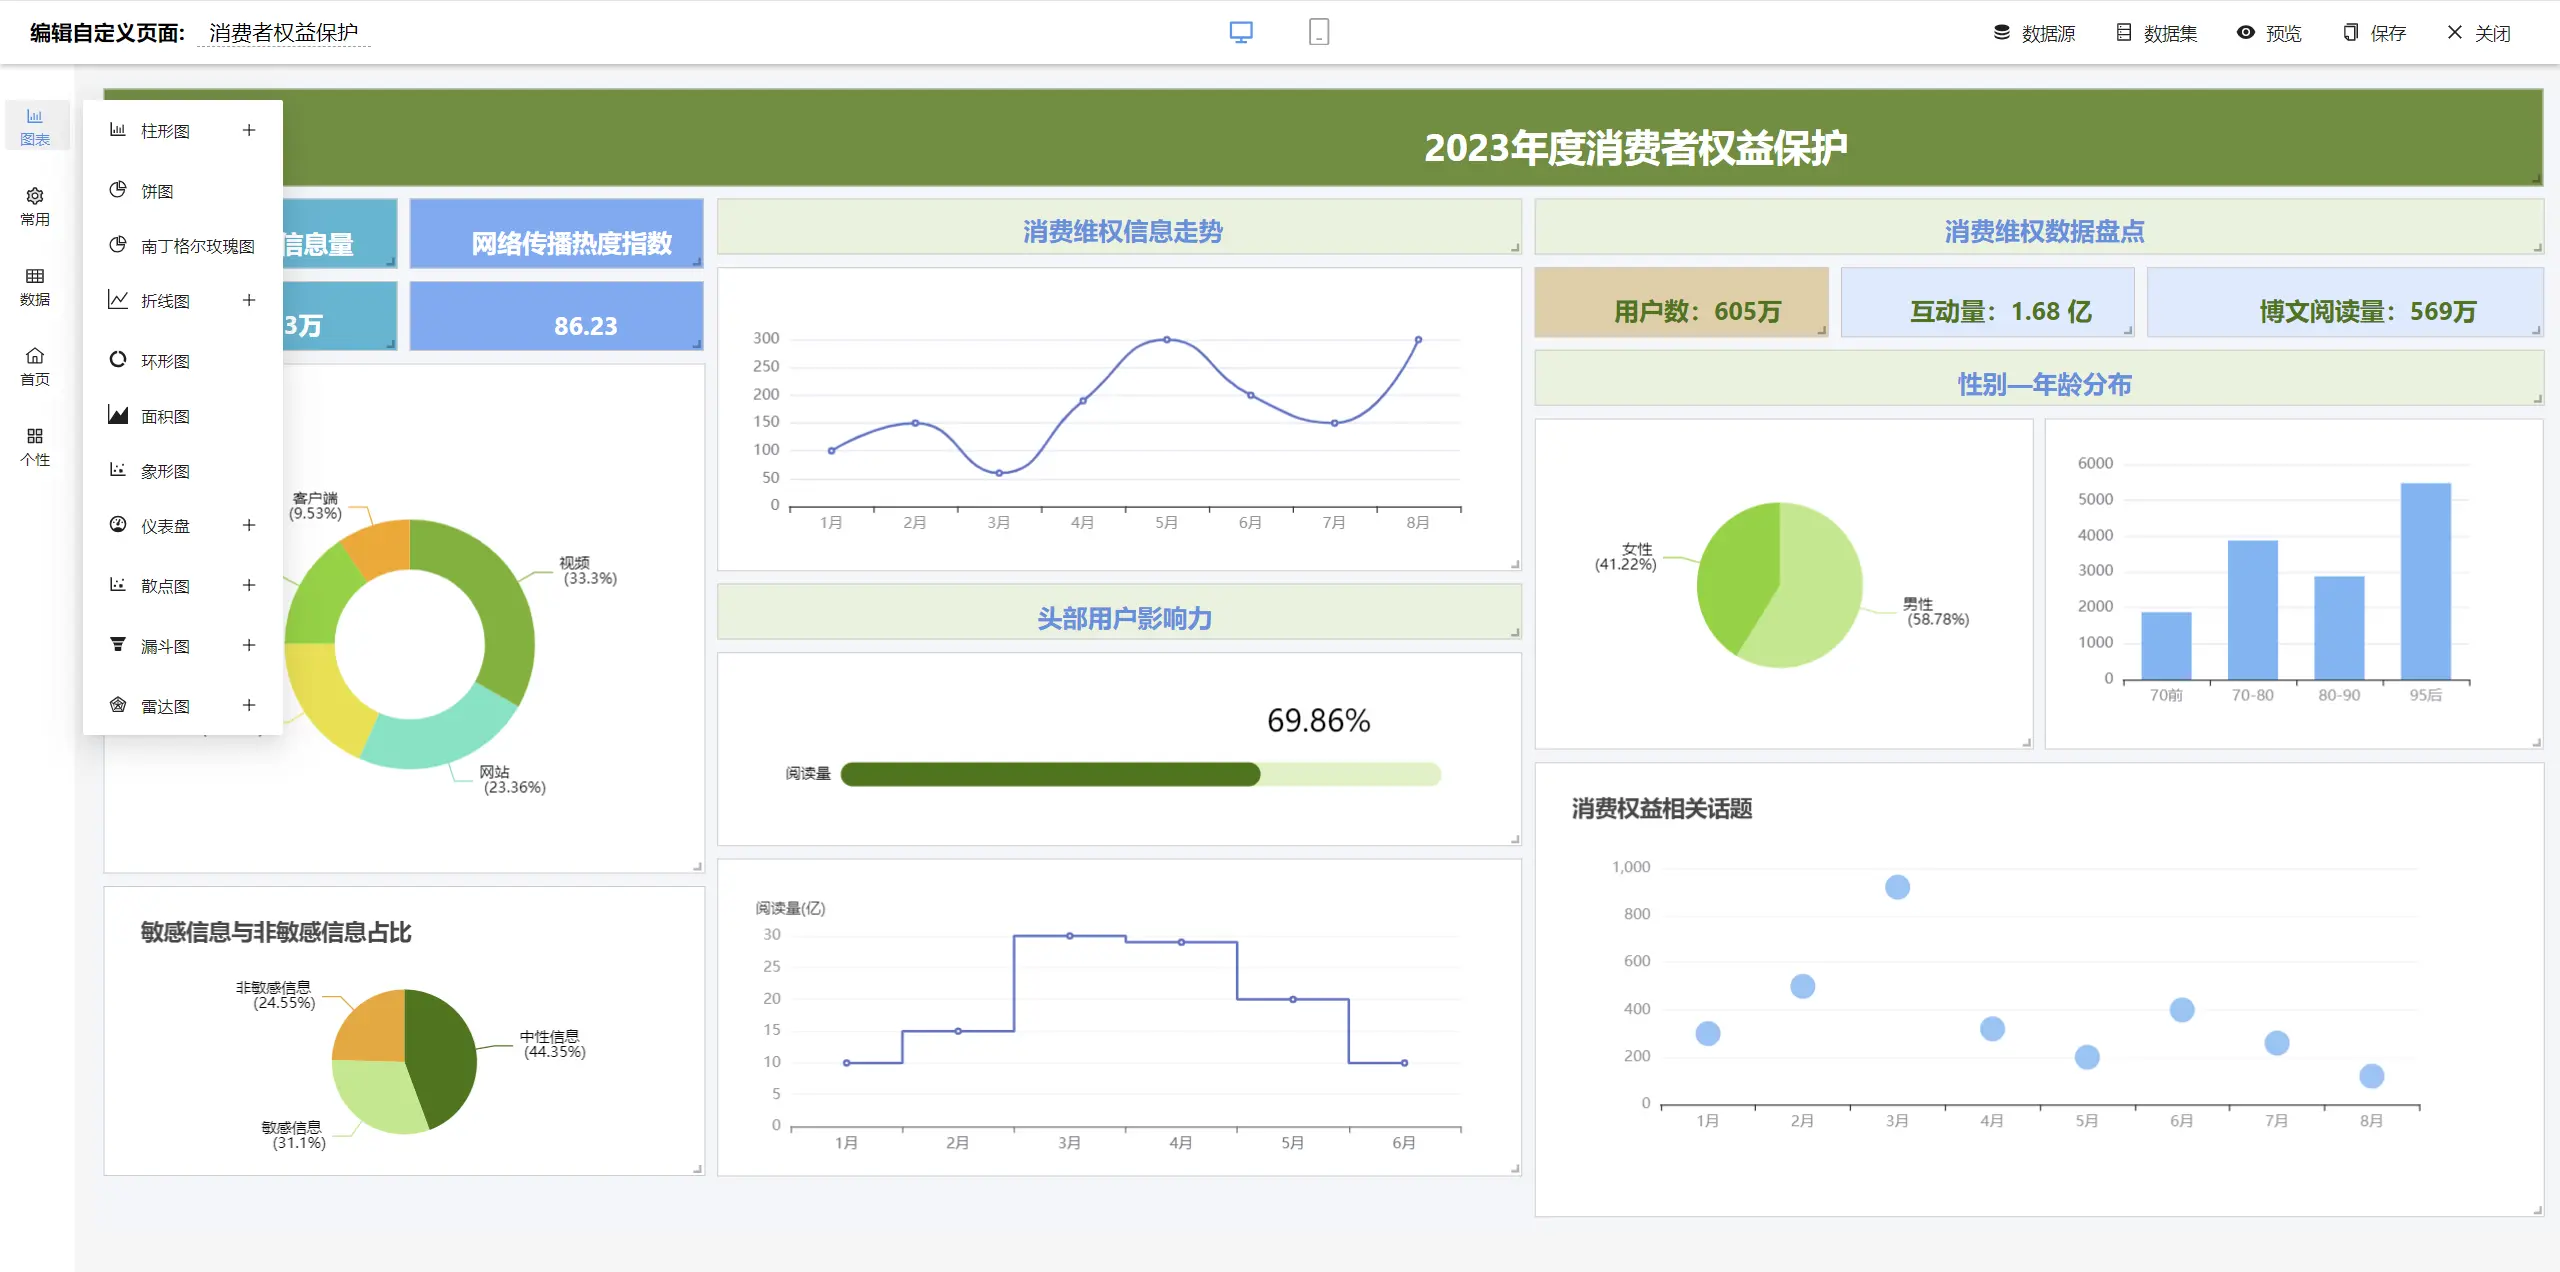
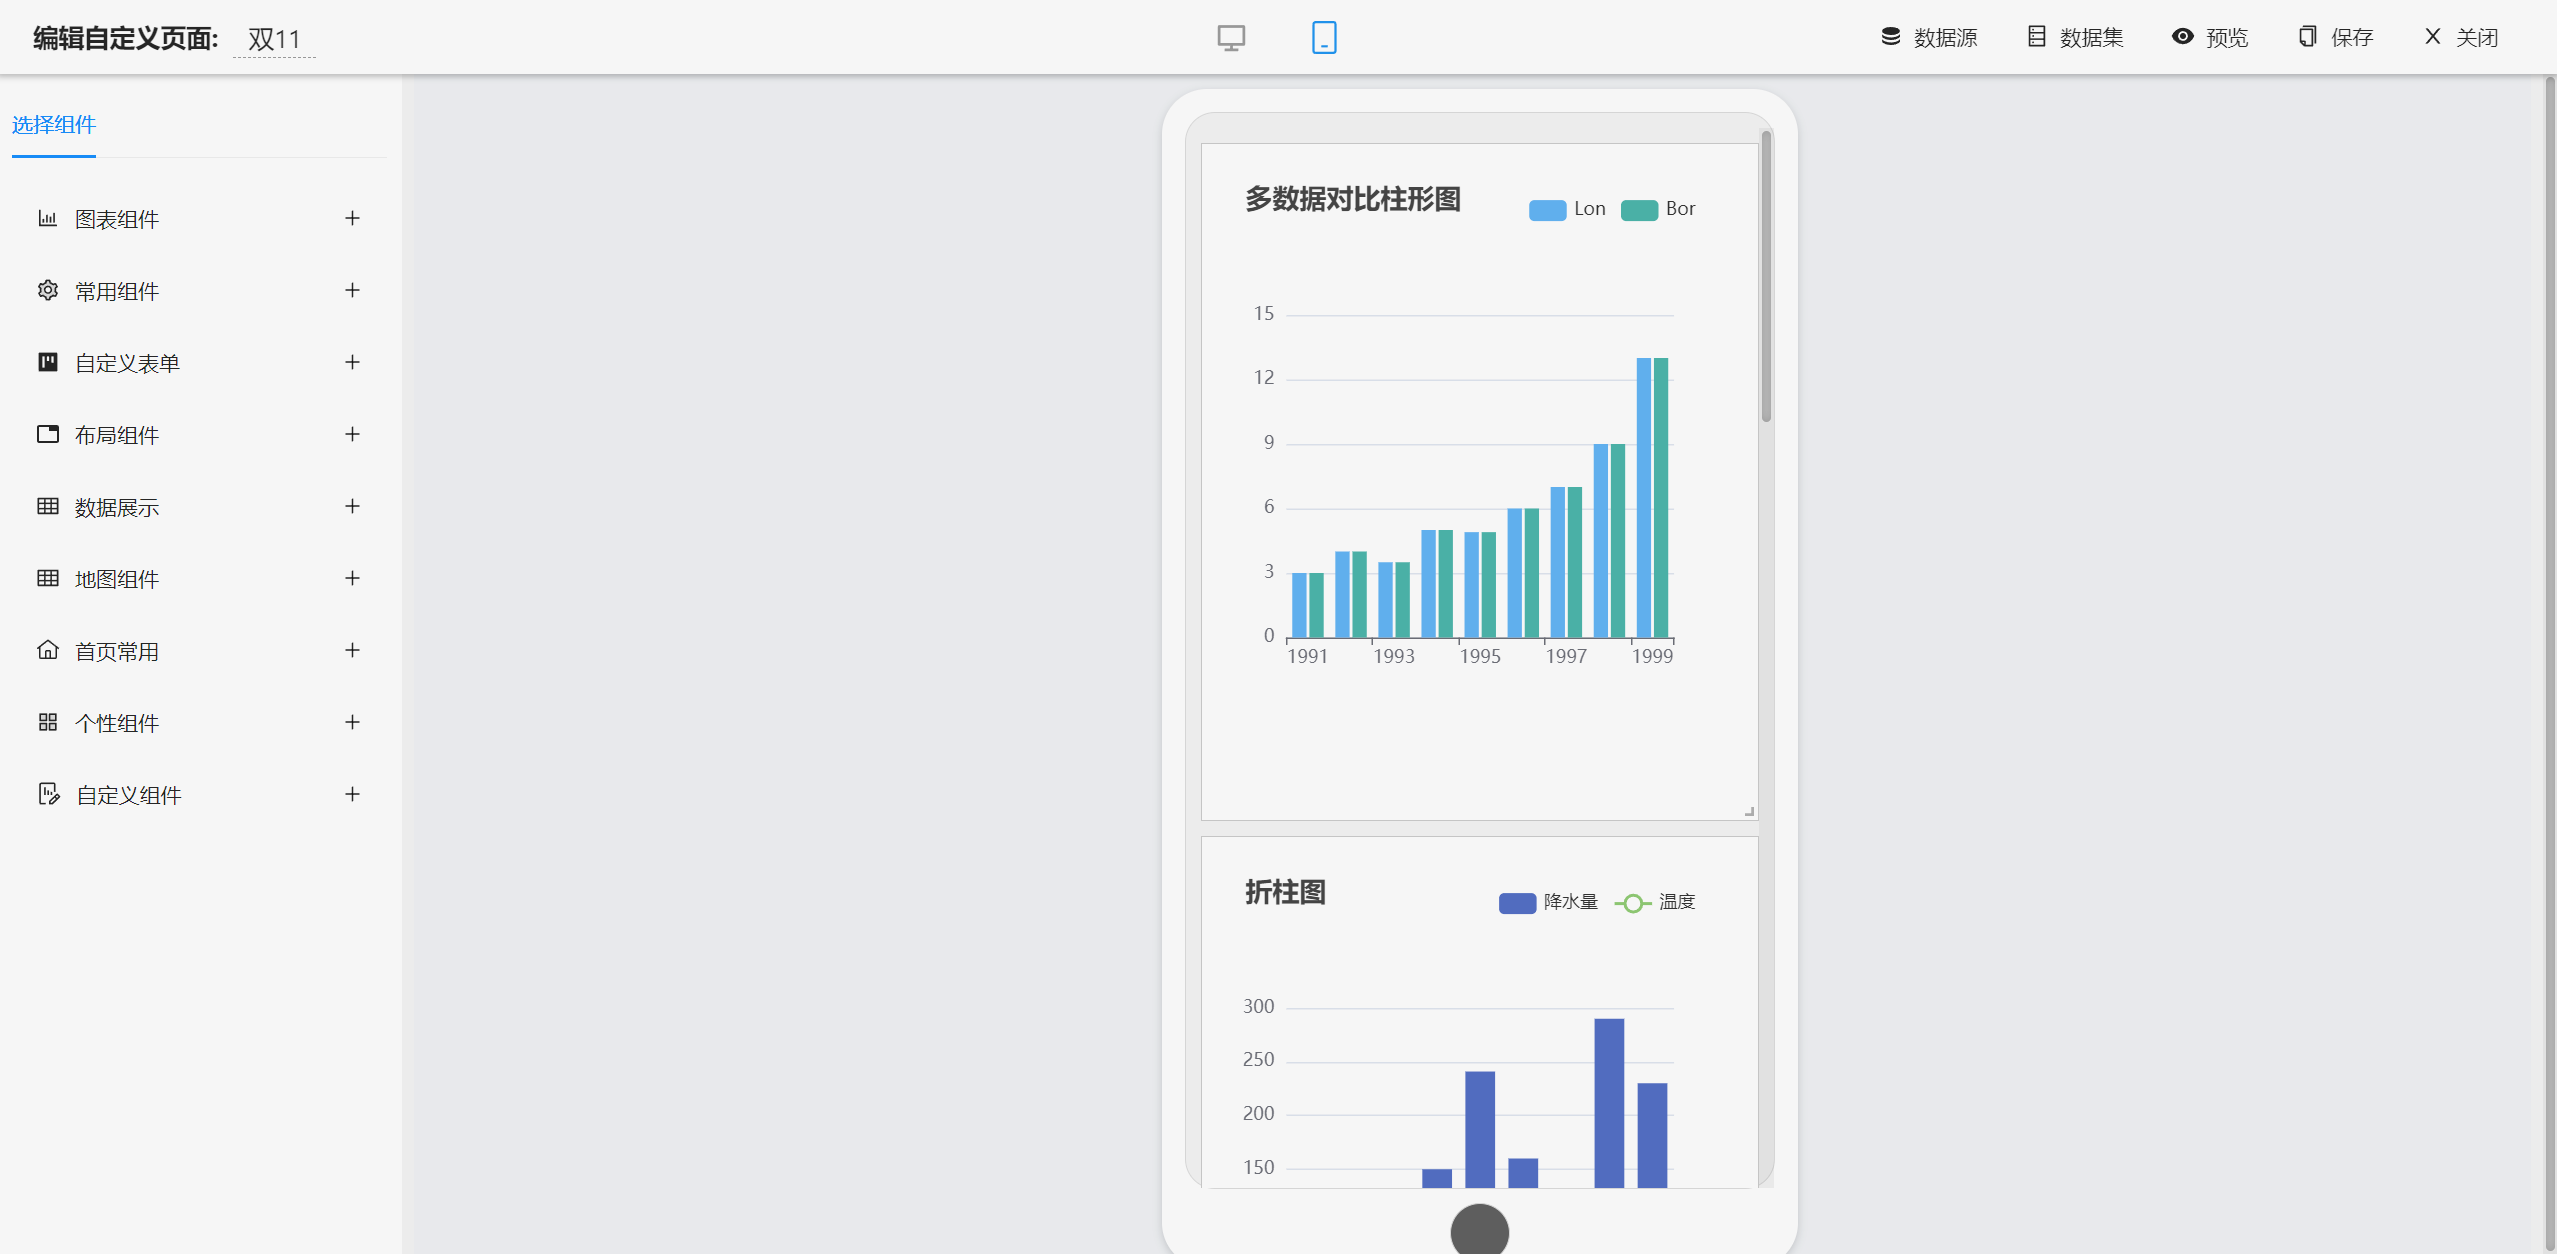
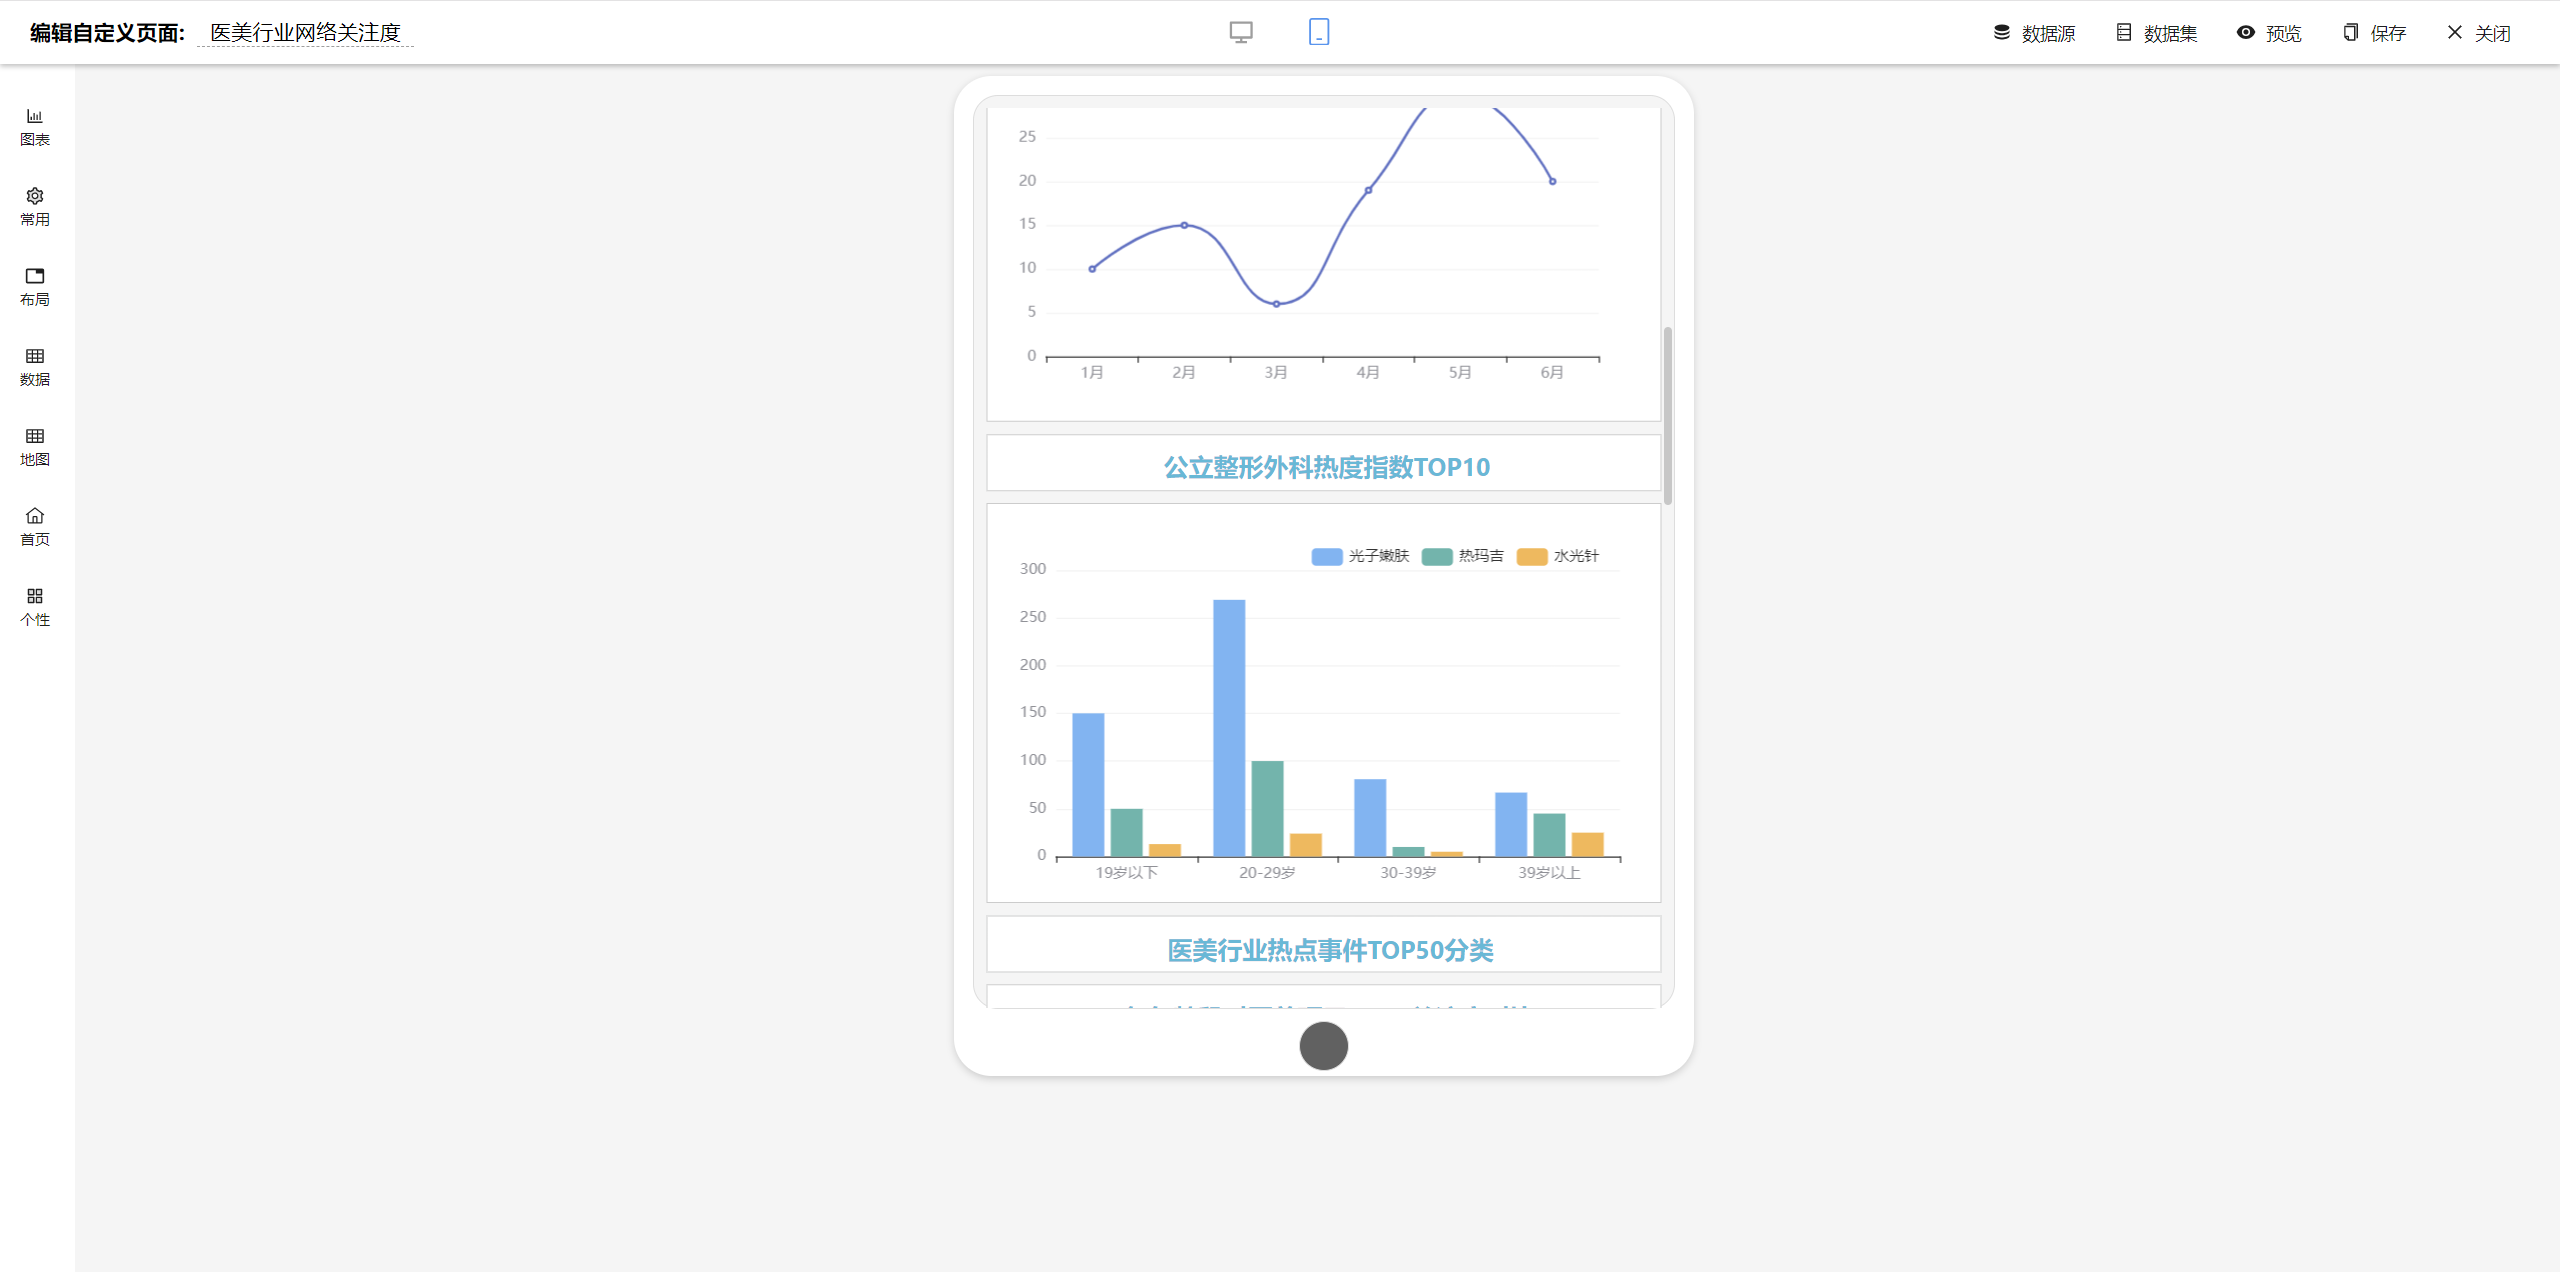
Dashboard and Portal Design
-----------------------------------


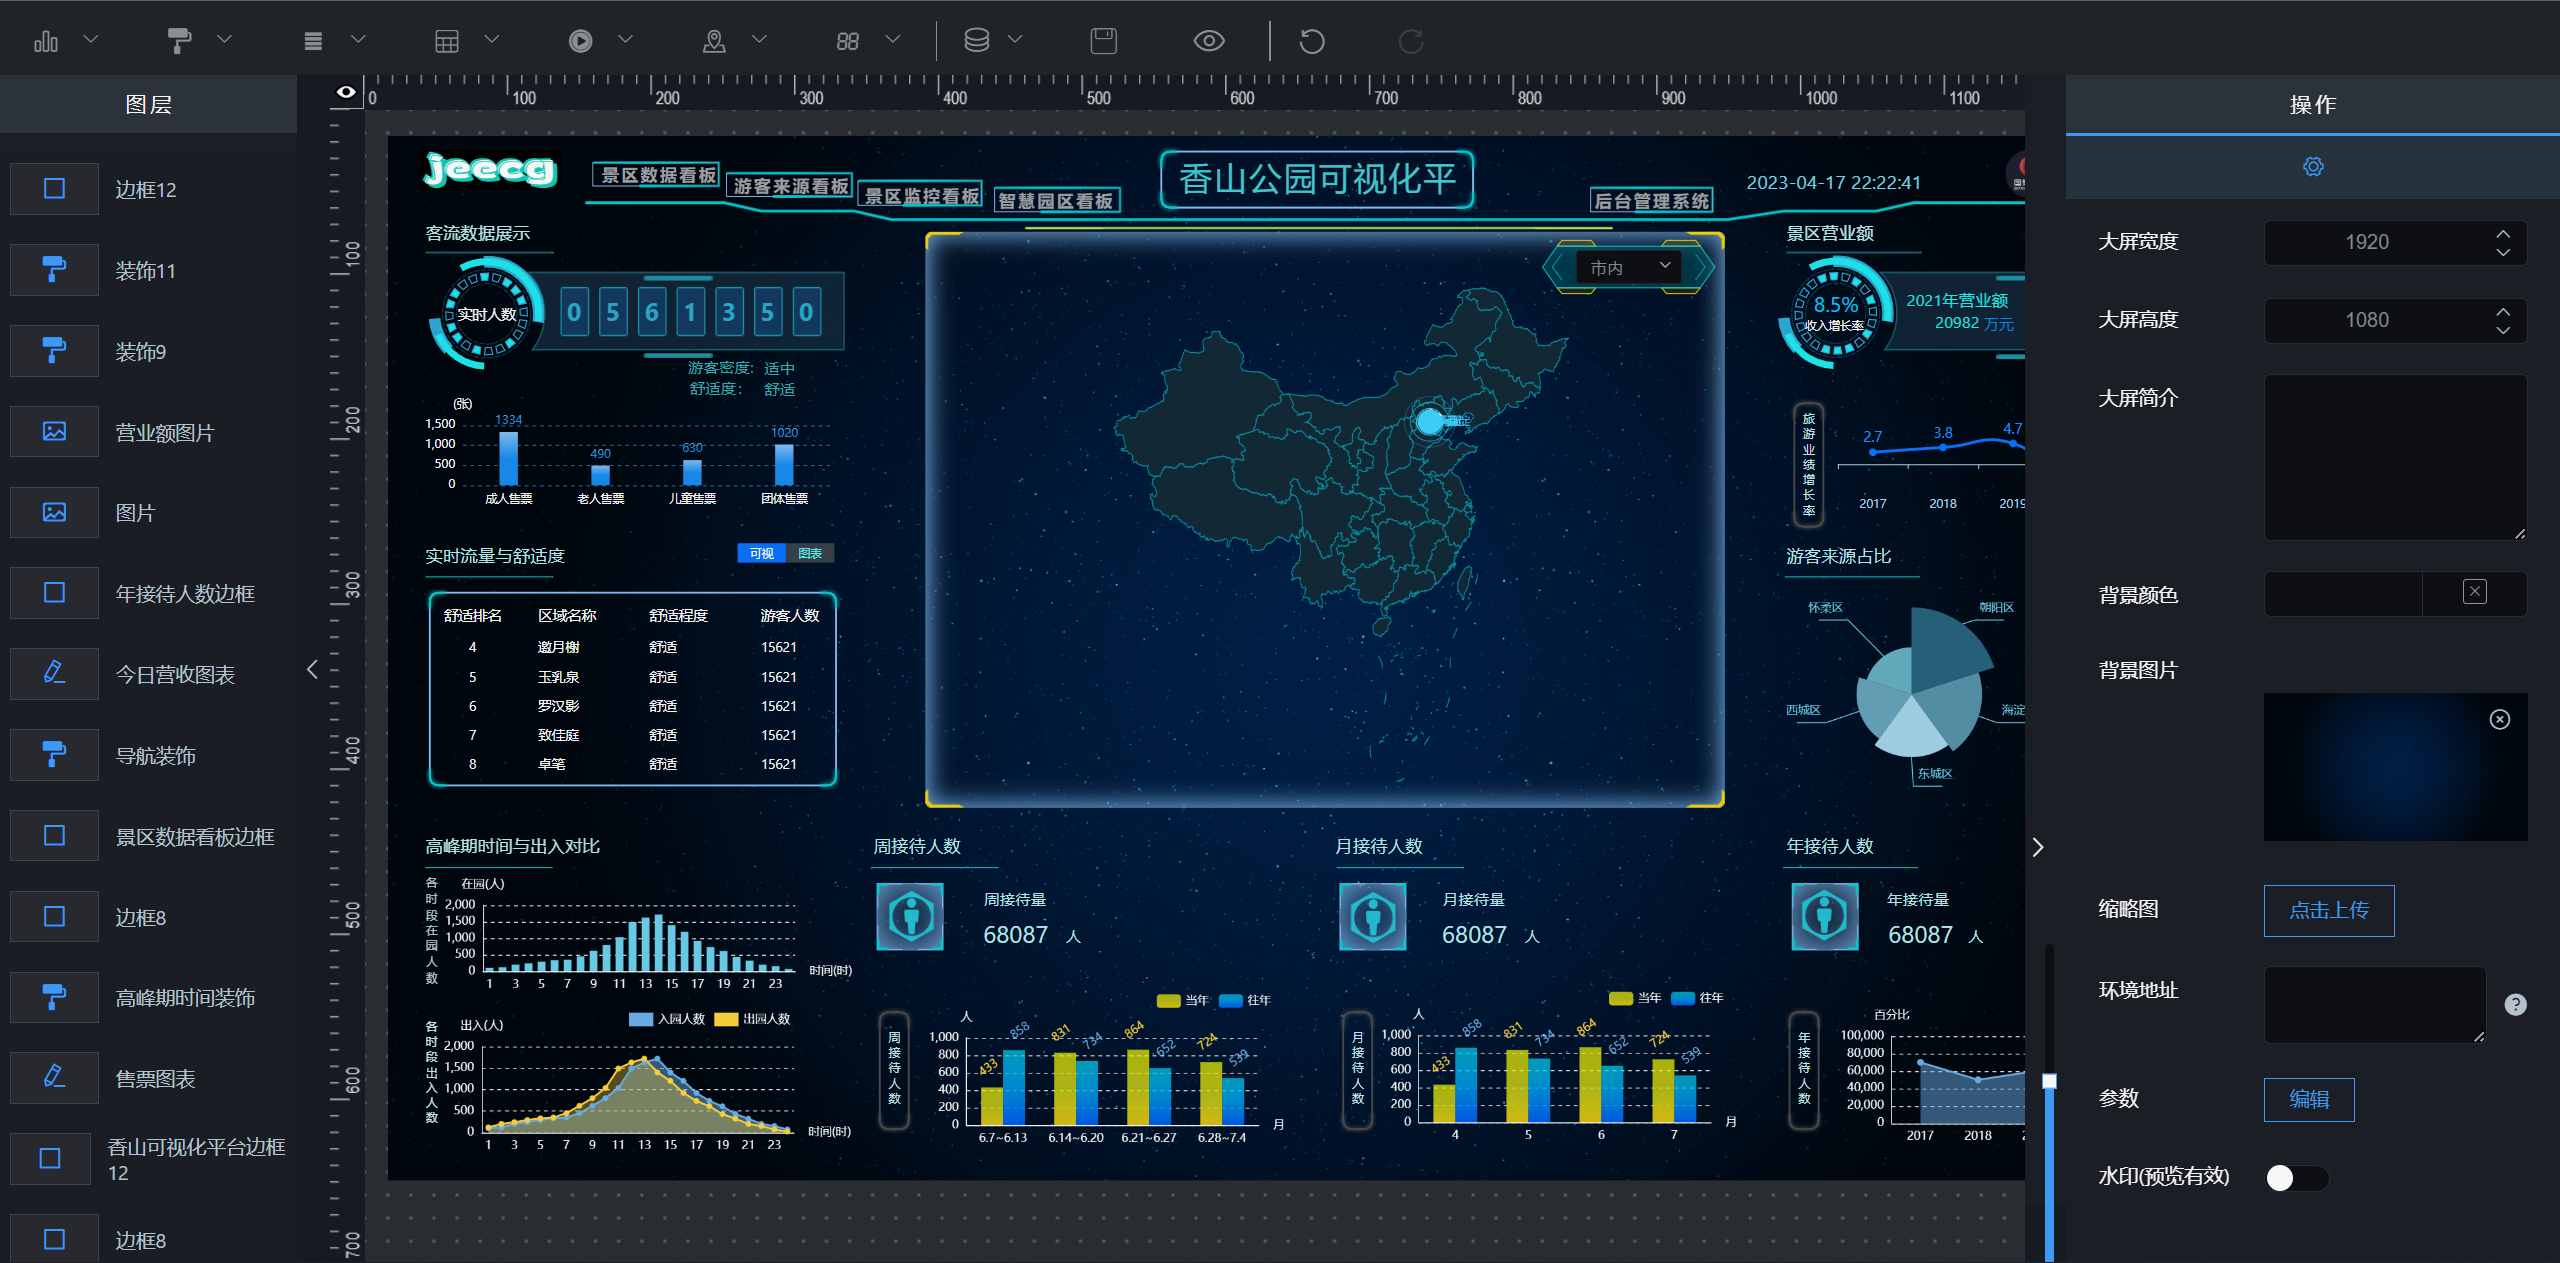
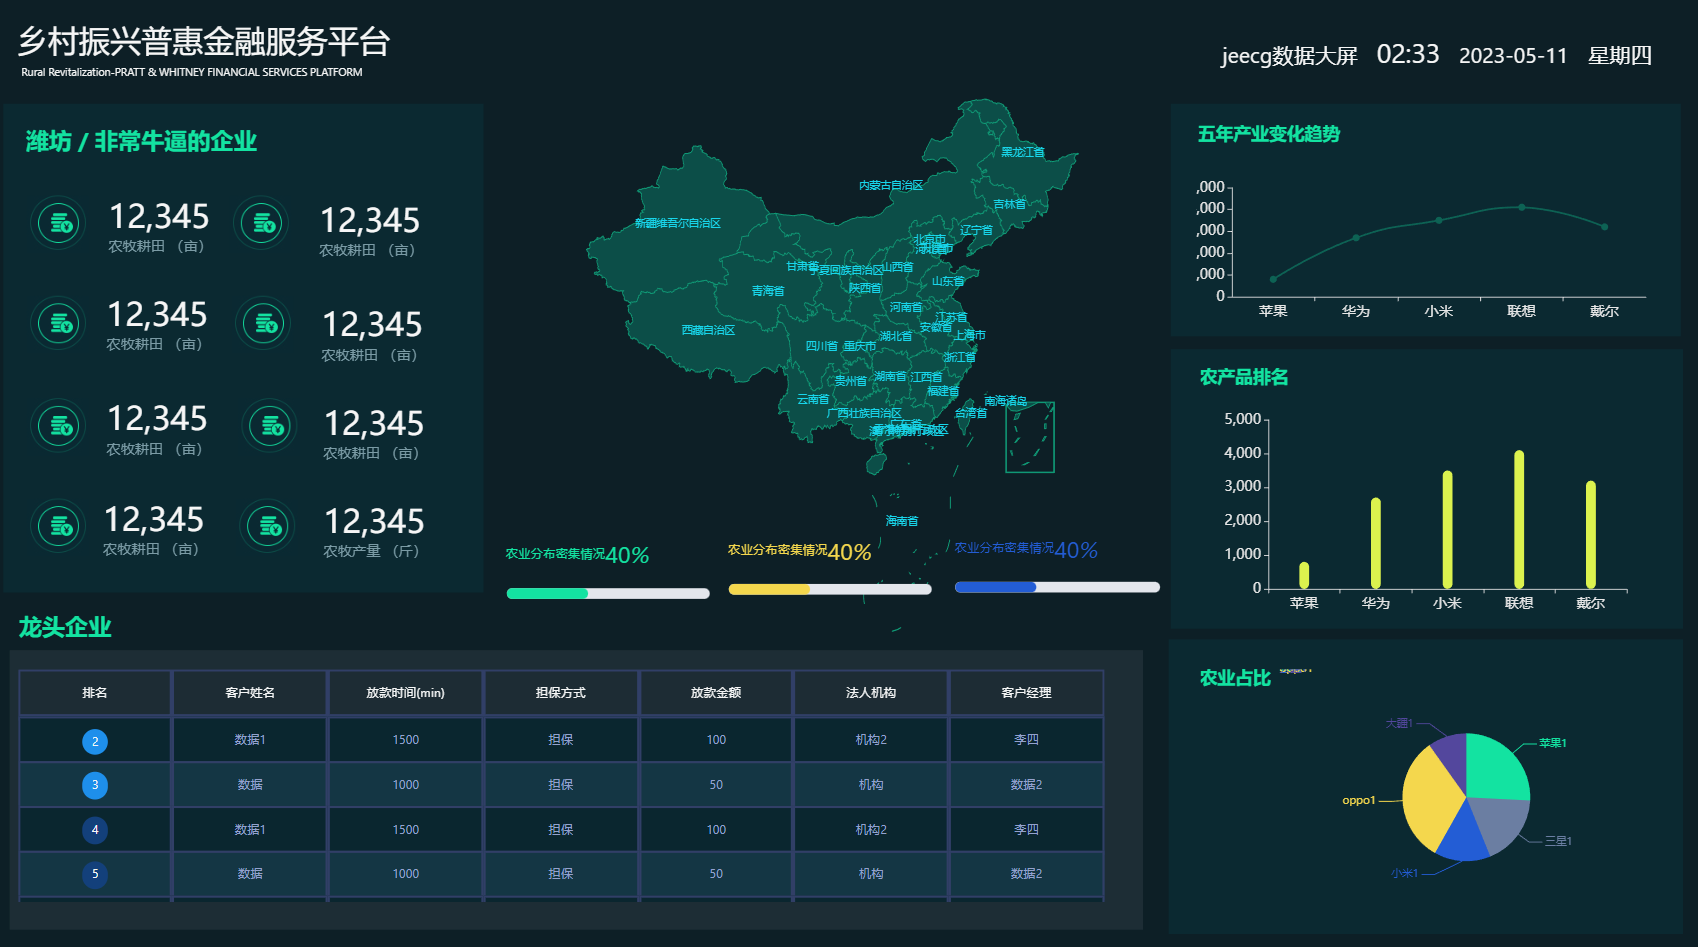
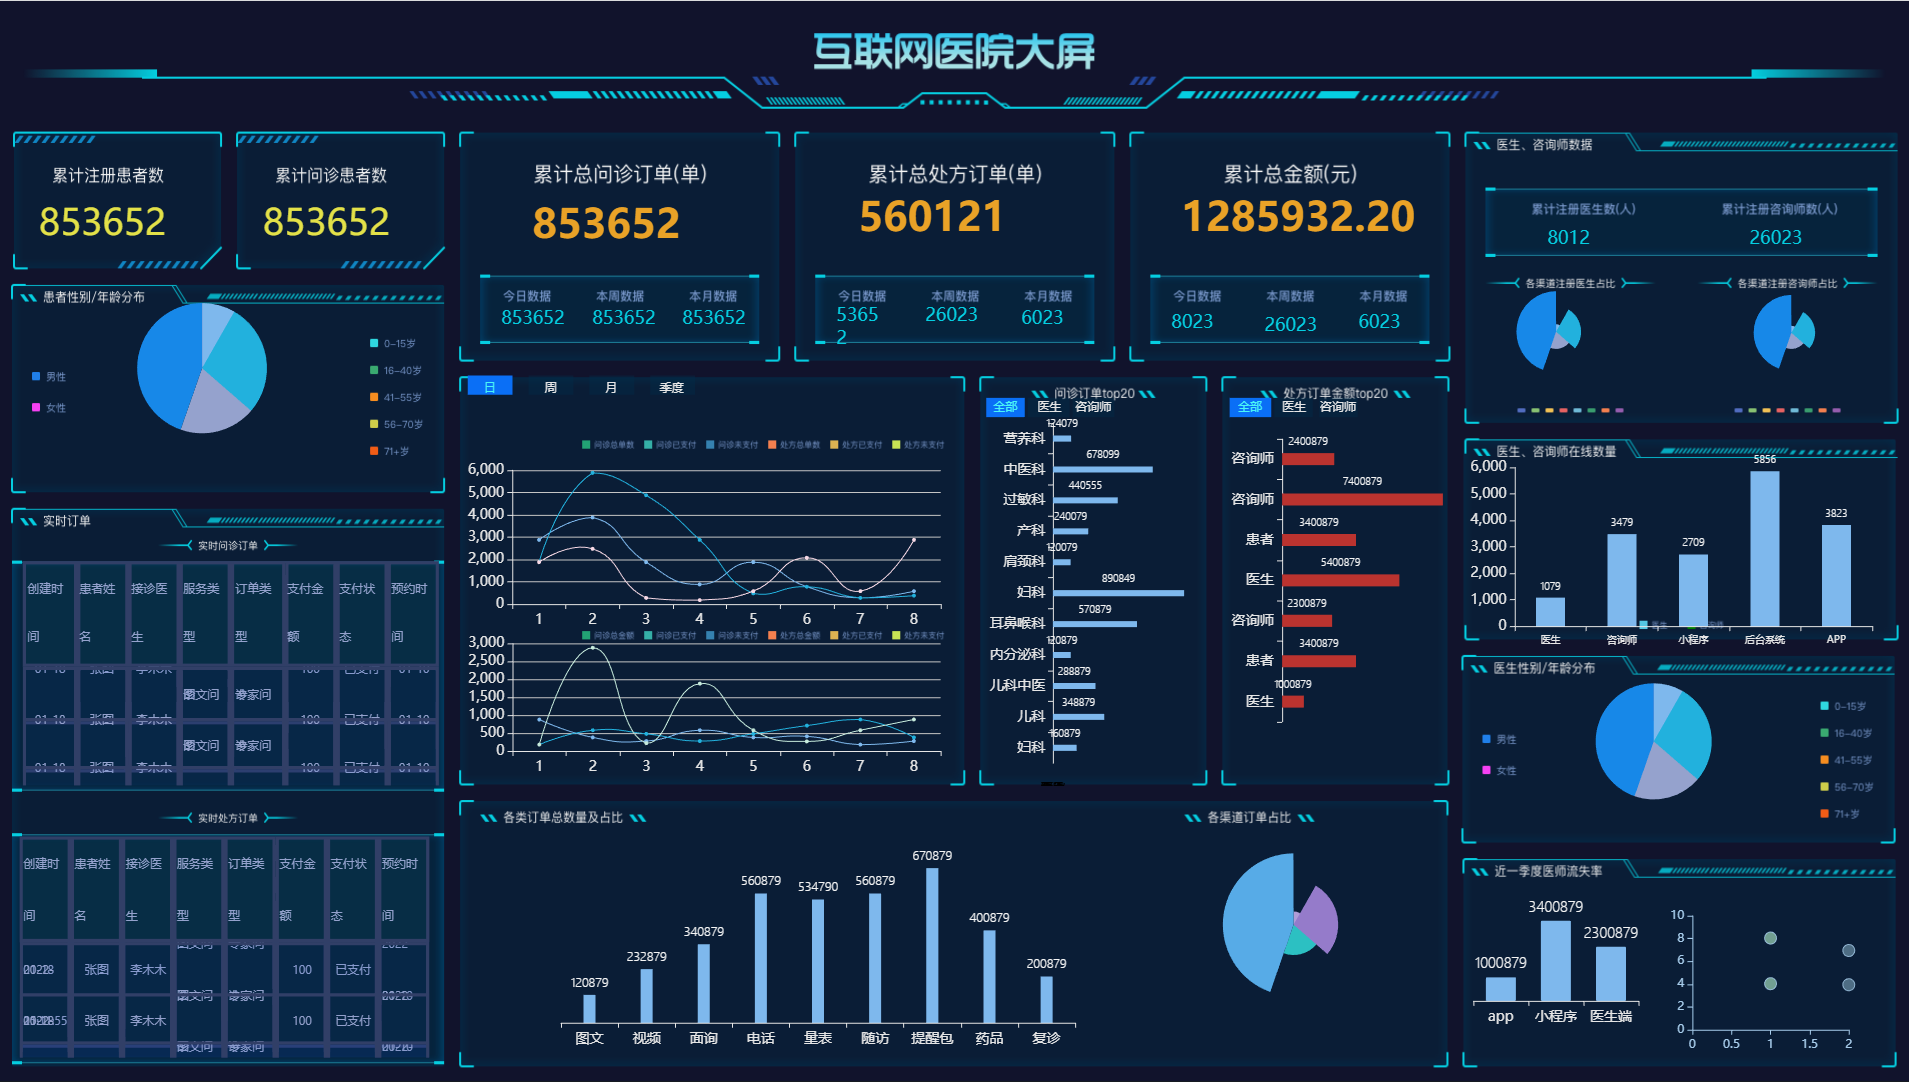
Large Screen Design Effects
-----------------------------------
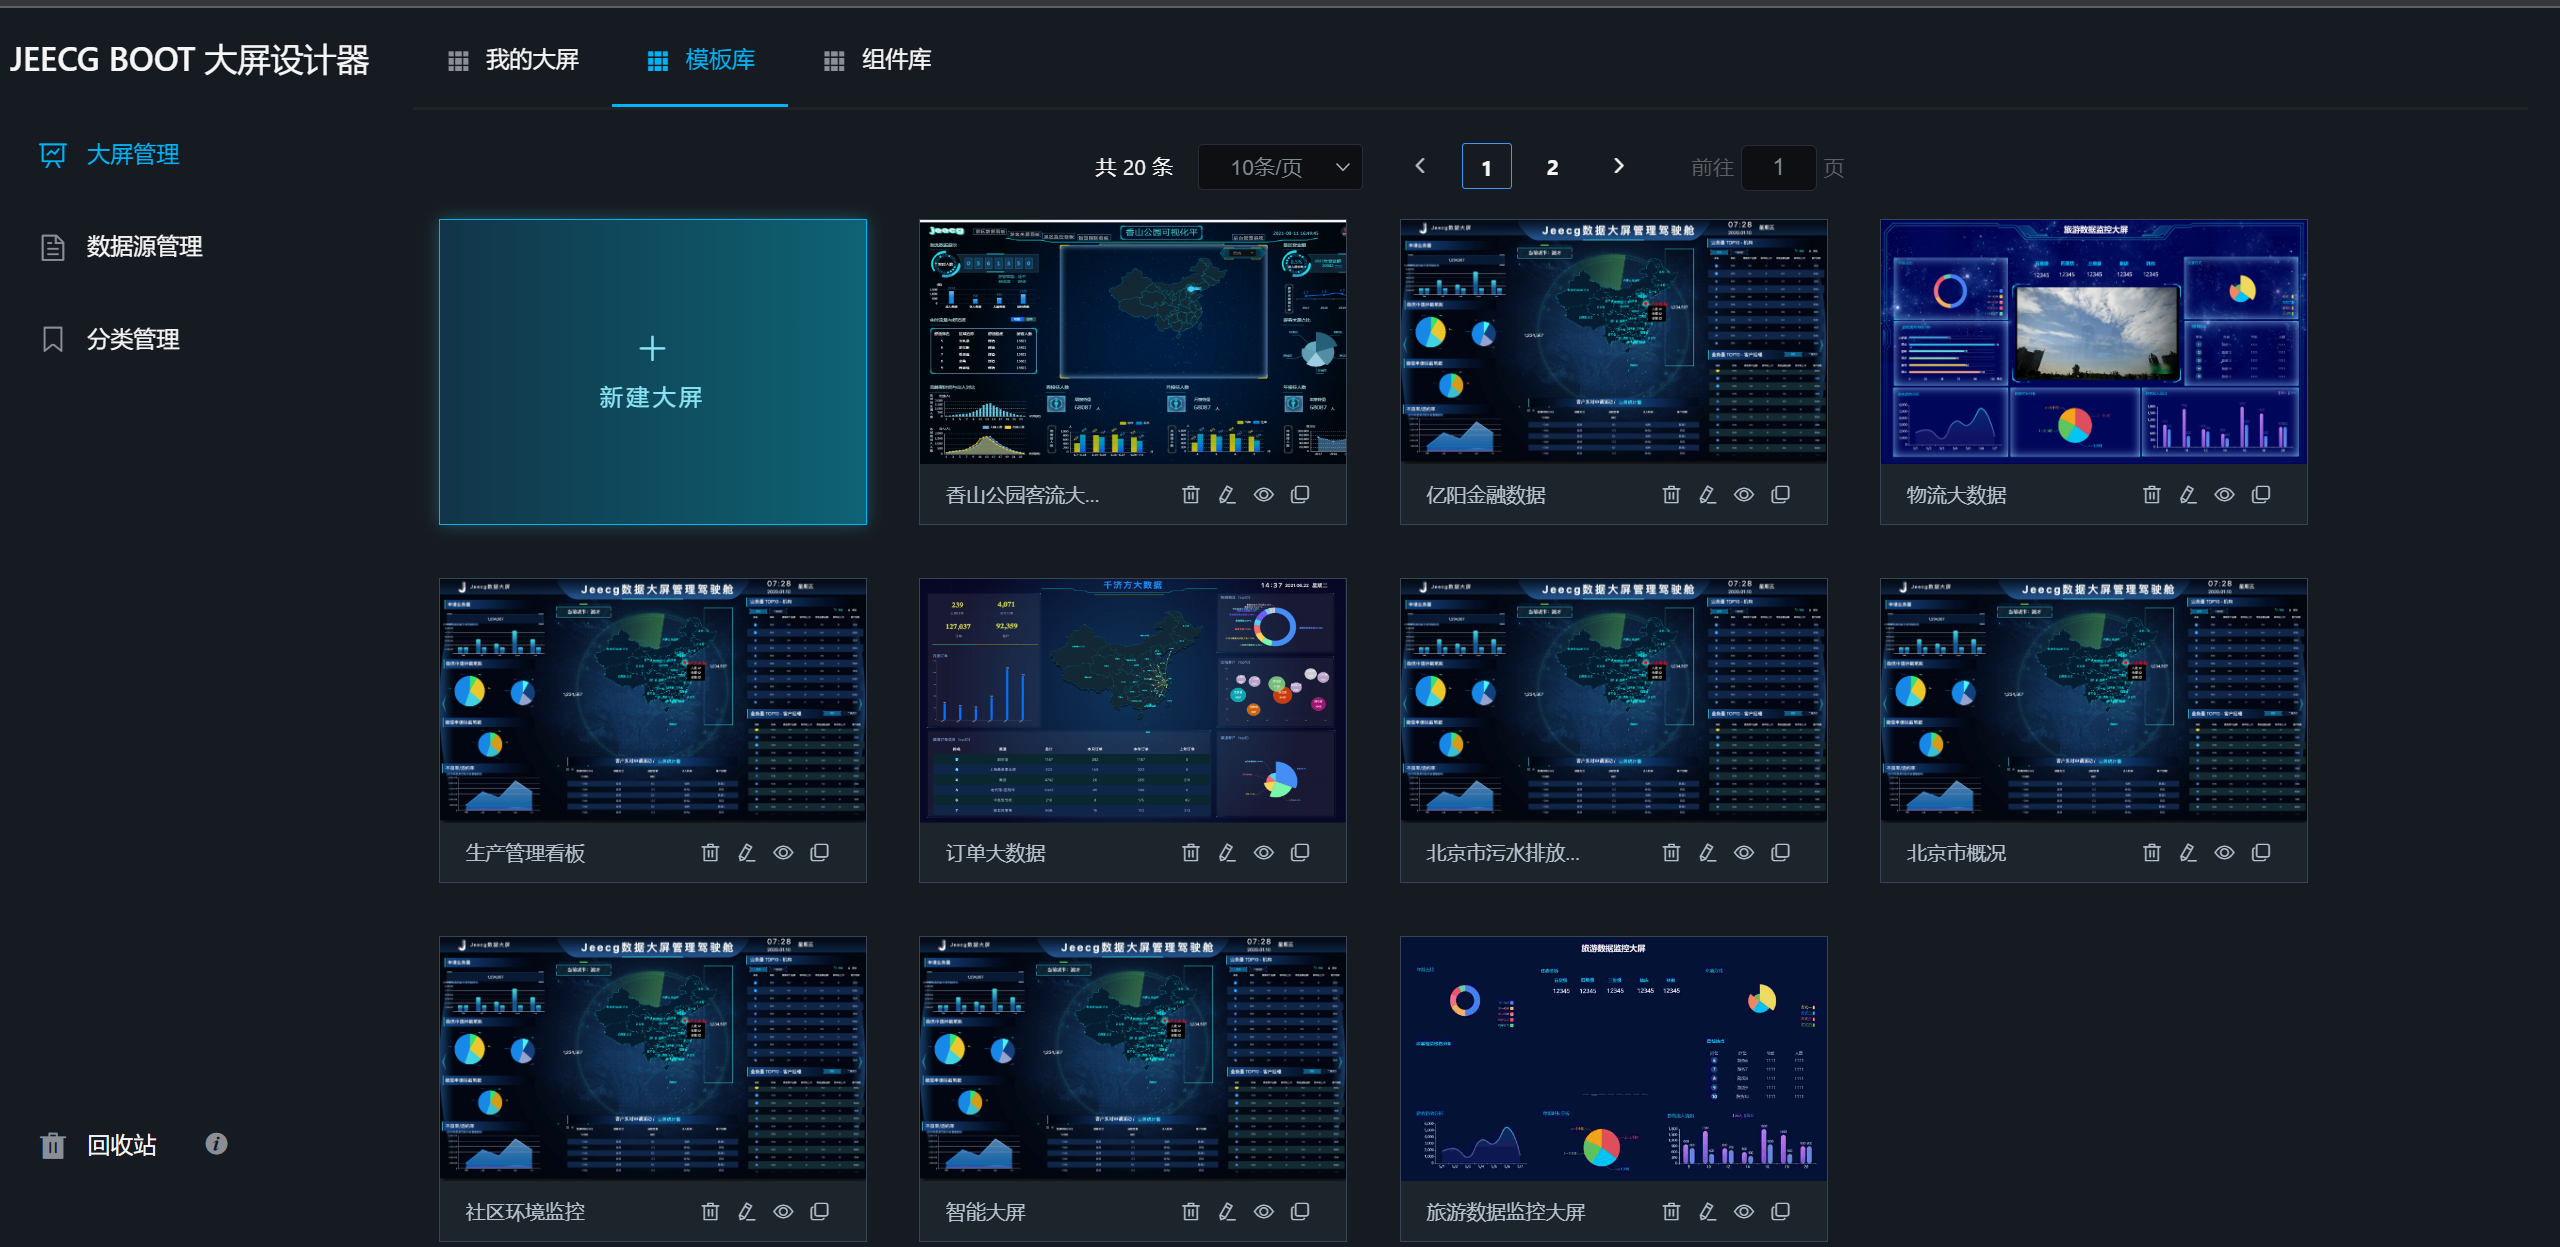
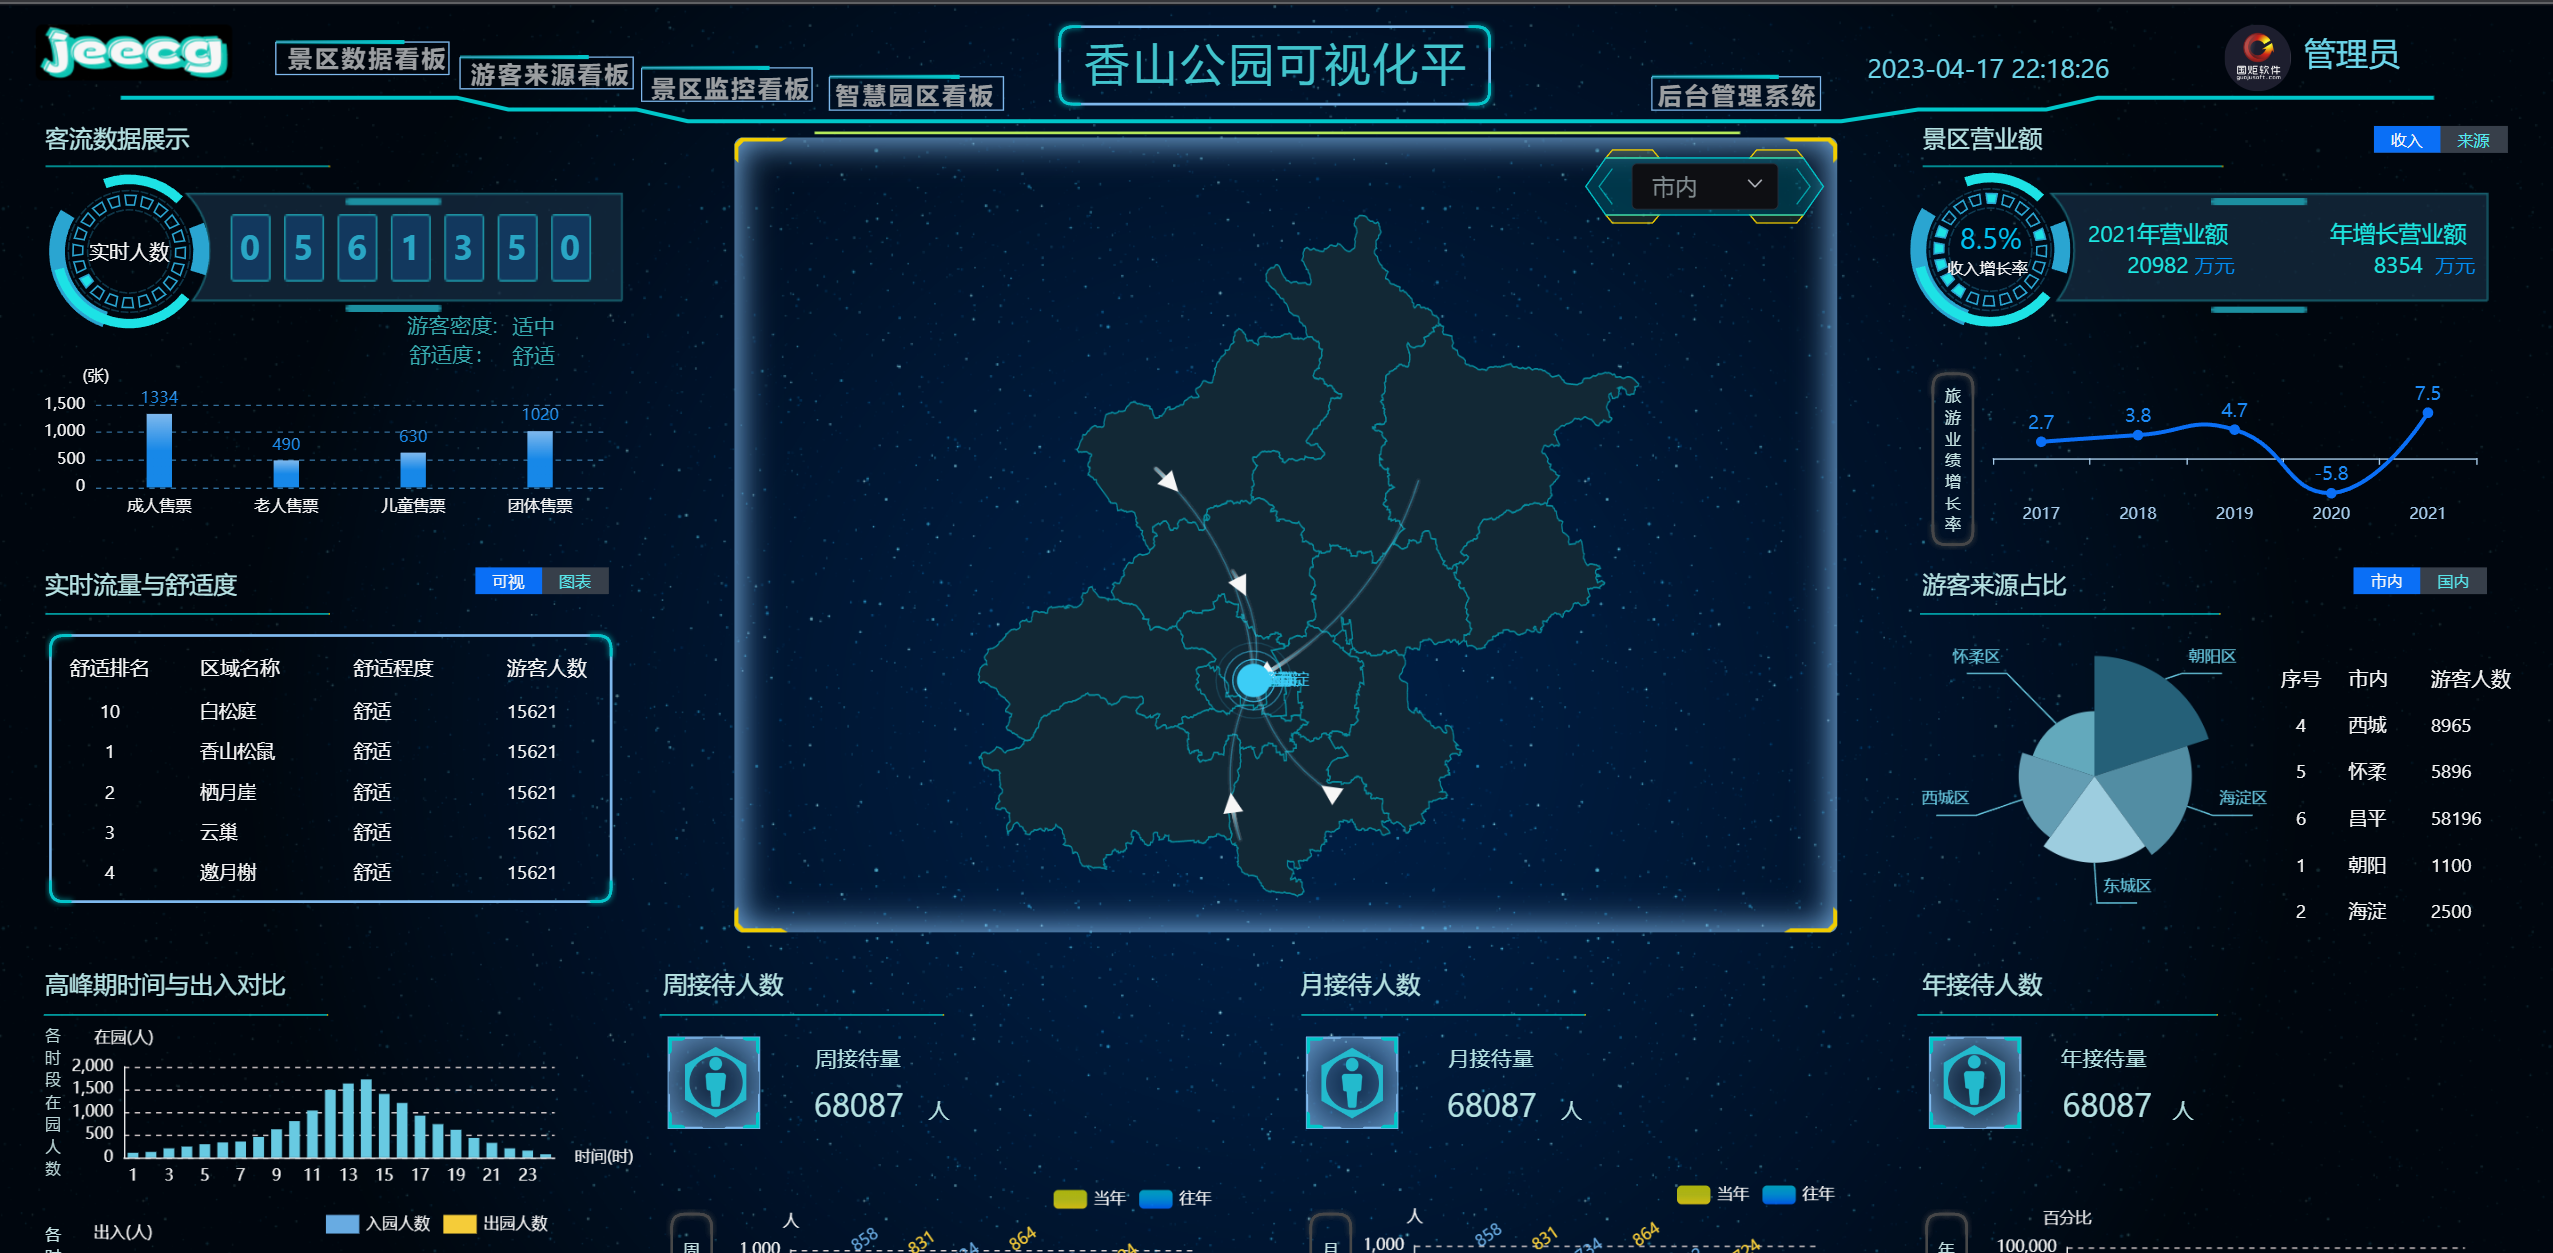
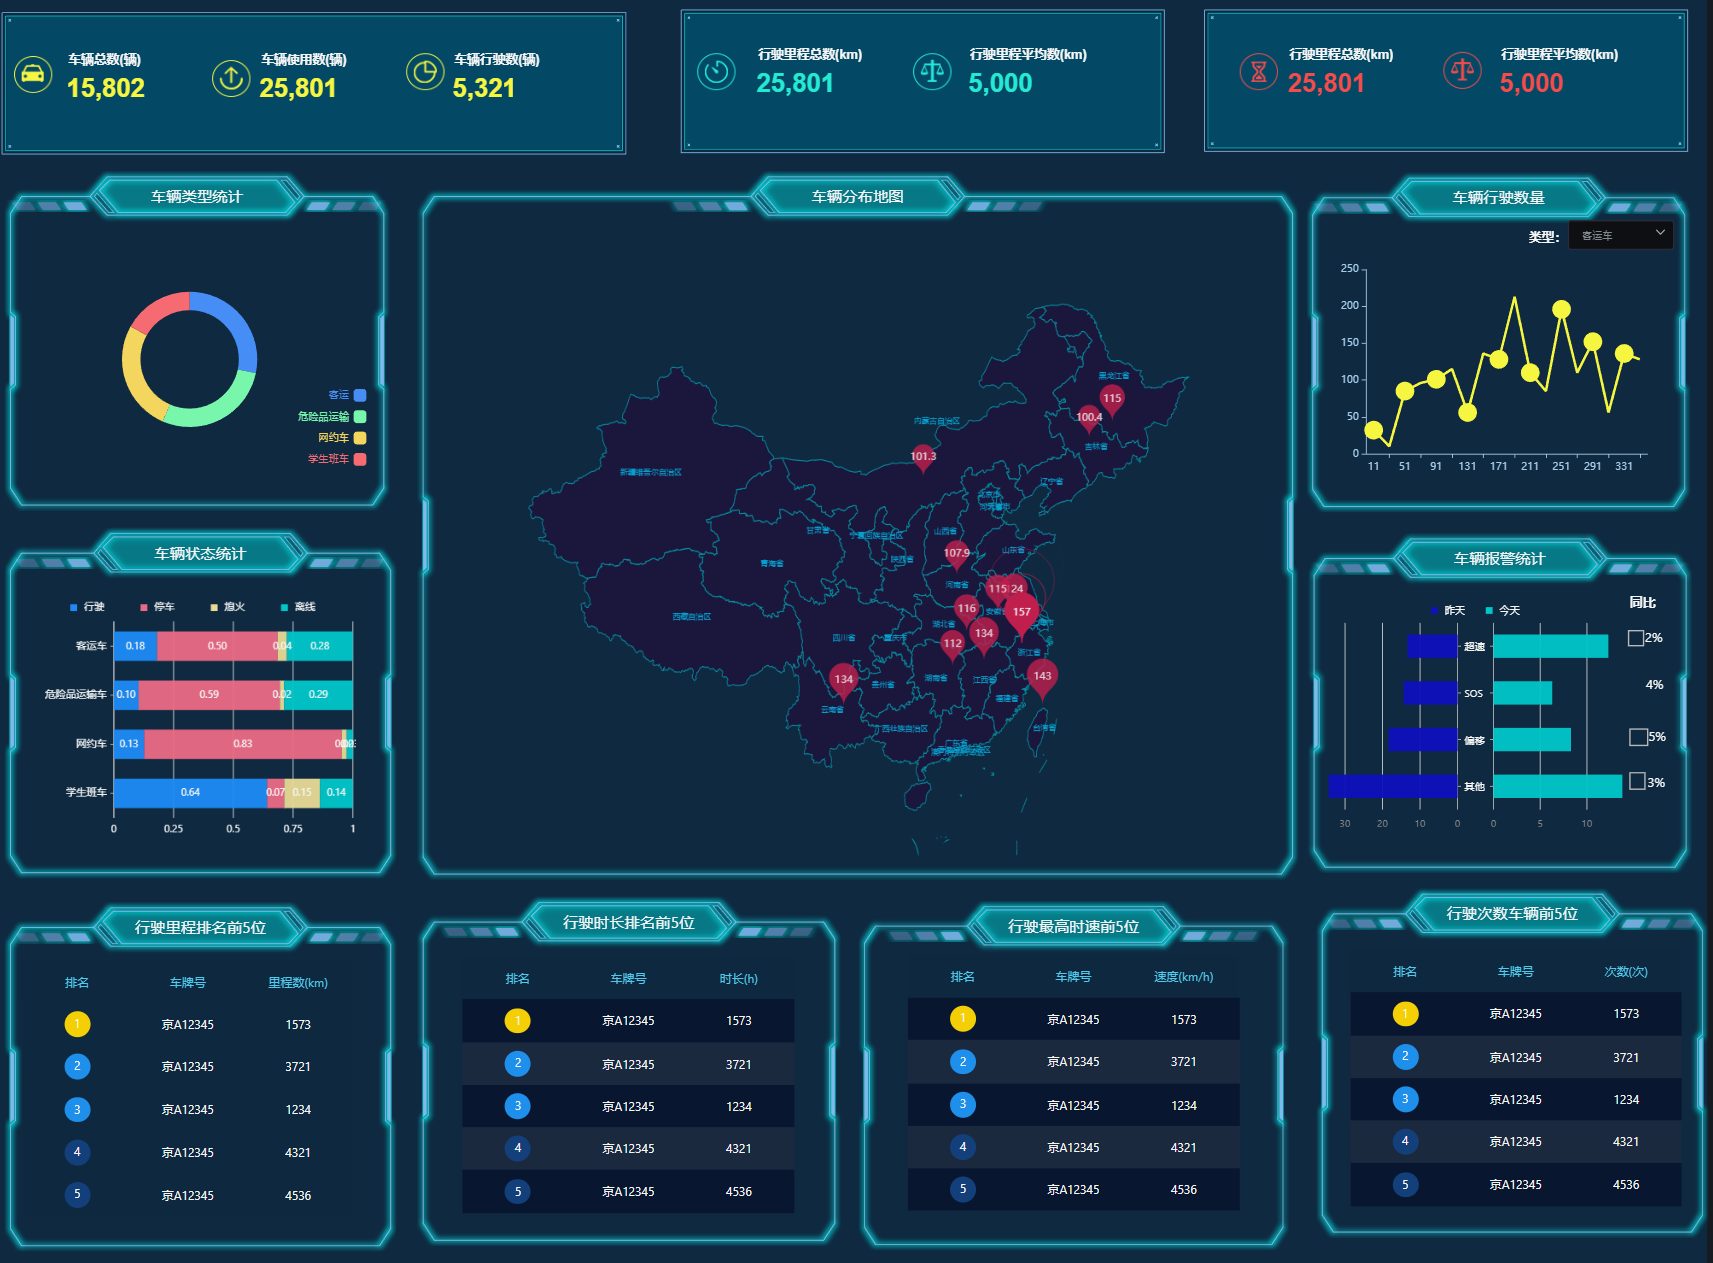
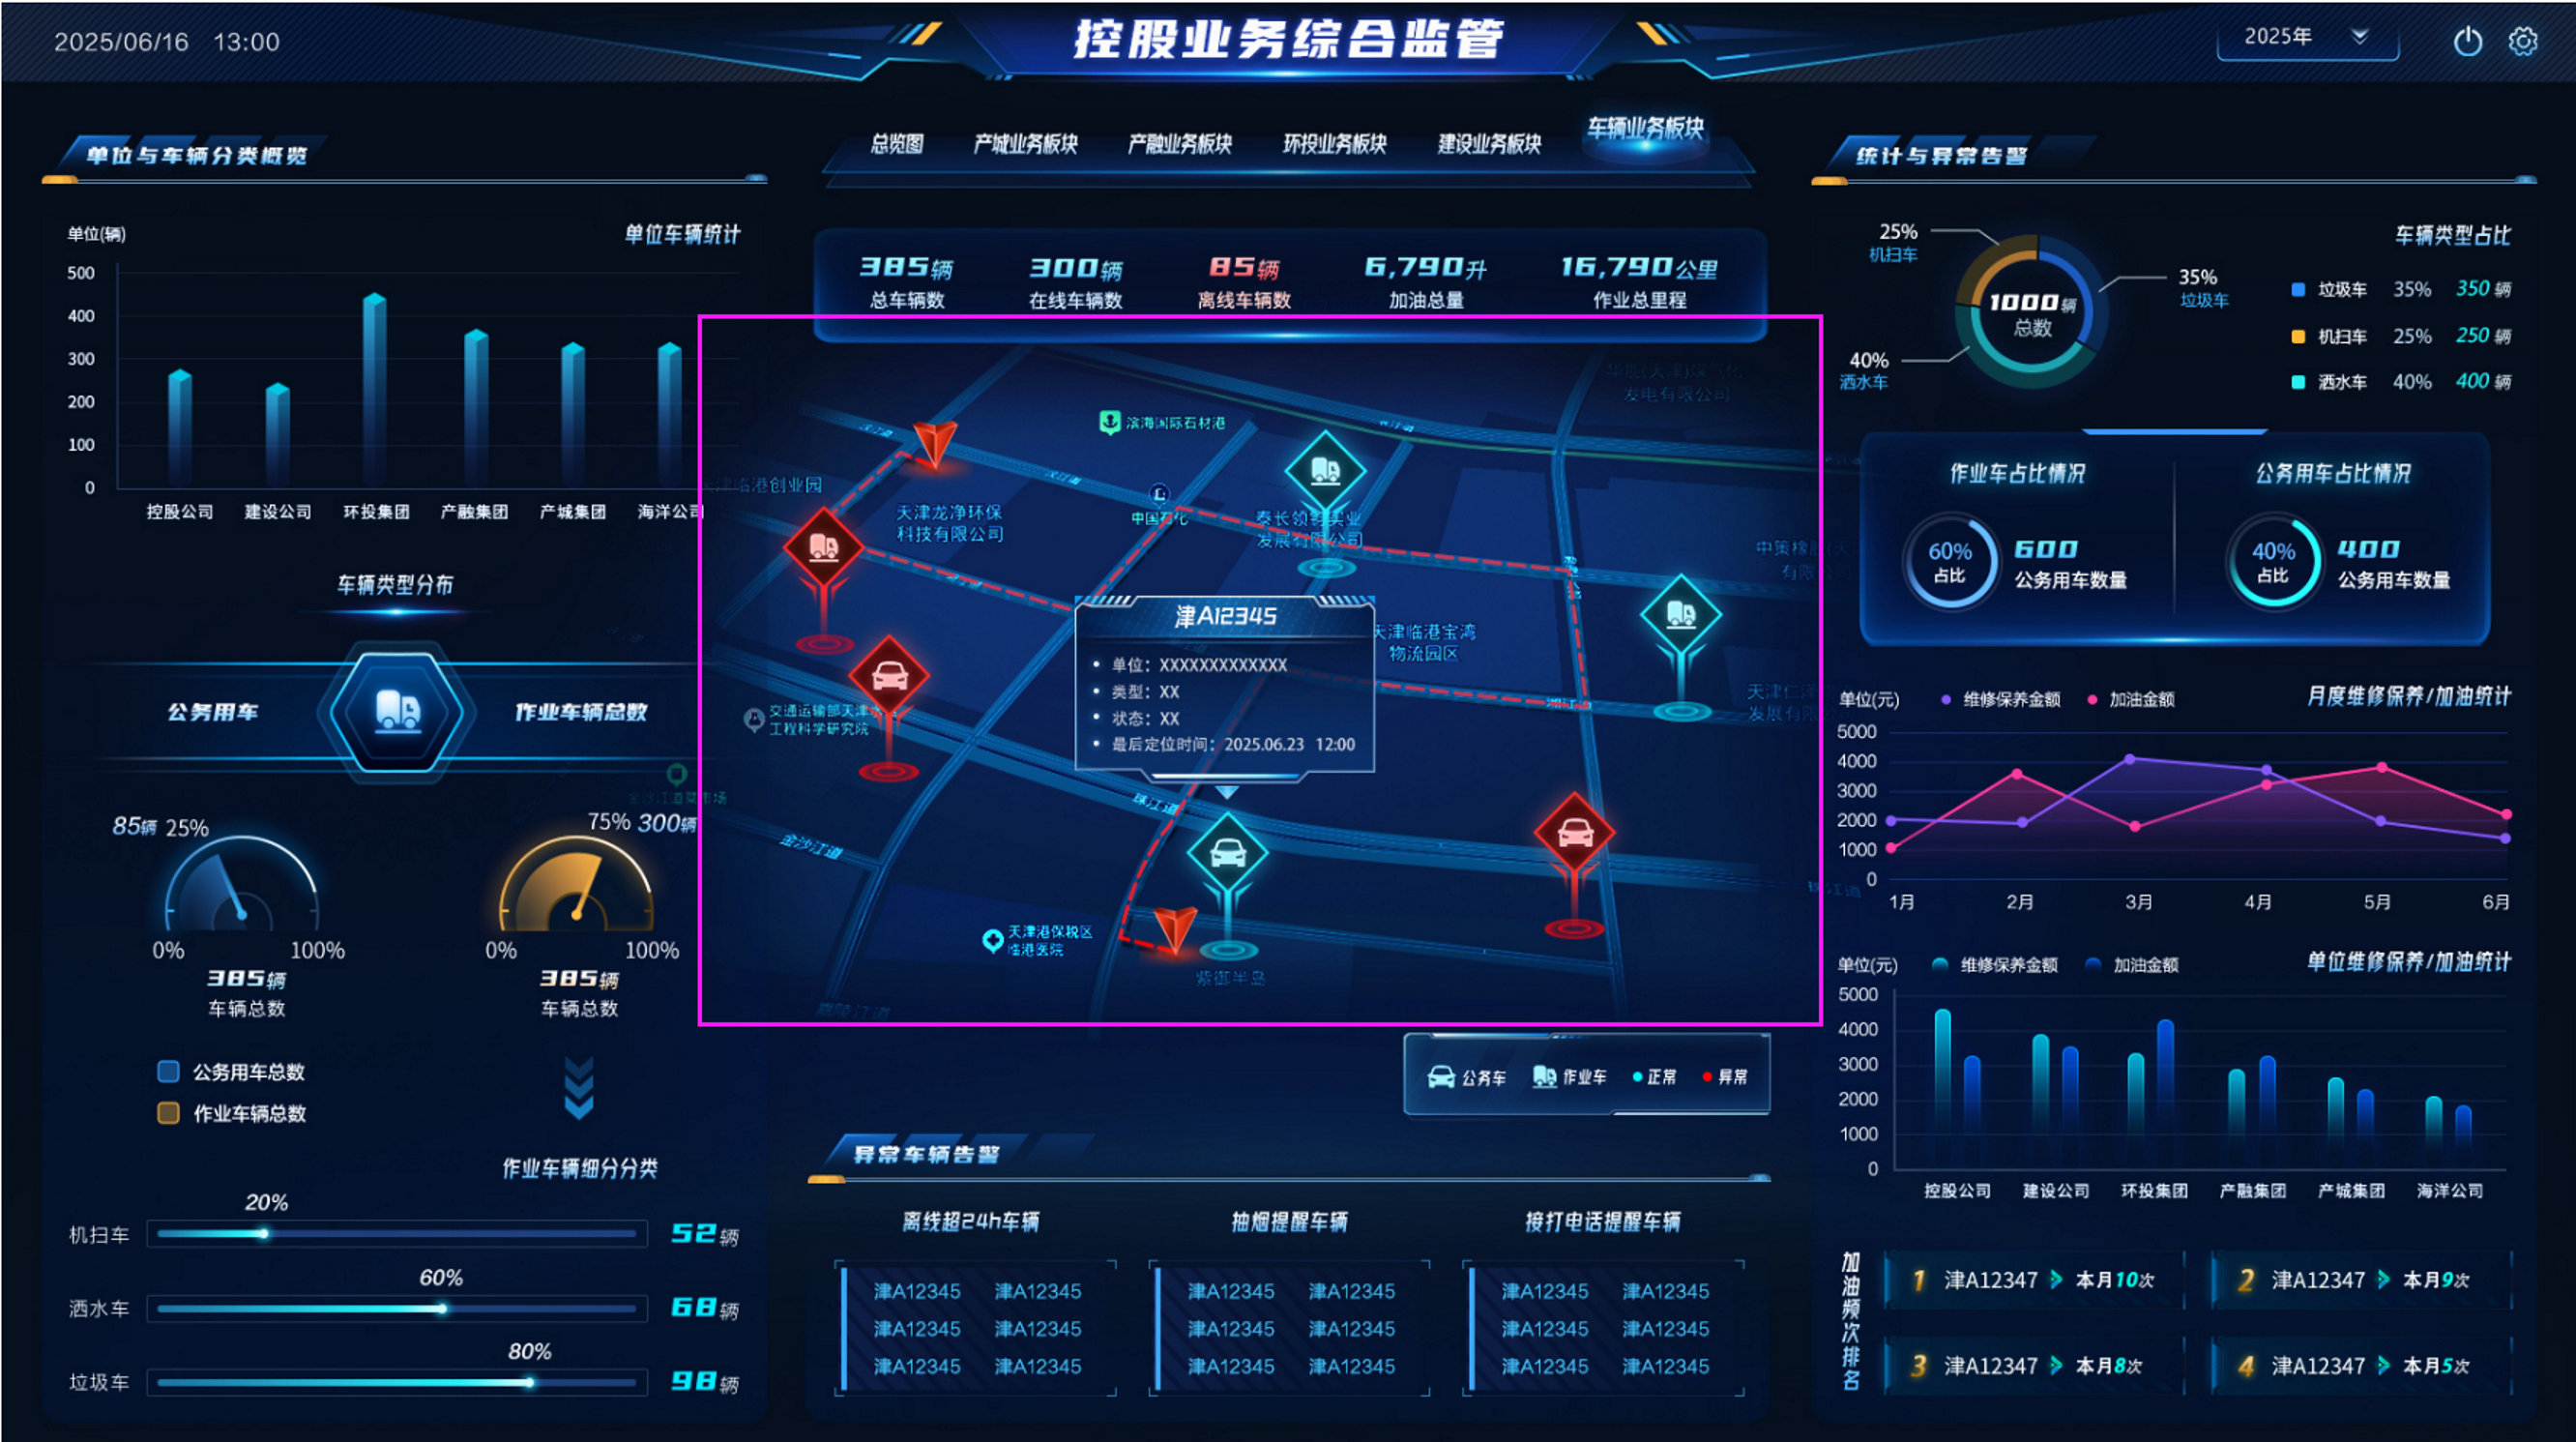
Advanced Large Screen Effects
-----------------------------------
- When clicking details, another large screen list page pops up
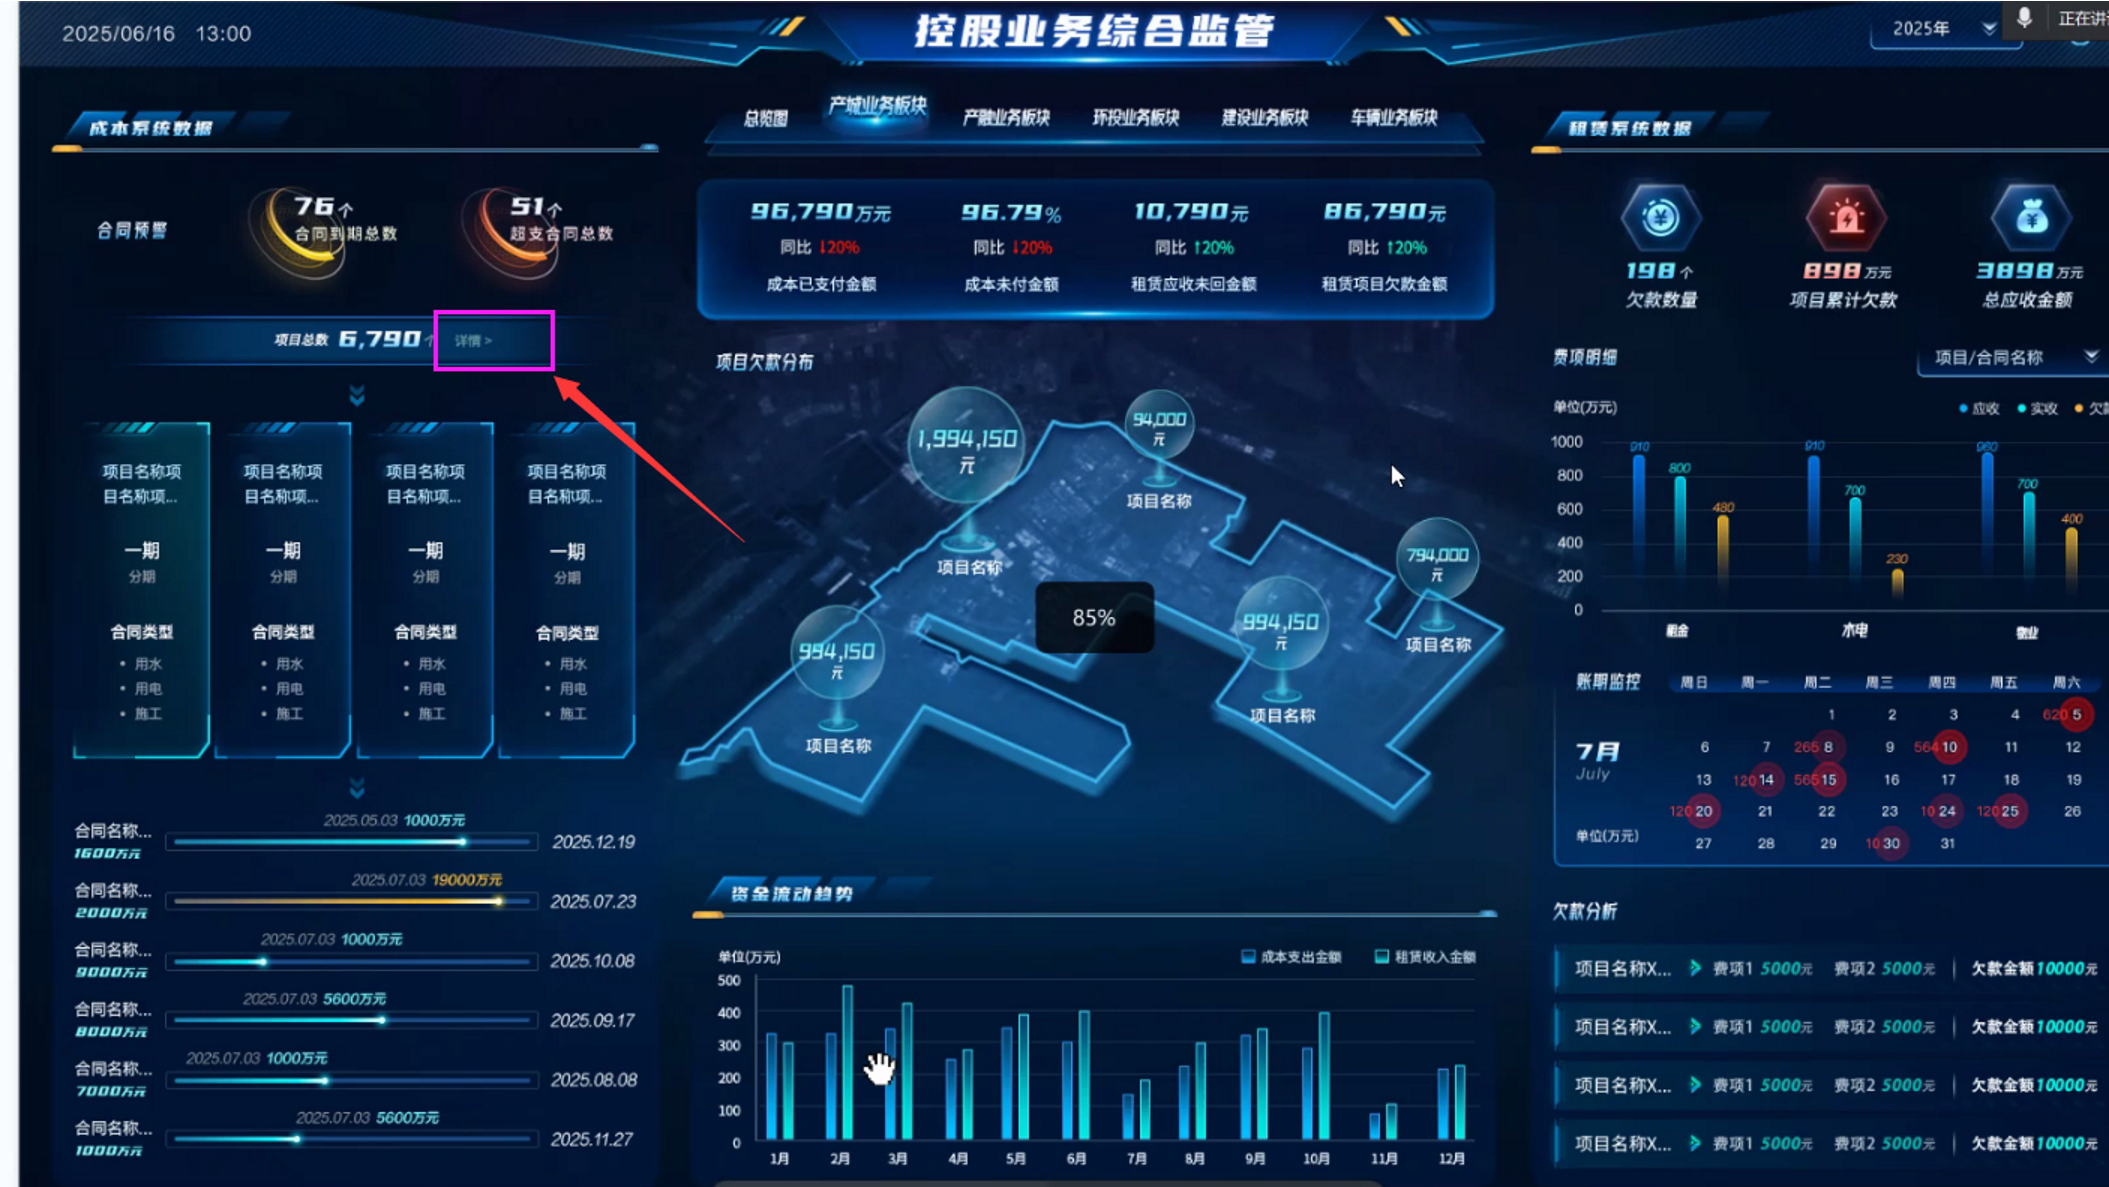
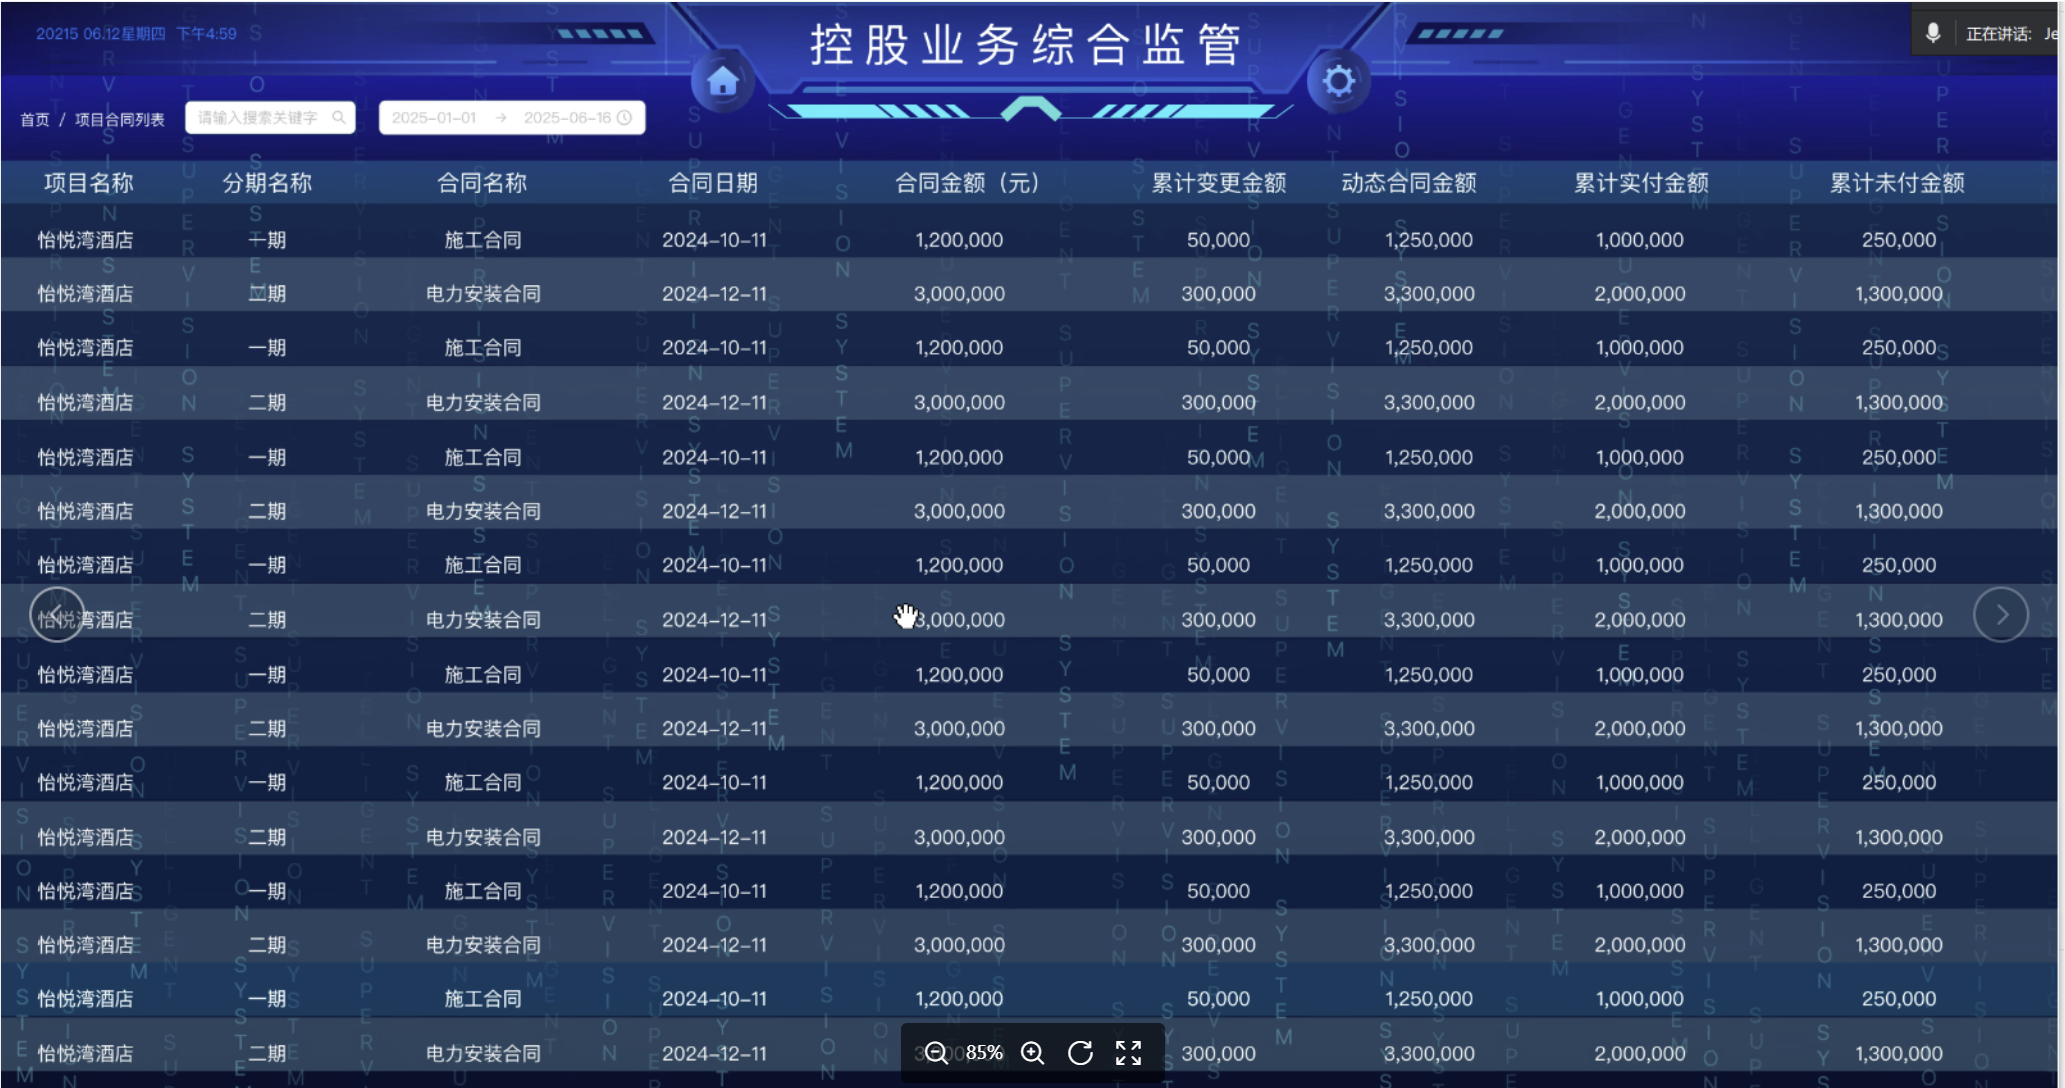
- Automatically switches to the next one every 5 minutes with cool dynamic transition effects
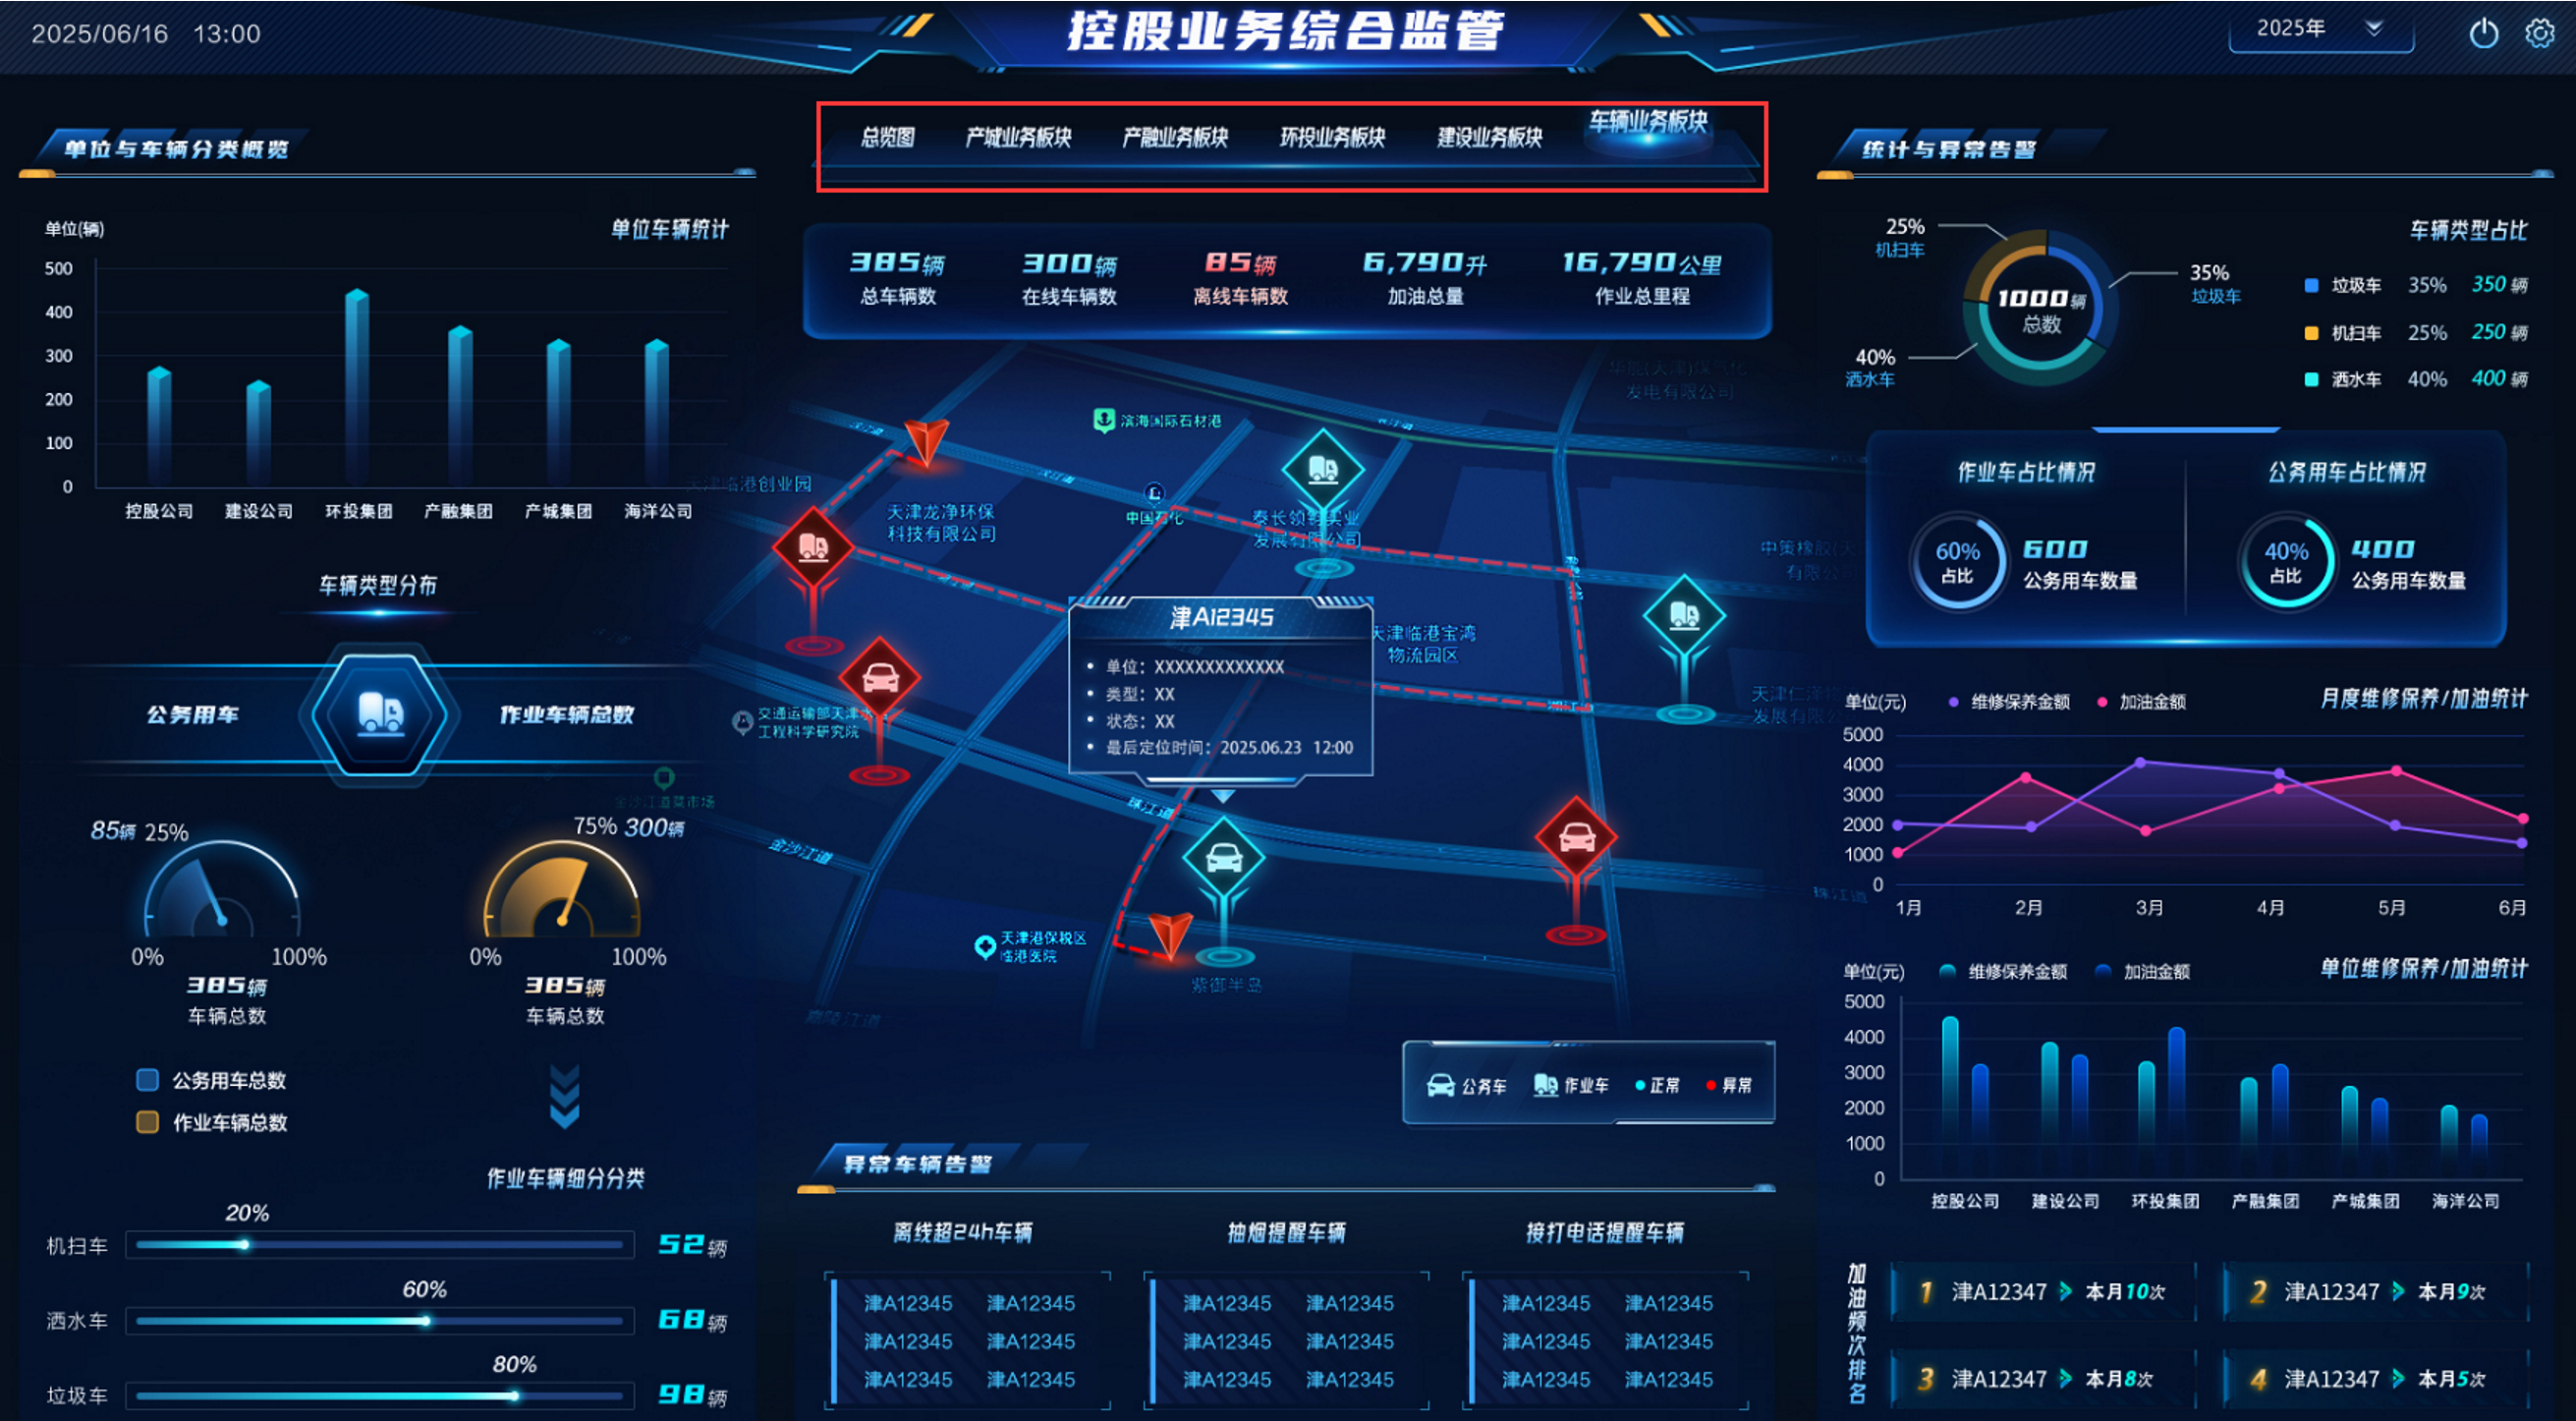
- Implemented through Gaode Maps, combined with business data to display real-time vehicle locations
Report Function List
-----------------------------------
More function list: [http://jimureport.com/plan](http://jimureport.com/plan)
```
├─Report Designer
│ ├─Data Source
│ │ ├─Supports multiple data sources such as Oracle, MySQL, SQLServer, PostgreSQL and other mainstream databases
│ │ ├─Supports intelligent SQL writing pages, allowing you to see table lists and field lists under data sources
│ │ ├─Supports parameters
│ │ ├─Supports single and multiple data source settings
│ ├─Cell Format
│ │ ├─Borders
│ │ ├─Font size
│ │ ├─Font color
│ │ ├─Background color
│ │ ├─Font bold
│ │ ├─Supports horizontal and vertical distributed alignment
│ │ ├─Supports automatic text wrapping settings
│ │ ├─Set images as image backgrounds
│ │ ├─Supports unlimited rows and columns
│ │ ├─Supports frozen windows within the designer
│ │ ├─Supports copying, pasting, and deleting cell content or format
│ │ ├─And more
│ ├─Report Elements
│ │ ├─Text type: Write text directly; supports setting decimal places for numeric text
│ │ ├─Image type: Supports uploading an image
│ │ ├─Chart type
│ │ ├─Function type
│ │ └─Supports sum
│ │ └─Average
│ │ └─Maximum
│ │ └─Minimum
│ ├─Background
│ │ ├─Background color settings
│ │ ├─Background image settings
│ │ ├─Background transparency settings
│ │ ├─Background size settings
│ ├─Data Dictionary
│ ├─Report Printing
│ │ ├─Custom printing
│ │ └─Custom style design printing for medical prescriptions, arrest warrants, introduction letters, etc.
│ │ ├─Simple data printing
│ │ └─Inventory receipts, sales table printing
│ │ └─Parameterized printing
│ │ └─Paginated printing
│ │ ├─Form overlay printing
│ │ └─Real estate certificate printing
│ │ └─Invoice printing
│ ├─Data Reports
│ │ ├─Grouped data reports
│ │ └─Horizontal data grouping
│ │ └─Vertical data grouping
│ │ └─Multi-level loop header grouping
│ │ └─Horizontal grouping subtotals
│ │ └─Vertical grouping subtotals
│ │ └─Grand totals
│ │ ├─Cross-tabulation reports
│ │ ├─Detail tables
│ │ ├─Conditional query reports
│ │ ├─Expression reports
│ │ ├─QR code/barcode reports
│ │ ├─Multi-header complex reports
│ │ ├─Master-detail reports
│ │ ├─Alert reports
│ │ ├─Data drill-down reports
│ ├─Chart Reports
│ │ ├─Column charts
│ │ ├─Line charts
│ │ ├─Pie charts
│ │ ├─Combination charts
│ │ ├─Scatter plots
│ │ ├─Funnel charts
│ │ ├─Radar charts
│ │ ├─Pictorial charts
│ │ ├─Maps
│ │ ├─Gauges
│ │ ├─Relationship charts
│ │ ├─Chart backgrounds
│ │ ├─Dynamic chart refresh
│ │ ├─Chart data dictionary
│ ├─Parameters
│ │ ├─Parameter configuration
│ │ ├─Parameter management
│ ├─Import/Export
│ │ ├─Import Excel
│ │ ├─Export Excel, PDF, Word
│ ├─Print Settings
│ │ ├─Print area settings
│ │ ├─Printer settings
│ │ ├─Preview
│ │ ├─Print page number settings
├─Large Screen Designer
│ ├─System Functions
│ │ ├─Static and dynamic data source settings
│ │ ├─Basic functions
│ │ └─Supports drag-and-drop design
│ │ └─Supports add, delete, modify, query large screens
│ │ └─Supports copying large screen data and styles
│ │ └─Supports large screen preview and sharing
│ │ └─Supports automatic data saving and manual data recovery
│ │ └─Supports setting large screen passwords
│ │ └─Supports deleting, grouping, moving up/down, bring to front/back for component layers
│ │ ├─Background Settings
│ │ └─Large screen width and height settings
│ │ └─Large screen description settings
│ │ └─Background color and background image settings
│ │ └─Cover image settings
│ │ └─Zoom ratio settings
│ │ └─Environment address settings
│ │ └─Watermark settings
│ │ ├─Map Settings
│ │ └─Add maps
│ │ └─Map data isolation
│ ├─Charts
│ │ ├─Column charts
│ │ ├─Line charts
│ │ ├─Combination charts
│ │ ├─Pie charts
│ │ ├─Pictorial charts
│ │ ├─Radar charts
│ │ ├─Scatter plots
│ │ ├─Funnel charts
│ │ ├─Text boxes
│ │ ├─Marquee
│ │ ├─Hyperlinks
│ │ ├─Real-time clock
│ │ ├─Maps
│ │ ├─National logistics map
│ │ ├─Geographic coordinate map
│ │ ├─City delivery map
│ │ ├─Images
│ │ ├─Image frames
│ │ ├─Carousel
│ │ ├─Slider components
│ │ ├─iframe
│ │ ├─video
│ │ ├─Flip counter
│ │ ├─Ring charts
│ │ ├─Progress bars
│ │ ├─Gauges
│ │ ├─Word cloud
│ │ ├─Tables
│ │ ├─Tabs
│ │ ├─Universal components
└─Other Modules
└─More features in development...
```
Dashboard Function List
-----------------------------------
```
├─Dashboard Designer
│ ├─Basic Functions
│ │ └─Supports drag-and-drop design
│ │ └─Supports add, delete, modify, query dashboards
│ │ └─Supports copying dashboard data and styles
│ │ └─Supports dashboard preview and sharing
│ │ └─Supports setting dashboard protection code
│ │ └─Supports setting dashboard PC mode or mobile mode
│ │ └─Supports adding, deleting, moving dashboard controls
│ ├─Data Sources
│ │ └─Supports multiple data sources such as Oracle, MySQL, SQLServer, PostgreSQL and other mainstream databases
│ │ └─Supports intelligent SQL writing pages, allowing you to see table lists and field lists under data sources
│ │ └─Supports parameters
│ ├─Data Sets
│ │ └─SQL
│ │ └─API
│ │ └─JSON
│ │ └─WebSocket
│ │ └─Static data sets
│ ├─Data
│ │ └─Set data count
│ │ └─Data filtering
│ │ └─Data auto-refresh
│ ├─Charts
│ │ └─Column charts
│ │ └─Pie charts
│ │ └─Nightingale rose charts
│ │ └─Line charts
│ │ └─Ring charts
│ │ └─Area charts
│ │ └─Progress charts
│ │ └─Pictorial charts
│ │ └─Gauges
│ │ └─Scatter plots
│ │ └─Funnel charts
│ │ └─Radar charts
│ ├─Common
│ │ └─Query conditions
│ │ └─Carousel
│ │ └─Iframe
│ │ └─Calendar
│ │ └─Images
│ │ └─Text
│ │ └─Numbers
│ │ └─Buttons
│ │ └─Current time
│ │ └─Rich text
│ ├─Layout
│ │ └─Tabs
│ │ └─Grid
│ ├─Data
│ │ └─Data tables
│ │ └─Data lists
│ │ └─Universal components
│ ├─Maps
│ │ └─Scatter maps
│ │ └─Flight line maps
│ │ └─Column maps
│ │ └─Timeline flight line maps
│ │ └─Column ranking maps
│ │ └─Heat maps
│ │ └─Regional maps
│ ├─Homepage
│ │ └─Quick navigation
│ │ └─Statistics cards
│ │ └─Project lists
│ │ └─Simple cards
│ │ └─To-do items
│ │ └─Latest activities
│ ├─Personality
│ │ └─Bull market surge
│ │ └─Five elements cycle
│ │ └─Gantt charts
│ ├─Style Configuration
│ │ └─Basic configuration
│ │ └─Title settings
│ │ └─Subtitle settings
│ │ └─X-axis settings
│ │ └─Y-axis settings
│ │ └─Tooltip settings
│ │ └─Coordinate axis margins
│ │ └─Legend settings
│ │ └─Custom color schemes
│ │ └─Card settings
│ │ └─Custom properties
│ │ └─Numerical settings
│ ├─Interaction Settings
│ │ └─Linkage configuration
│ │ └─Query configuration
│ │ └─Jump configuration
│ │ └─Drill-down configuration
│ │ └─Custom JS
└─ Export
└─Images
└─PDF
└─Excel
```
## Donation
If you think it's not bad, please buy the author a cup of coffee ☺