<!DOCTYPE HTML>
<html>
	<head>
		<title>Hr Data Analysis</title>
		<meta charset="utf-8" />
		<meta name="viewport" content="width=device-width, initial-scale=1, user-scalable=no" />
		<link rel="stylesheet" href="assets/css/main.css" />
		<noscript><link rel="stylesheet" href="assets/css/noscript.css" /></noscript>
	</head>
	<body class="is-preload">

		<!-- Header -->
<section id="header">
	<div class="inner">
		<h1>
			<strong>HR Data Analysis<br></strong>
			<br/>
			
		</h1>
		<p style="text-align: center;">
			In this project, we have conducted an in-depth analysis of the HR_data CSV file to extract valuable information and gain insights into the data. By visualizing the data, we aim to uncover patterns and trends that can help organizations make informed HR decisions.
			<br><br>
			<strong>Key Features of the Project:</strong>
			<br>
			<ul>
				Thorough analysis of HR_data CSV file.<br>
				Answering important questions to extract valuable insights.<br>
				Visualizing the data to uncover patterns and trends.<br>
				Providing meaningful interpretations and recommendations based on the analysis.<br>
			</ul>
			<br>
			<strong>Why HR Data Analysis is Important:</strong>
			<br>
			HR data analysis plays a vital role in understanding an organization's workforce, identifying areas for improvement, and making data-driven decisions. By analyzing HR data, we can gain insights into employee performance, retention, recruitment effectiveness, training needs, and more. This information helps organizations optimize their HR strategies, enhance employee satisfaction, and drive overall business success.
			<br><br>
			<strong>Get Ready to Explore HR Data:</strong>
			<br>
			Are you ready to dive into the world of HR data analysis? Join us on this exciting journey as we unravel the hidden stories behind the numbers. Gain valuable insights and discover opportunities to optimize your HR practices.
			<br><br>
			<strong>Start Exploring:</strong>
			<br>
			Begin your exploration of the HR data analysis project by delving into the interactive visualizations, informative reports, and thought-provoking findings. Discover how HR data analysis can revolutionize your organization's approach to human resources.
			<br><br>
			<strong>Analysis Questions:</strong>
			<br>
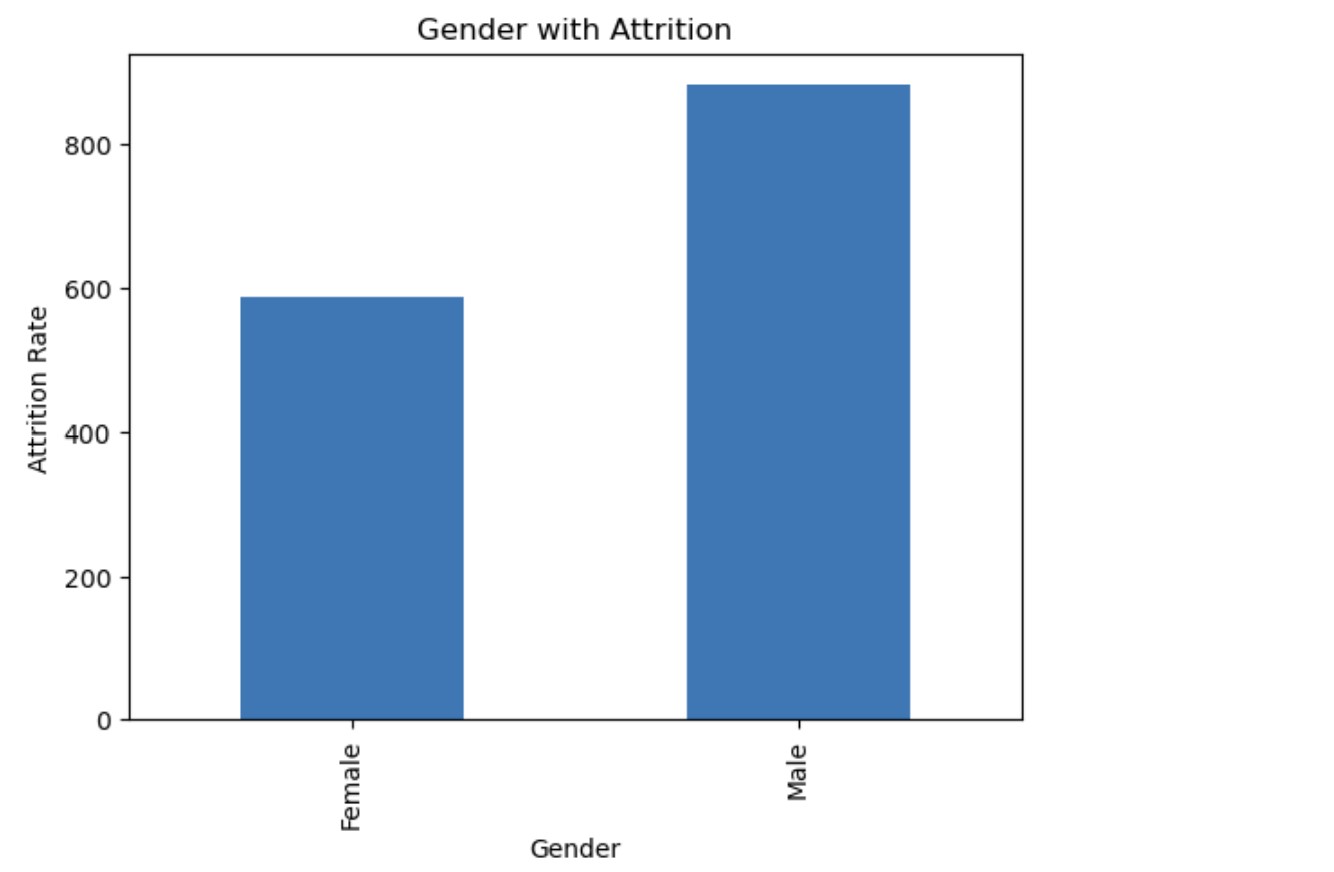
			1. What is the Attrition based on Gender?
			<br>
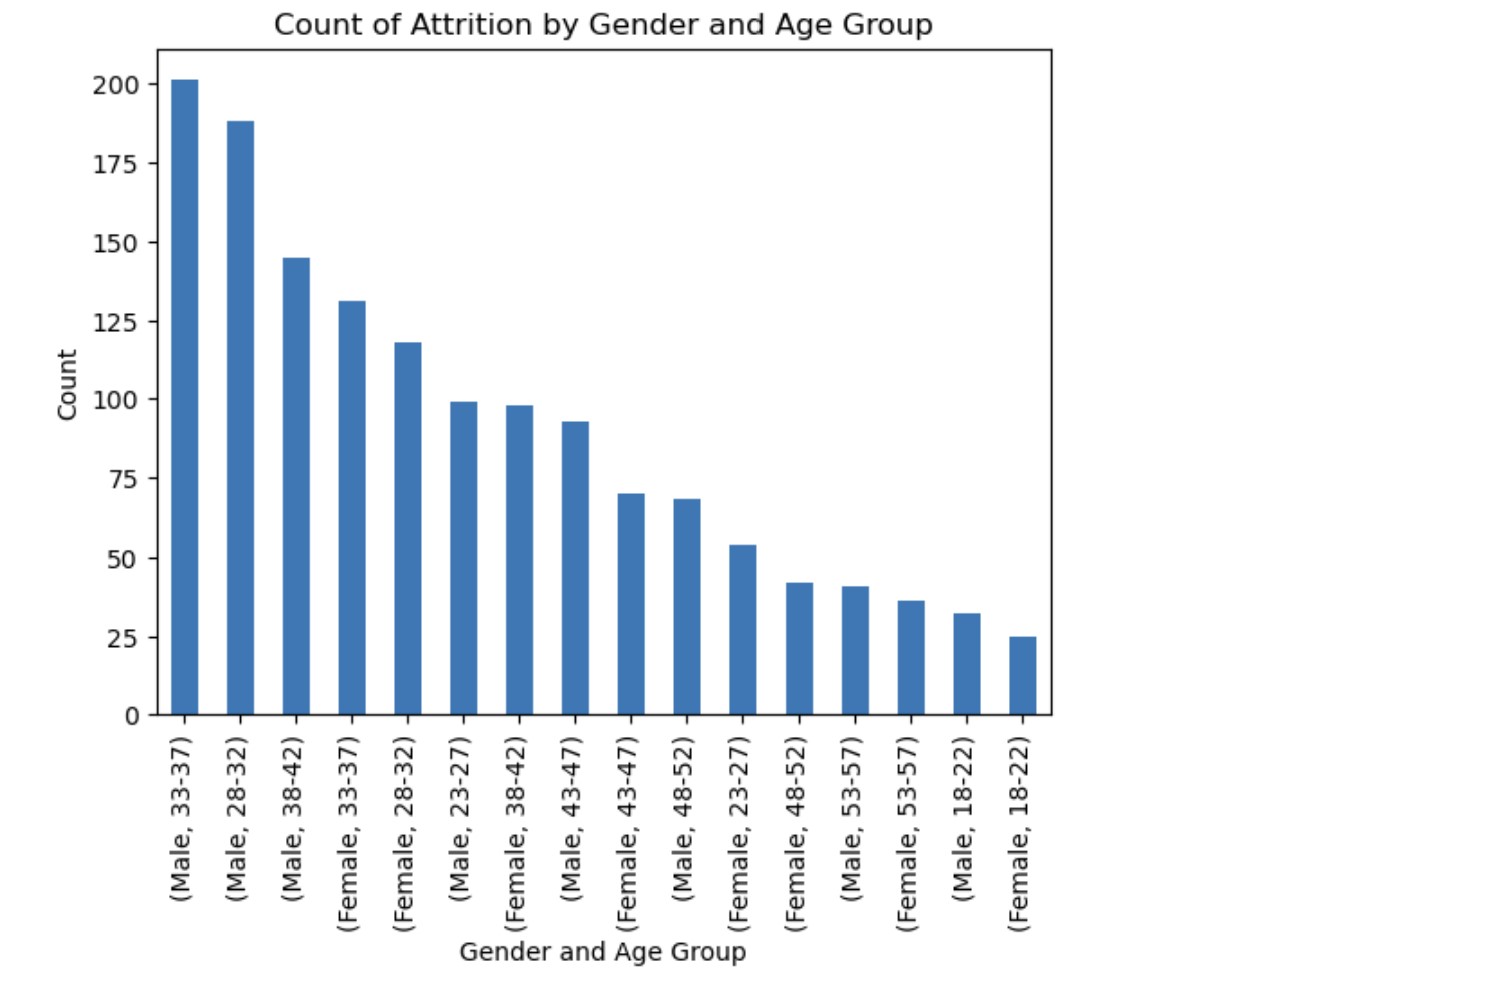
			2. What is the Attrition based on Age Group?
			<br>
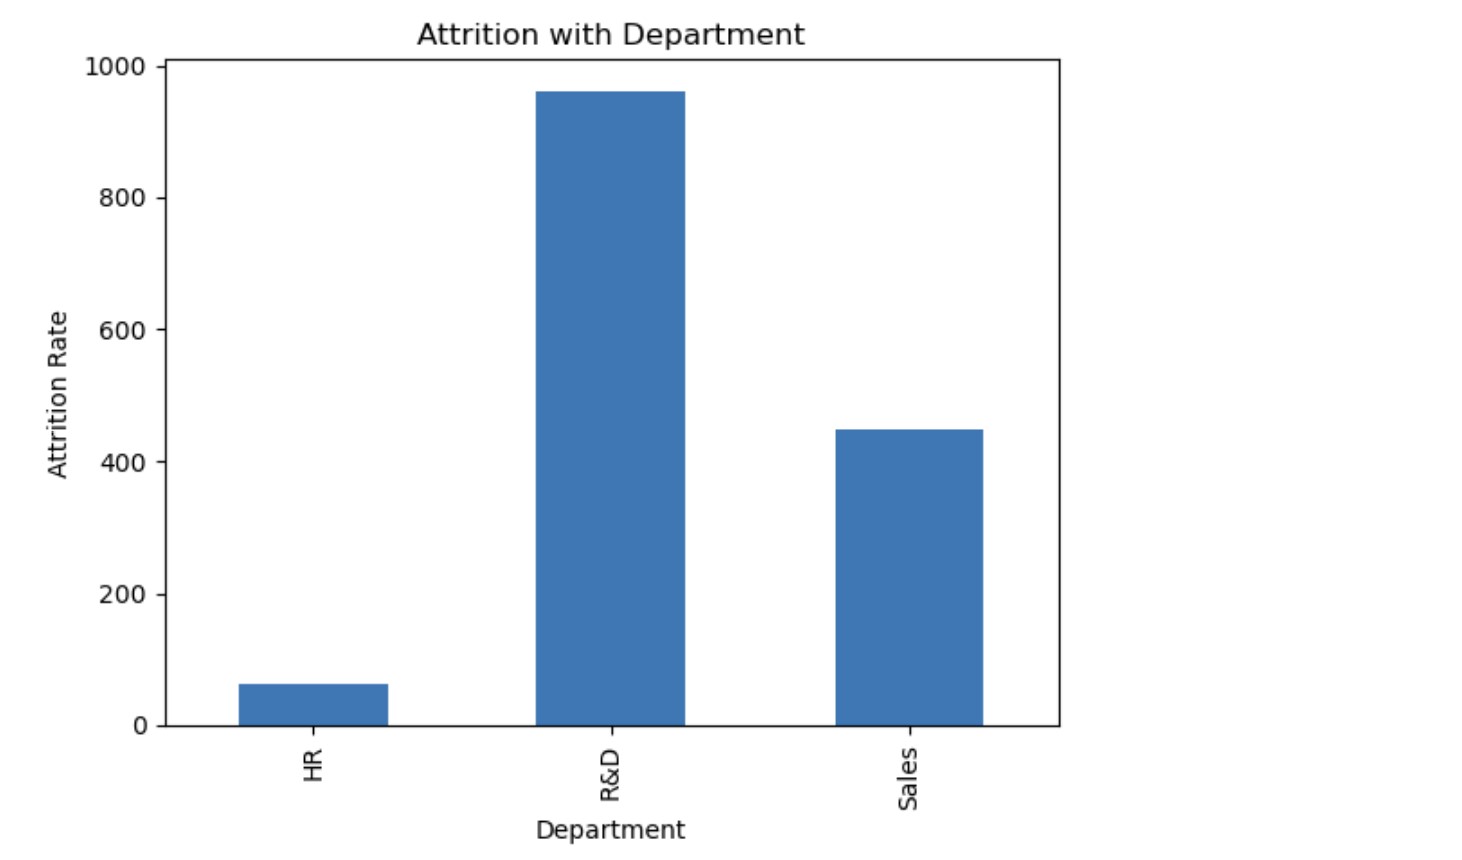
			3. What is the Attrition based on Deartment?
			<br>
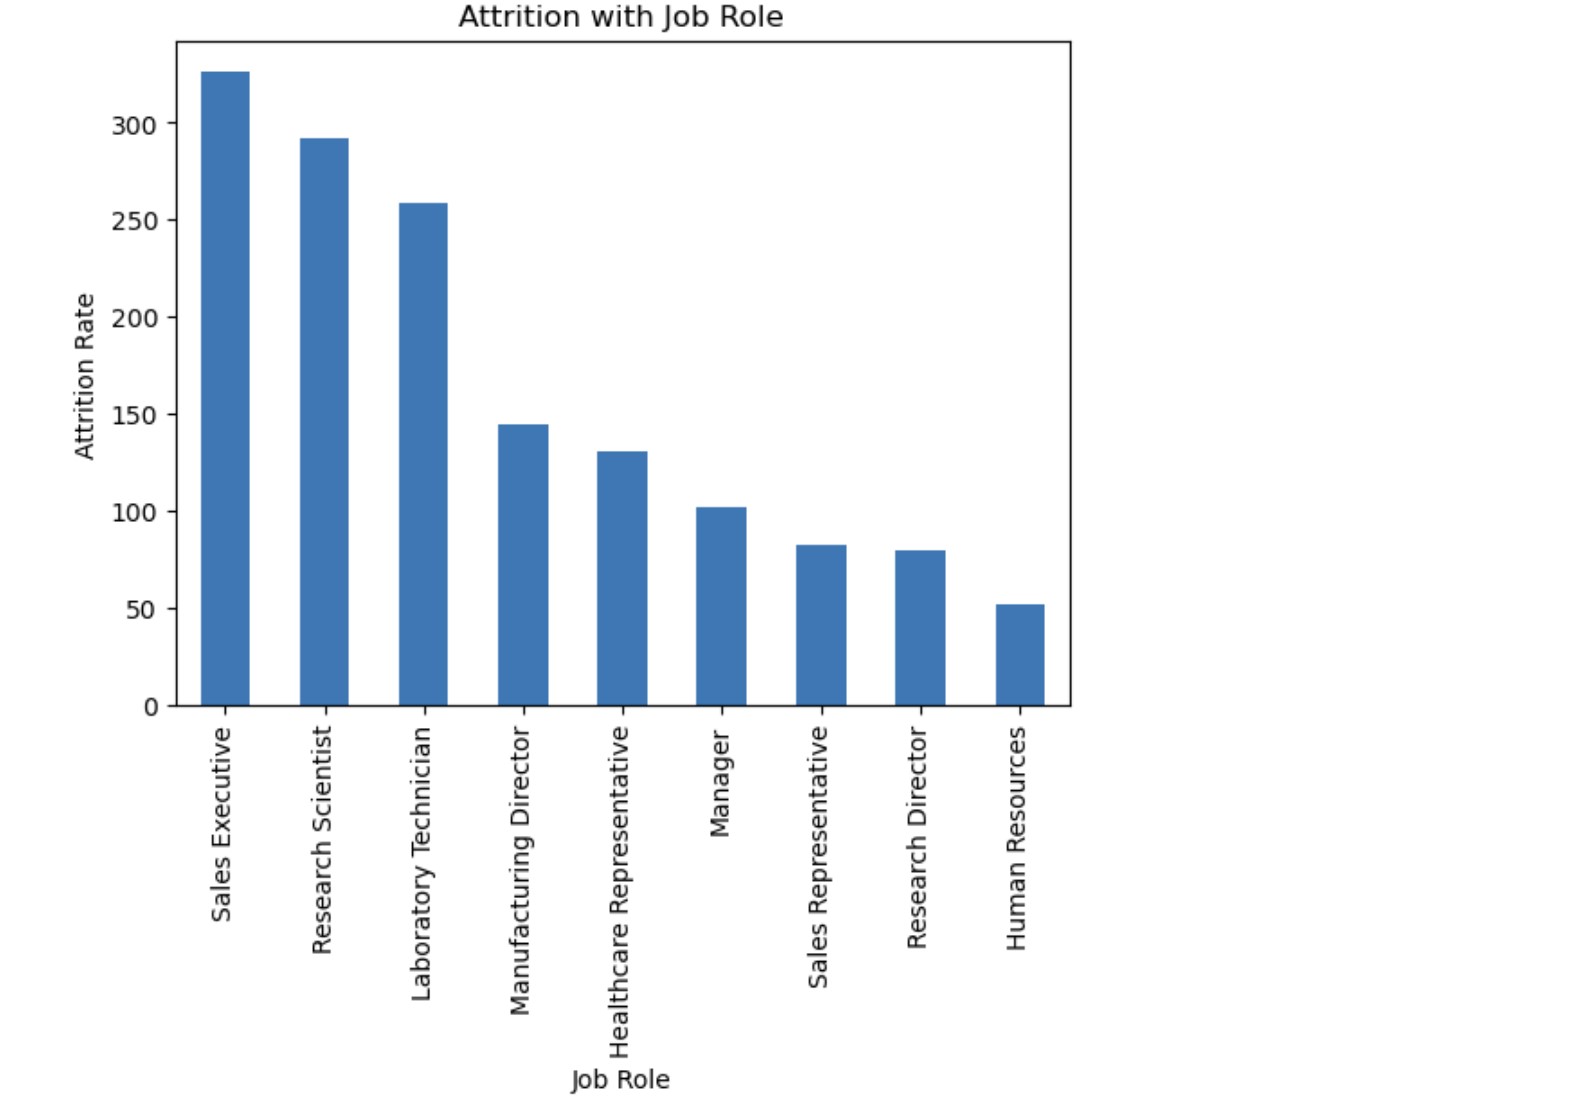
			4. What is the Attrition based on Job Role?
			<br>
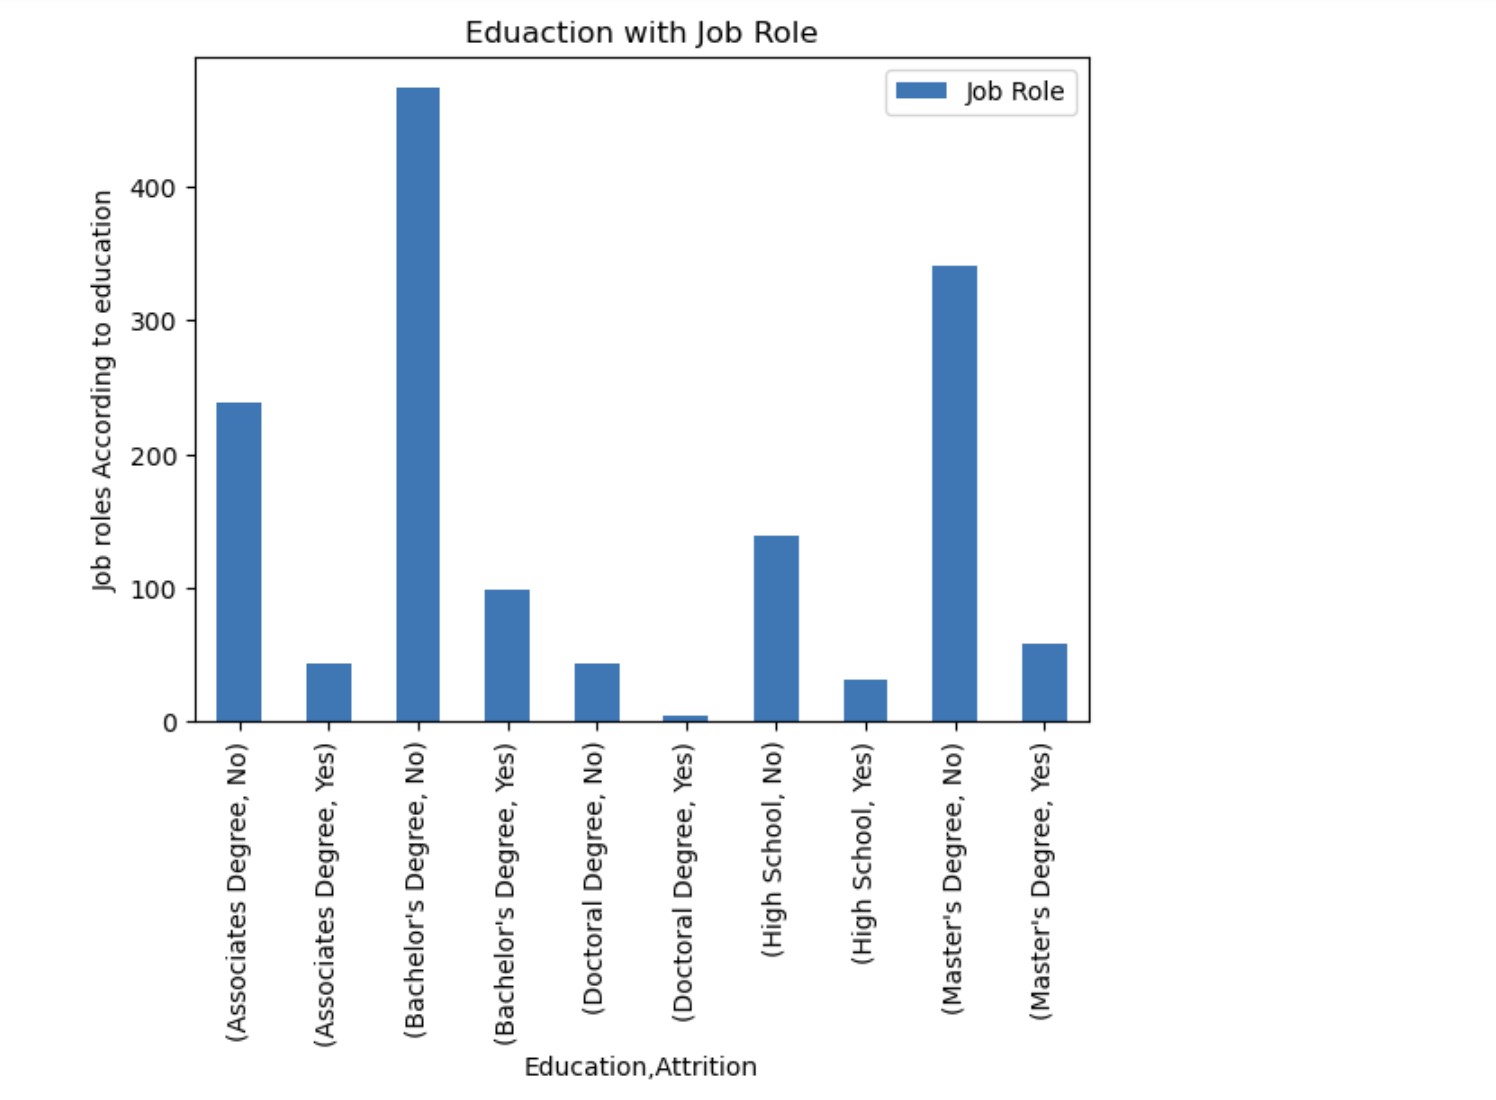
			5. What is the Attrition base on Education and Job role?
			<br><br>
			<strong>By answering these questions, the project aims to provide insights into the sales performance of the company and identify potential strategies for improving sales effectiveness.</strong>
		</p>
	</div>
</section>

<!-- Information-->
<section id="two" class="main style2">
	<div class="container">

		<div class="container">
			<header class="major">
				<h2>Analysis by answering few questions.</h2>
			</header>
		<p><strong>1. What is the Attrition based on Gender?</p></strong>
		<img src="images/Hr_1.jpg" alt="" width="500px" height="auto">
		<br>

		<p><strong>2. What is the Attrition based on Age Group?</p></strong>
		<img src="images/Hr_2.jpg" alt="" width="500px" height="auto">
		<br>
		 
		<p><strong>3. What is the Attrition based on Deartment?</p></strong> 
		<img src="images/Hr_3.jpg" alt="" width="500px" height="auto">
		<br>

		<p><strong>4. What is the Attrition based on Job Role?</p></strong>
		<img src="images/Hr_4.jpg" alt="" width="500px" height="auto">
		<br>

		<p><strong>5. What is the Attrition base on Education and Job role?</p></strong>
		<img src="images/Hr_5.jpg" alt="" width="500px" height="auto"> 
		<br>


	</div>
</section>

<!-- ************************** -->

<!-- Tableau Workbook -->
<section id="tableau-section" class="main style2 special">
    <div class="inner">
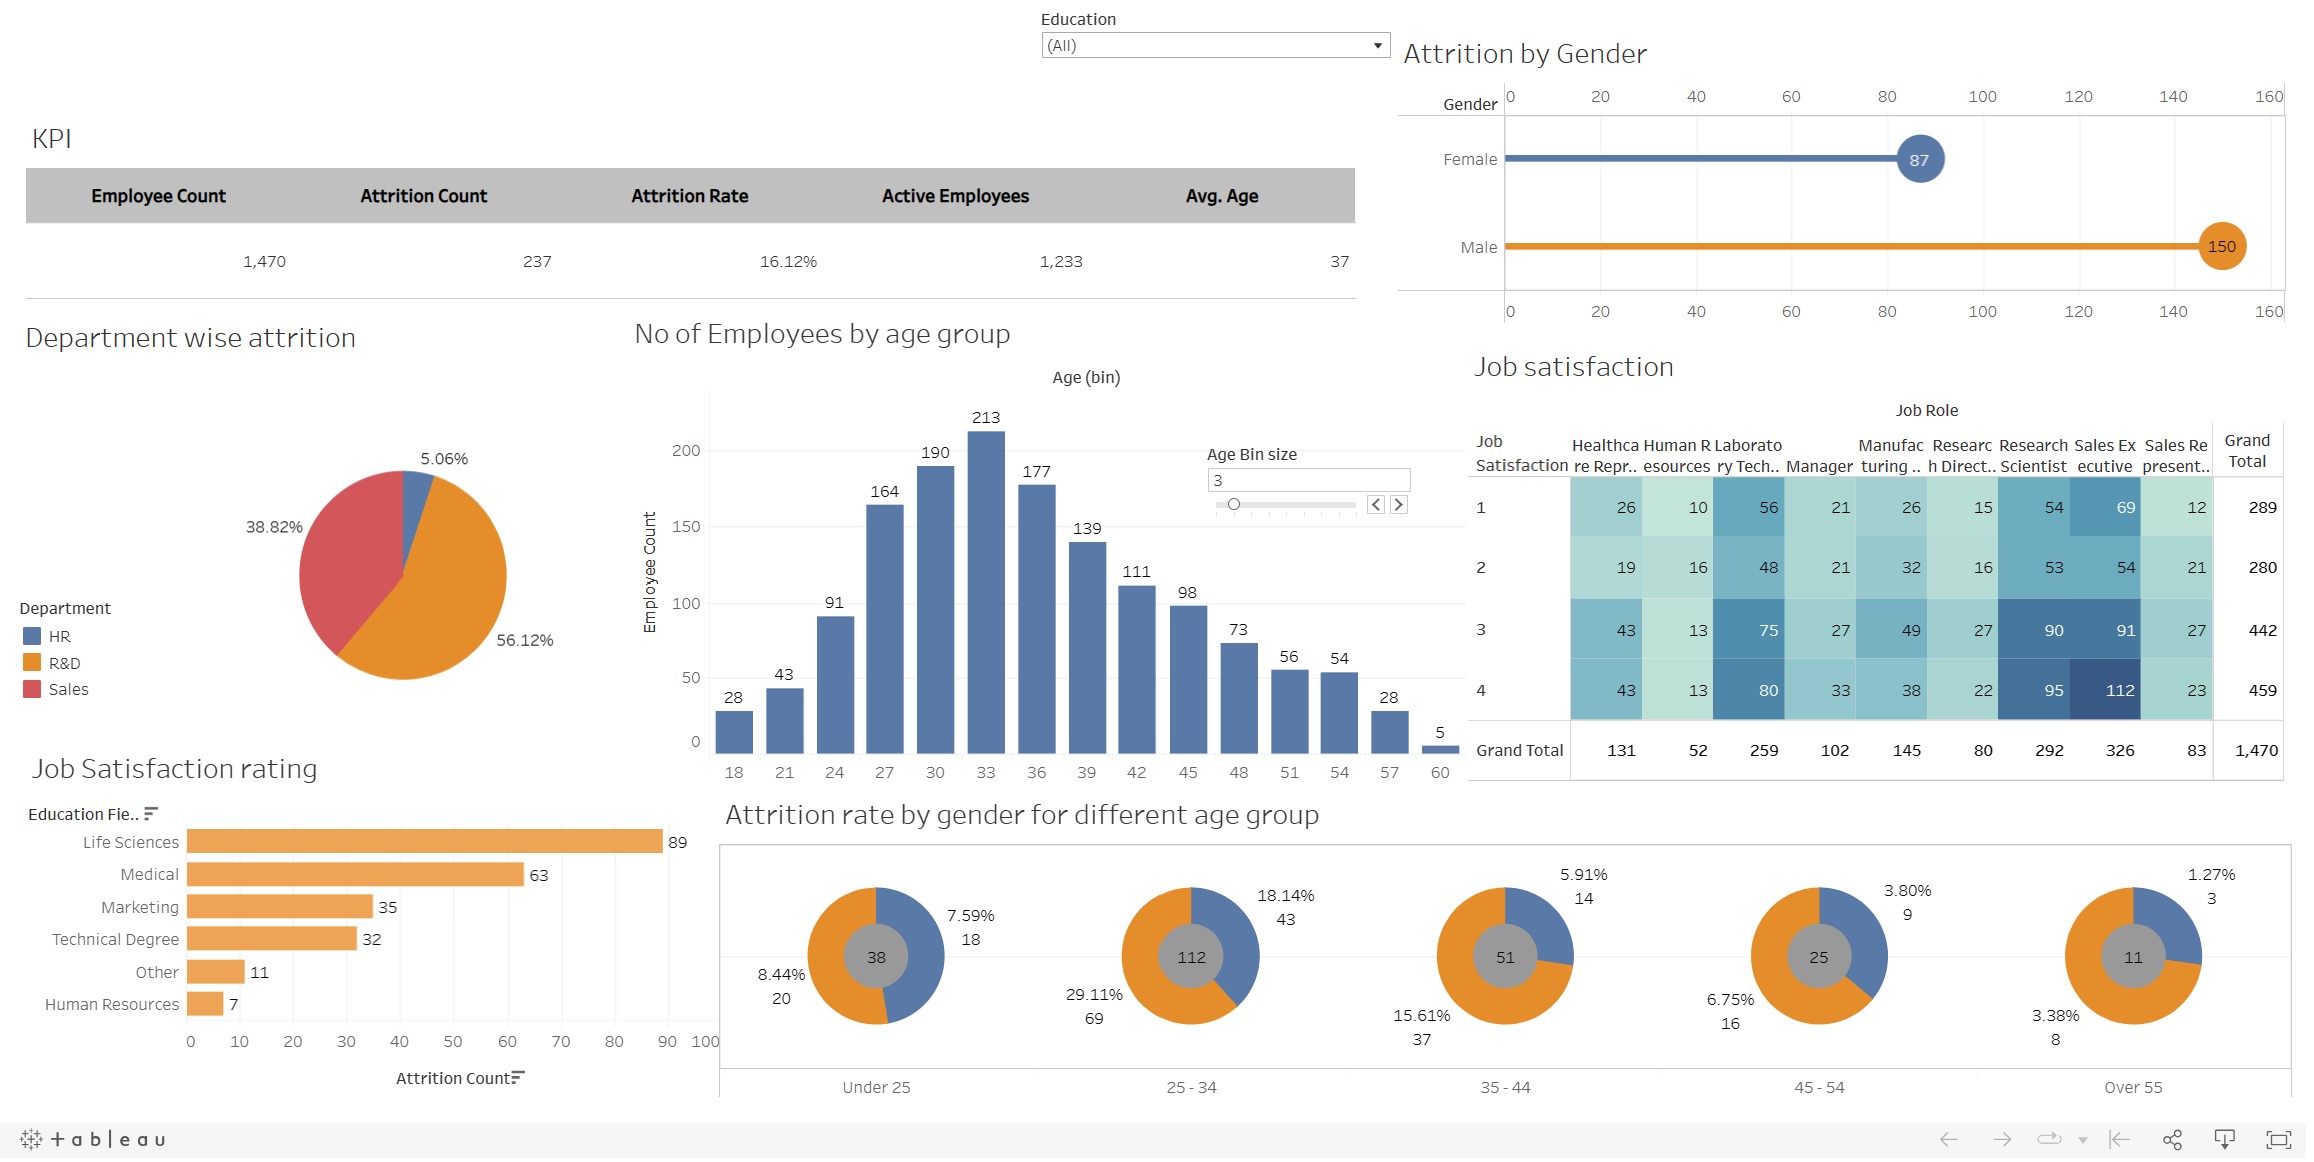
        <p><strong>The Tableau Workbook of the HR Data Analysis.</strong></p>
        <img src="images/Hr_tableau.jpg" alt="" style="max-width: 90%; max-height: 45vw;">
        <br>
        <button onclick="openTableauLink()">View Tableau Workbook</button>
        <script>
            function openTableauLink() {
                window.open('https://public.tableau.com/app/profile/jeffrey.joy5697/viz/HRDataAnalytics_16859600867420/HRAnalyticsDashboard', '_blank');
            }
        </script>
    </div>
</section>

<!-- Viewing the Project -->
<section id="project-section" class="main style2 special">
    <div class="inner">
        <div class="container">
            <header class="major">
                <h2>To know more about the Project</h2>
            </header>
            <button onclick="openProjectLink()">View Project</button>
            <script>
                function openProjectLink() {
                    window.open('https://github.com/jeffreyjoy271114/HR-Data-Analysis/blob/main/HR%20Data%20Analysis%20EDA.ipynb', '_blank');
                }
            </script>
        </div>
    </div>
</section>

<!-- Home Button -->
<section id = "header" class = 'main style2 special'>
	<div class="inner">
        <div class="container">
			<ul class="actions special">
				<li><a href="index.html" class="button scrolly">Home</a></li>
			</ul>
		</div>
	</div>
</section>


		<!-- Scripts -->
			<script src="assets/js/jquery.min.js"></script>
			<script src="assets/js/jquery.scrolly.min.js"></script>
			<script src="assets/js/browser.min.js"></script>
			<script src="assets/js/breakpoints.min.js"></script>
			<script src="assets/js/util.js"></script>
			<script src="assets/js/main.js"></script>

	</body>
</html>