# svelte-pivottable
`svelte-pivottable` is a Svelte 5 pivot table library with drag-and-drop data exploration, grouping, and subtotals — similar to the pivot table experience in older versions of Microsoft Excel.
It is a Svelte port of [react-pivottable-grouping](https://github.com/jjagielka/react-pivottable-grouping), itself a fork of [react-pivottable](https://react-pivottable.js.org/) by [Nicolas Kruchten](https://github.com/nicolaskruchten), which is a React port of his jQuery-based [PivotTable.js](https://pivottable.js.org/).
## What does it do?
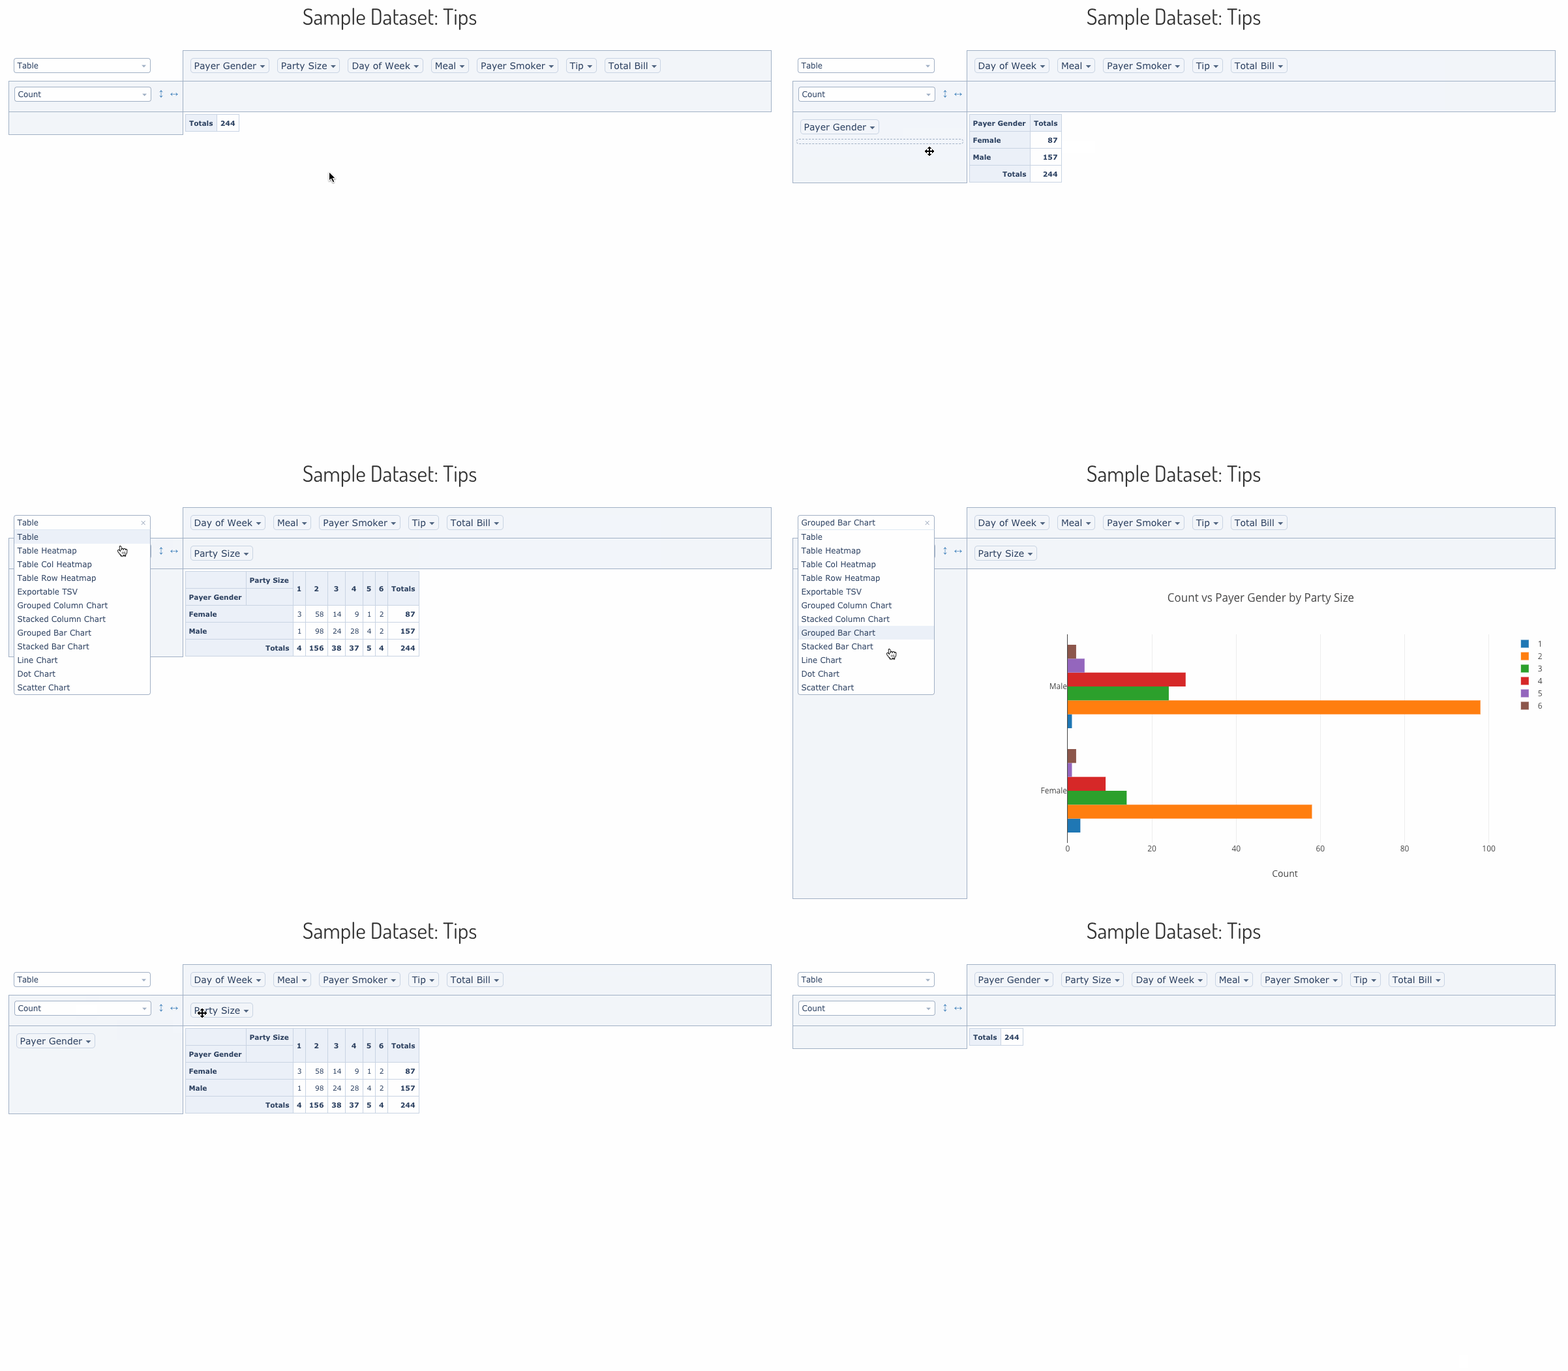
`svelte-pivottable` lets you summarize a dataset into a cross-tabulated table or a [Plotly.js](https://plot.ly/javascript/) chart using a drag-and-drop interface. You can move attributes between rows, columns, filters, and aggregation slots interactively.
A [live demo is available here](https://jjagielka.github.io/svelte-pivottable-demo/).
## Installation
```
npm install svelte-pivottable
```
## Basic usage
### Interactive UI with table output
`PivotTableUI` is the full drag-and-drop component. It manages its own UI state but delegates data rendering to `PivotTable`.
```svelte
```
Data can also be provided as an array of arrays (first row is headers):
```svelte
```
### Non-interactive snapshot rendering
`PivotTable` renders a saved configuration without any drag-and-drop UI. Use it for embedding fixed pivot views in dashboards.
```svelte
```
## Renderers
### Table renderers
`TableRenderers` is the default renderer set. Import it from `svelte-pivottable` or the `svelte-pivottable/TableRenderers` subpath.
| Key | Description |
|-----|-------------|
| `Table` | Plain cross-tabulation table |
| `Table Heatmap` | Table with full color scale across all cells |
| `Table Col Heatmap` | Heatmap scaled per column |
| `Table Row Heatmap` | Heatmap scaled per row |
| `TsvExport` | Tab-separated values export view |
```svelte
```
### Plotly renderers
Plotly.js is injected as a dependency to avoid mandatory bundling. Pass the Plotly object to `PlotlyRenderers()` to get the renderer map.
```svelte
```
If you load Plotly via a `
```
## Aggregators
### Built-in aggregators
The `aggregators` export is a ready-to-use map of aggregation functions. Pass it (or a subset) to `PivotTableUI` via the `aggregators` prop, or use individual entries as the `aggregator` prop on `PivotTable`.
```svelte
```
Available built-in aggregators:
| Key | Description |
|-----|-------------|
| `Count` | Number of records |
| `Count Unique Values` | Number of distinct values |
| `List Unique Values` | Comma-separated distinct values |
| `Sum` | Sum of a numeric field |
| `Integer Sum` | Sum formatted as integer |
| `Average` | Mean |
| `Median` | Median |
| `Sample Variance` | Sample variance |
| `Sample Standard Deviation` | Sample standard deviation |
| `Minimum` | Minimum value |
| `Maximum` | Maximum value |
| `First` | First value seen |
| `Last` | Last value seen |
| `Sum over Sum` | Ratio of two sums |
| `Sum as Fraction of Total` | Each cell as % of grand total |
| `Sum as Fraction of Rows` | Each cell as % of its row total |
| `Sum as Fraction of Columns` | Each cell as % of its column total |
| `Count as Fraction of Total` | Count as % of grand total |
| `Count as Fraction of Rows` | Count as % of row total |
| `Count as Fraction of Columns` | Count as % of column total |
### Limiting the aggregator dropdown
Pass a subset of `aggregators` to restrict what appears in the UI:
```svelte
```
### Custom aggregators with `aggregatorTemplates`
Use `aggregatorTemplates` as building blocks for your own aggregation logic:
```svelte
```
## Derived attributes
Use `derivedAttributes` to compute new fields on the fly without modifying the source data. The built-in `derivers` helper provides common patterns:
```svelte
```
## Sorting
### Custom sort order with `sortAs`
Use `sortAs` to enforce a fixed value ordering (e.g. month names, priority levels):
```svelte
```
## Grouping and subtotals
Set `grouping={true}` to display hierarchical row and column groups with subtotals at each level. This is the main feature added over the original `react-pivottable`.
```svelte
```
| Prop | Type | Default | Description |
|------|------|---------|-------------|
| `grouping` | `boolean` | `false` | Enable hierarchical grouping with subtotals |
| `compactRows` | `boolean` | `true` | Render row group headers inline rather than as separate rows |
| `rowGroupBefore` | `boolean` | `true` | Show row subtotals above their children |
| `colGroupBefore` | `boolean` | `false` | Show column subtotals to the left of their children |
## All properties
The component stack passes props downward: `PivotTableUI → PivotTable → Renderer → PivotData`.
| Layer | Prop | Type | Default | Description |
|-------|------|------|---------|-------------|
| `PivotData` | `data` | array or function | *(required)* | Dataset to summarize — see [accepted formats](#accepted-formats-for-data) |
| `PivotData` | `rows` | `string[]` | `[]` | Attribute names to pre-populate in the row area |
| `PivotData` | `cols` | `string[]` | `[]` | Attribute names to pre-populate in the column area |
| `PivotData` | `vals` | `string[]` | `[]` | Attribute names passed to the aggregator function |
| `PivotData` | `aggregator` | function | `aggregators['Count']` | Aggregation function (see `aggregators`) |
| `PivotData` | `valueFilter` | `Record>` | `{}` | Values to exclude per attribute; populates the filter menus |
| `PivotData` | `sorters` | object or function | `{}` | Per-attribute sort functions; defaults to natural sort |
| `PivotData` | `rowOrder` | `string` | `"key_a_to_z"` | Row sort order: `key_a_to_z`, `value_a_to_z`, or `value_z_to_a` |
| `PivotData` | `colOrder` | `string` | `"key_a_to_z"` | Column sort order: `key_a_to_z`, `value_a_to_z`, or `value_z_to_a` |
| `PivotData` | `derivedAttributes` | object of functions | `{}` | Functions that add computed fields to each record |
| `PivotData` | `grouping` | `boolean` | `false` | Enable subtotal rows and columns |
| `PivotData` | `rowGroupBefore` | `boolean` | `true` | Place row subtotals above their group |
| `PivotData` | `colGroupBefore` | `boolean` | `false` | Place column subtotals to the left of their group |
| `PivotTable` | `renderers` | object | `TableRenderers` | Map of renderer name → Svelte component |
| `PivotTable` | `rendererName` | `string` | first key in `renderers` | Which renderer to use |
| `PivotTableUI` | `aggregators` | object | `aggregators` from Utilities | Map of aggregator name → function, shown in the dropdown |
| `PivotTableUI` | `aggregatorName` | `string` | first key in `aggregators` | Which aggregator to use initially |
| `PivotTableUI` | `hiddenAttributes` | `string[]` | `[]` | Attributes to hide from the entire UI |
| `PivotTableUI` | `hiddenFromAggregators` | `string[]` | `[]` | Attributes to hide from the aggregator field picker |
| `PivotTableUI` | `hiddenFromDragDrop` | `string[]` | `[]` | Attributes to hide from the drag-and-drop zone |
| `PivotTableUI` | `menuLimit` | `number` | `500` | Maximum number of values to show in a filter menu |
| `PivotTableUI` | `unusedOrientationCutoff` | `number` | `85` | Total character length of attribute names above which unused attributes are shown vertically instead of horizontally. `0` = always vertical, `Infinity` = always horizontal |
| `PivotTableUI` | `compactRows` | `boolean` | `true` | Compact rendering for grouped row headers |
## Accepted formats for `data`
### Array of objects
```js
const data = [
{ attr1: 'value1', attr2: 'value2' },
{ attr1: 'value3', attr2: 'value4' },
];
```
### Array of arrays
First row is treated as headers. Compatible with CSV parser output (e.g. PapaParse).
```js
const data = [
['attr1', 'attr2'],
['value1', 'value2'],
['value3', 'value4'],
];
```
### Callback function
The function receives a record callback and calls it once per record. Useful for streaming or lazy data sources.
```js
const data = (callback) => {
callback({ attr1: 'value1', attr2: 'value2' });
callback({ attr1: 'value3', attr2: 'value4' });
};
```
Missing attributes and `null` values are treated as the string `"null"` in all formats.
## Component architecture
```
PivotTableUI — stateful drag-and-drop UI
└─ PivotTable — stateless renderer selector
└─ Renderer — TableRenderer, PlotlyRenderer, TSVExportRenderer, etc.
└─ PivotData — aggregation, filtering, sorting, subtotal tree
```
## License
MIT