Boxplot Annotation
anno_boxplot.RdBoxplot Annotation
anno_boxplot(x, which = c("column", "row"), border = TRUE,
    gp = gpar(fill = "#CCCCCC"), ylim = NULL, extend = 0.05, outline = TRUE, box_width = 0.6,
    pch = 1, size = unit(2, "mm"), axis = TRUE, axis_param = default_axis_param(which),
    width = NULL, height = NULL, ...)
Arguments
| x | A matrix or a list. If |
|---|---|
| which | Whether it is a column annotation or a row annotation? |
| border | Wether draw borders of the annotation region? |
| gp | Graphic parameters for the boxes. The length of the graphic parameters should be one or the number of observations. |
| ylim | Data ranges. |
| extend | The extension to both side of |
| outline | Whether draw outline of boxplots? |
| box_width | Relative width of boxes. The value should be smaller than one. |
| pch | Point style. |
| size | Point size. |
| axis | Whether to add axis? |
| axis_param | parameters for controlling axis. See |
| width | Width of the annotation. The value should be an absolute unit. Width is not allowed to be set for column annotation. |
| height | Height of the annotation. The value should be an absolute unit. Height is not allowed to be set for row annotation. |
| ... | Other arguments. |
Value
An annotation function which can be used in HeatmapAnnotation.
See also
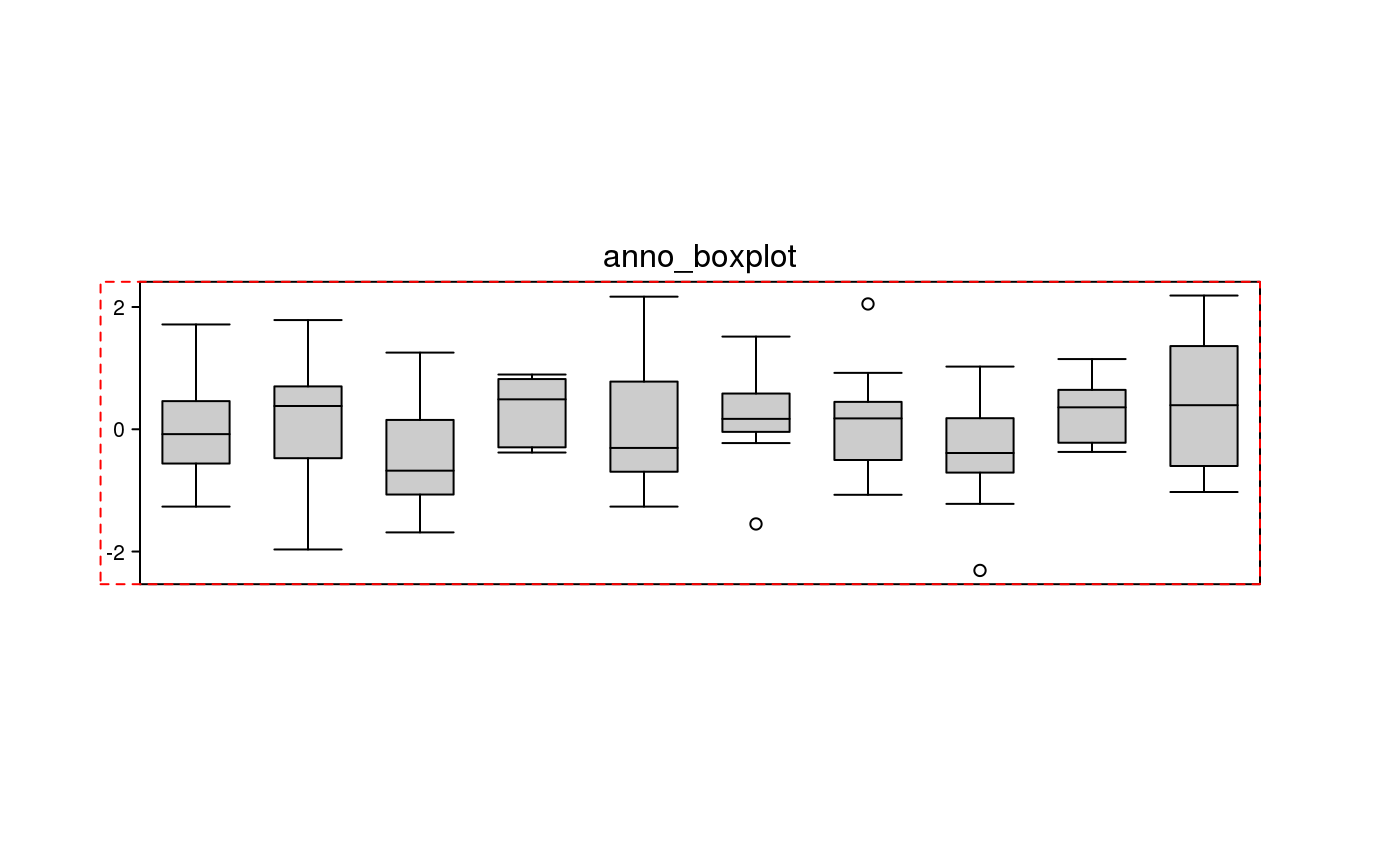
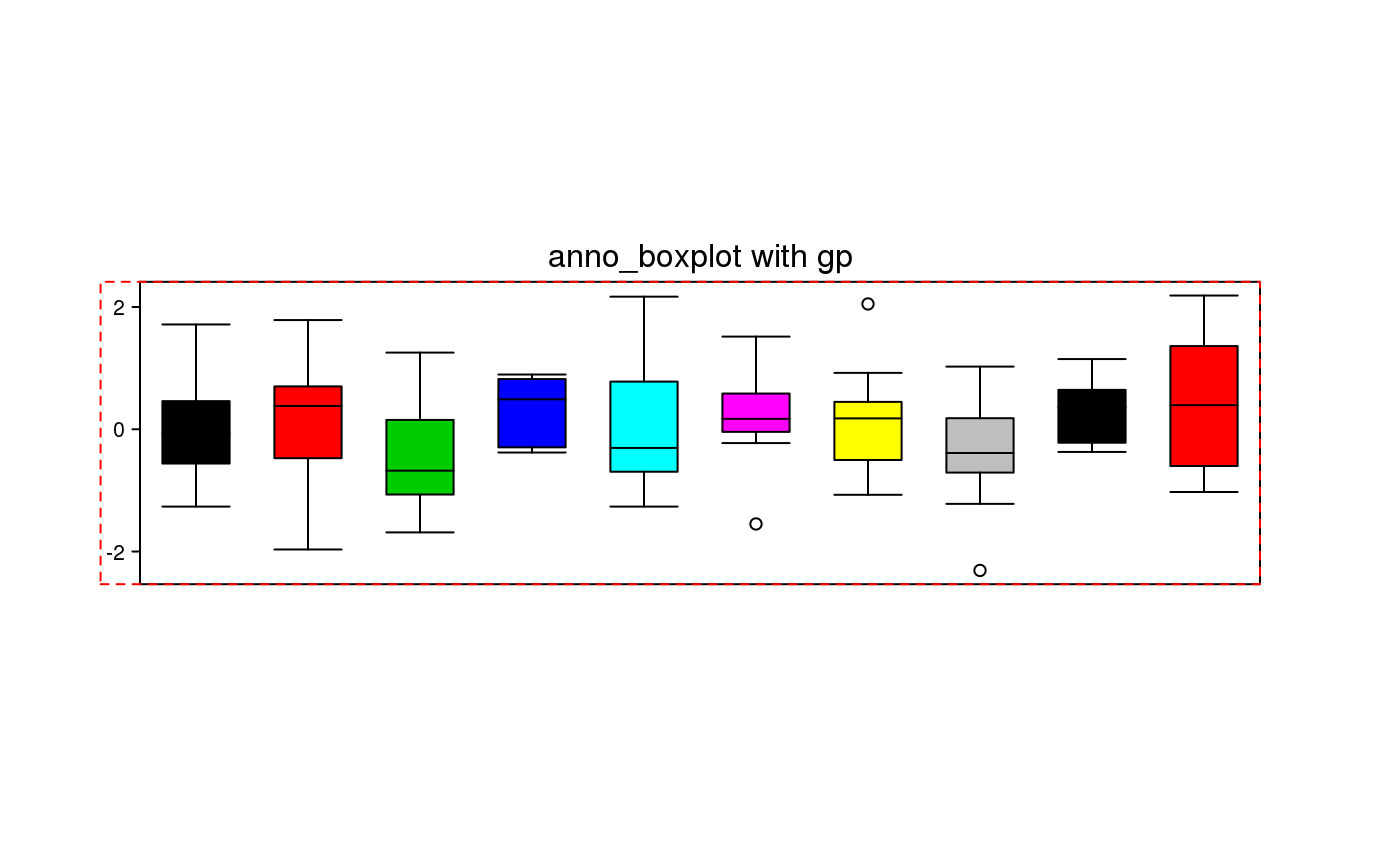
Examples
set.seed(123)
m = matrix(rnorm(100), 10)
anno = anno_boxplot(m, height = unit(4, "cm"))
draw(anno, test = "anno_boxplot")anno = anno_boxplot(m, height = unit(4, "cm"), gp = gpar(fill = 1:10))
draw(anno, test = "anno_boxplot with gp")