Density Annotation
anno_density.RdDensity Annotation
anno_density(x, which = c("column", "row"),
    type = c("lines", "violin", "heatmap"),
    heatmap_colors = rev(brewer.pal(name = "RdYlBu", n = 11)),
    joyplot_scale = 1, border = TRUE, gp = gpar(fill = "#CCCCCC"),
    axis = TRUE, axis_param = default_axis_param(which),
    width = NULL, height = NULL)
Arguments
| x | A matrix or a list. If |
|---|---|
| which | Whether it is a column annotation or a row annotation? |
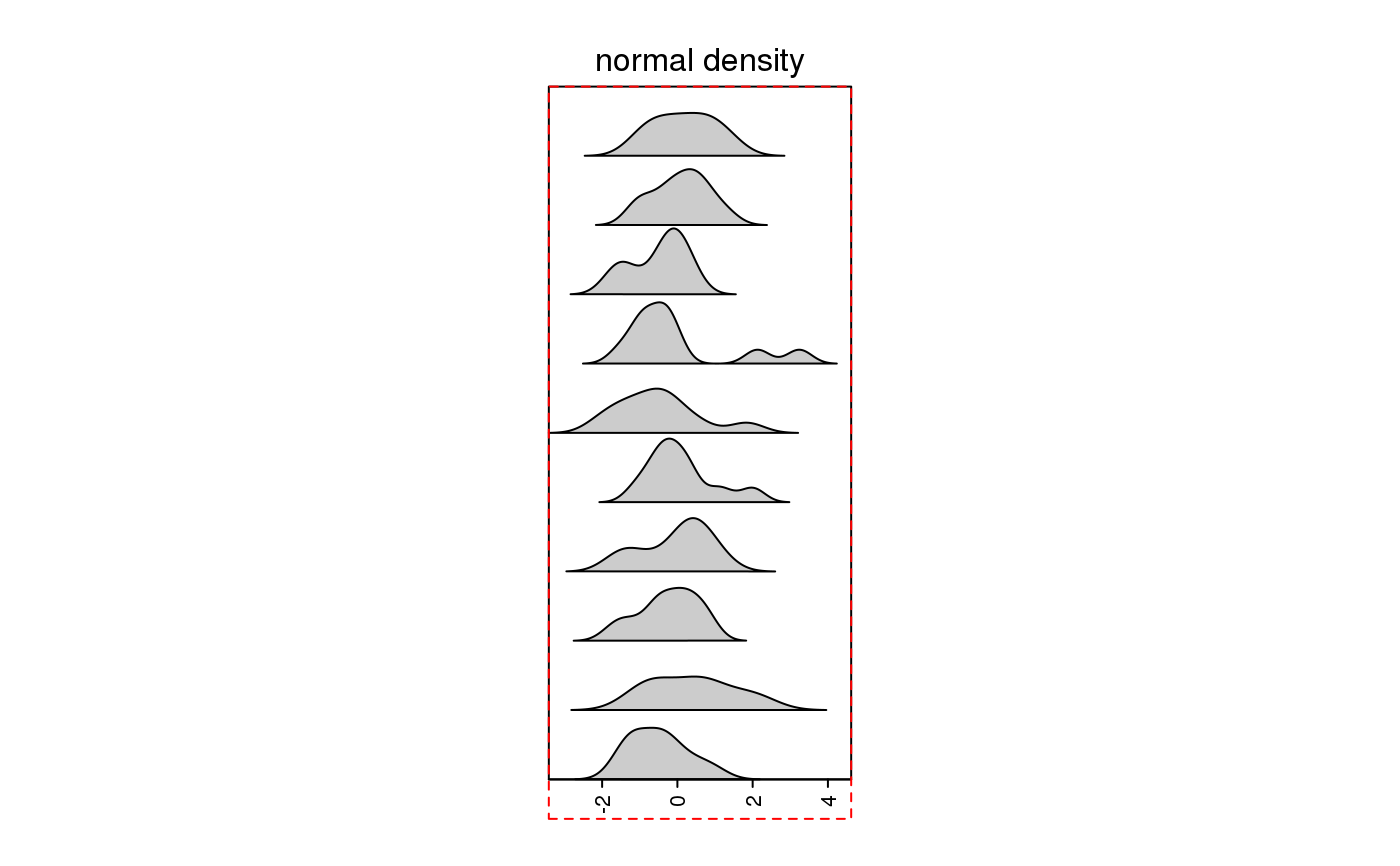
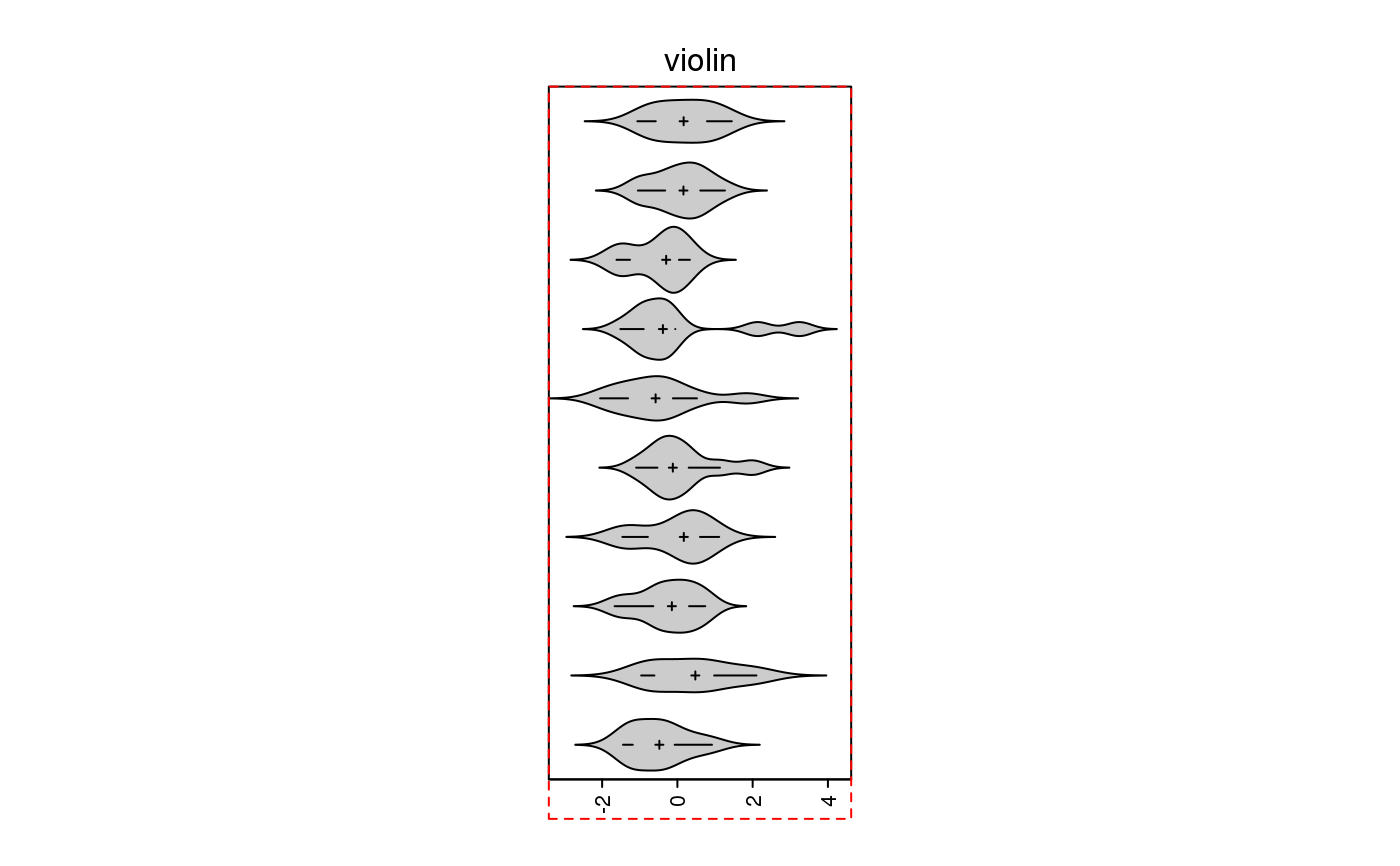
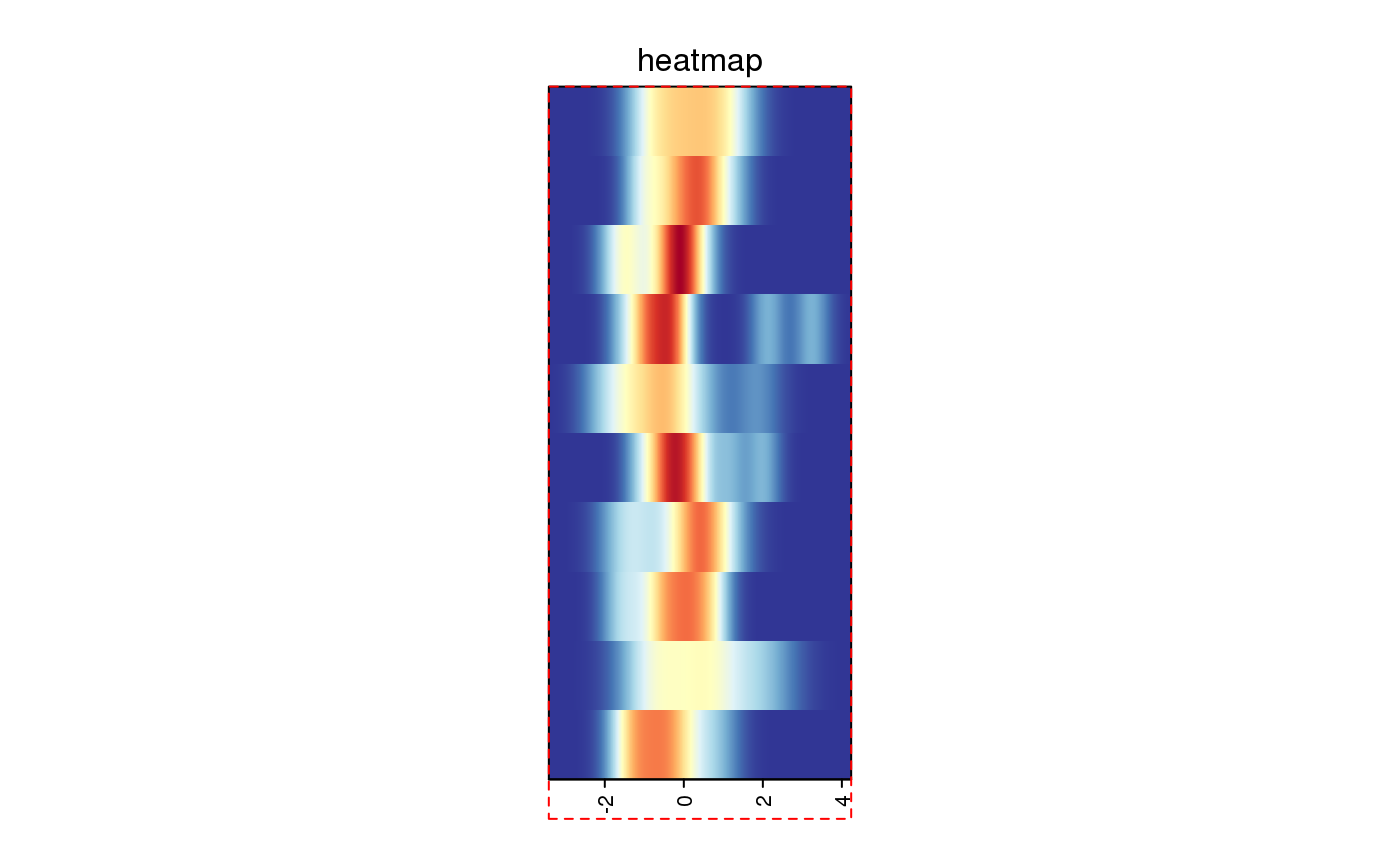
| type | Type of graphics to represent density distribution. "lines" for normal density plot; "violine" for violin plot and "heatmap" for heatmap visualization of density distribution. |
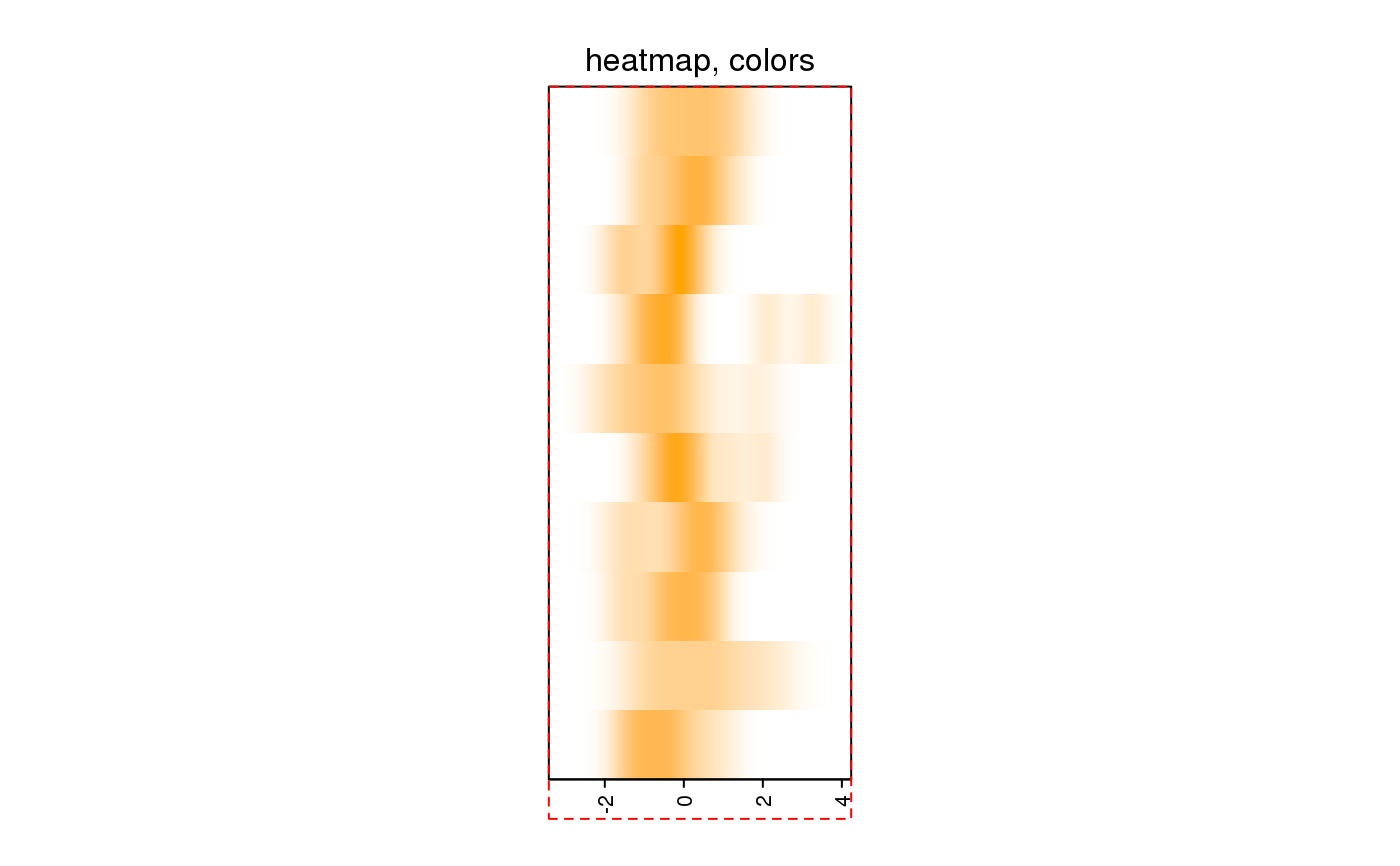
| heatmap_colors | A vector of colors for interpolating density values. |
| joyplot_scale | Relative height of density distribution. A value higher than 1 increases the height of the density distribution and the plot will represented as so-called "joyplot". |
| border | Wether draw borders of the annotation region? |
| gp | Graphic parameters for the boxes. The length of the graphic parameters should be one or the number of observations. |
| axis | Whether to add axis? |
| axis_param | parameters for controlling axis. See |
| width | Width of the annotation. The value should be an absolute unit. Width is not allowed to be set for column annotation. |
| height | Height of the annotation. The value should be an absolute unit. Height is not allowed to be set for row annotation. |
Value
An annotation function which can be used in HeatmapAnnotation.
See also
https://jokergoo.github.io/ComplexHeatmap-reference/book/heatmap-annotations.html#density-annotation
Examples
m = matrix(rnorm(100), 10) anno = anno_density(m, which = "row") draw(anno, test = "normal density")anno = anno_density(m, which = "row", type = "heatmap", heatmap_colors = c("white", "orange")) draw(anno, test = "heatmap, colors")