Histogram Annotation
anno_histogram.RdHistogram Annotation
anno_histogram(x, which = c("column", "row"), n_breaks = 11,
    border = FALSE, gp = gpar(fill = "#CCCCCC"),
    axis = TRUE, axis_param = default_axis_param(which),
    width = NULL, height = NULL)
Arguments
| x | A matrix or a list. If |
|---|---|
| which | Whether it is a column annotation or a row annotation? |
| n_breaks | Number of breaks for calculating histogram. |
| border | Wether draw borders of the annotation region? |
| gp | Graphic parameters for the boxes. The length of the graphic parameters should be one or the number of observations. |
| axis | Whether to add axis? |
| axis_param | parameters for controlling axis. See |
| width | Width of the annotation. The value should be an absolute unit. Width is not allowed to be set for column annotation. |
| height | Height of the annotation. The value should be an absolute unit. Height is not allowed to be set for row annotation. |
Value
An annotation function which can be used in HeatmapAnnotation.
See also
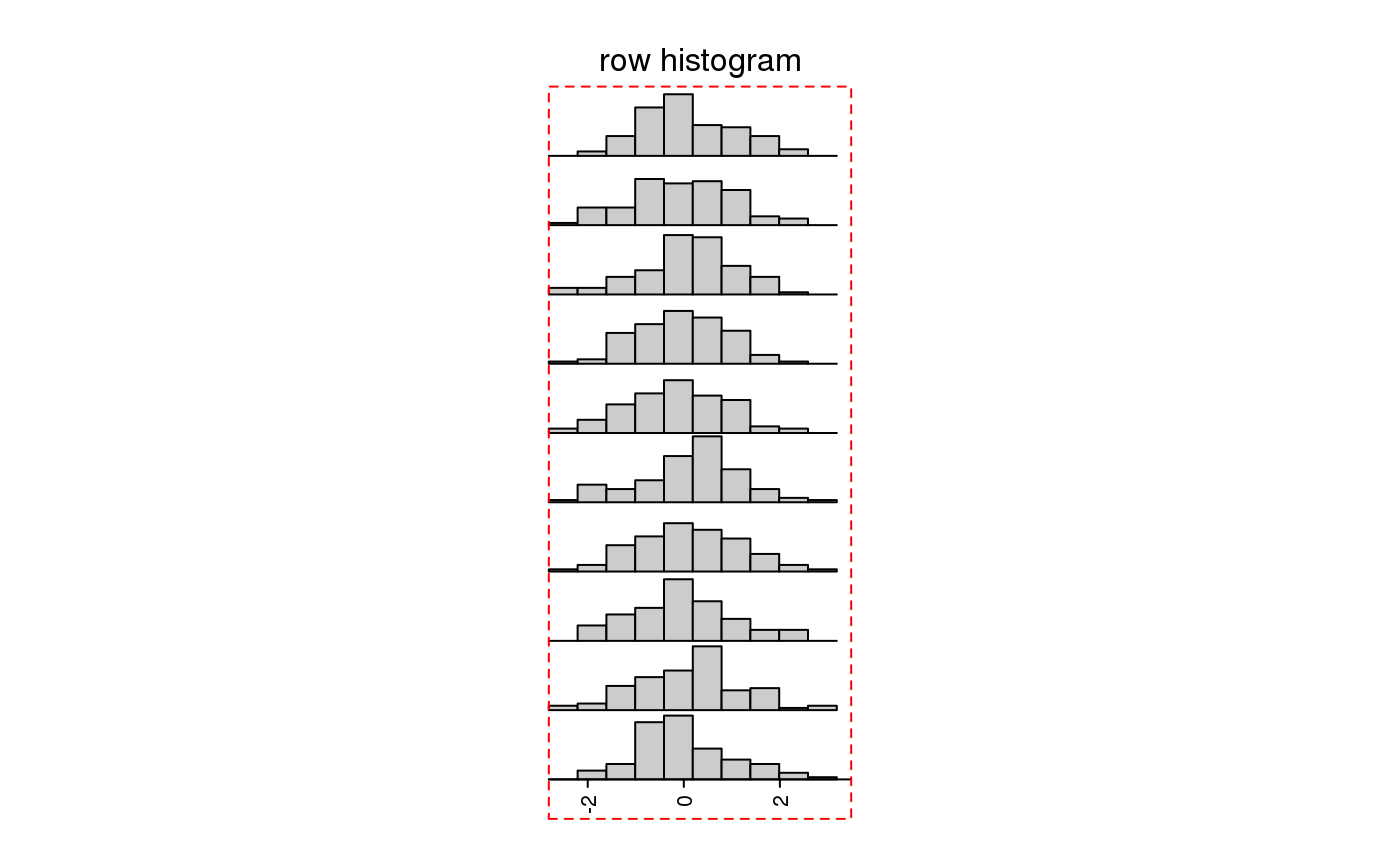
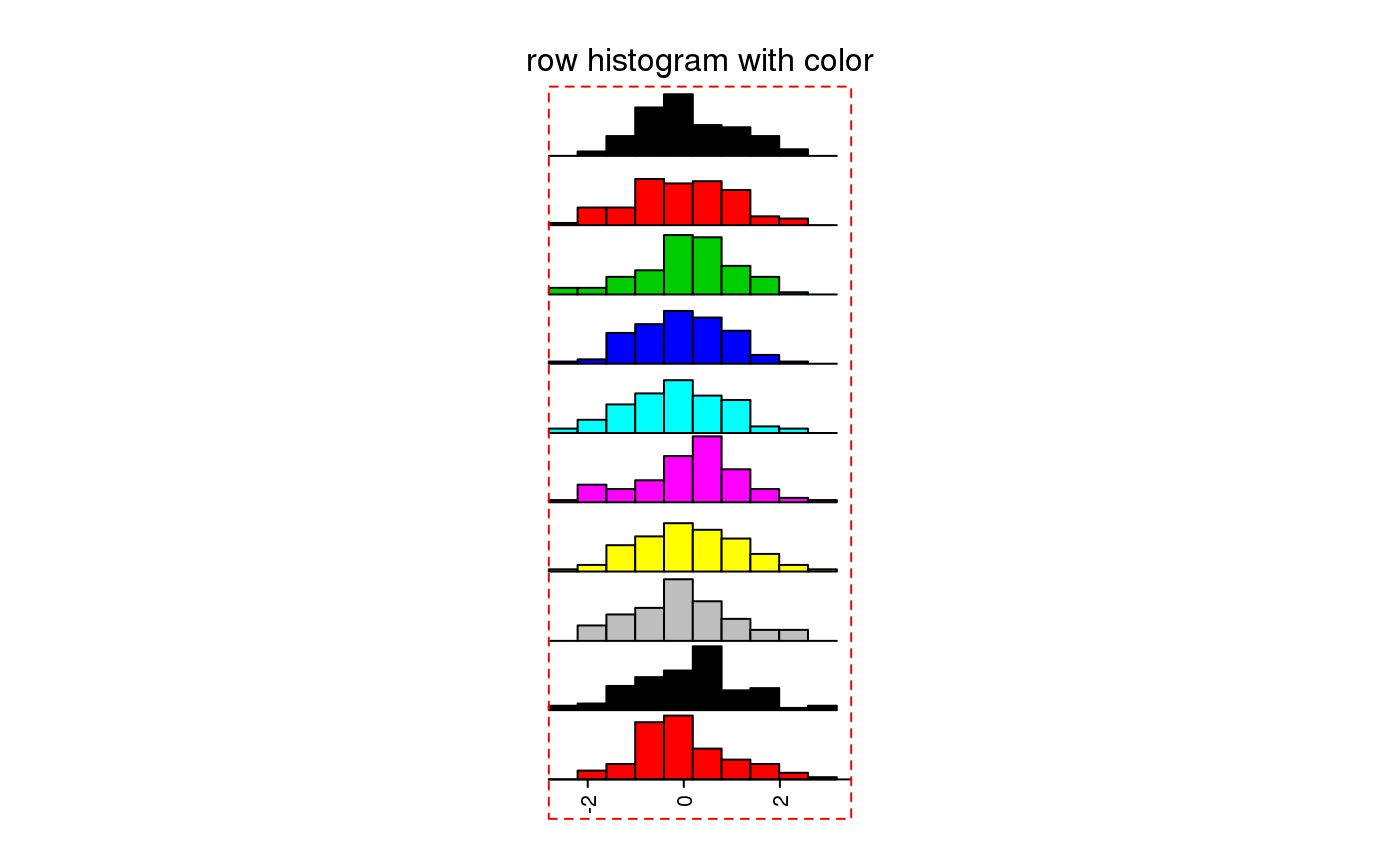
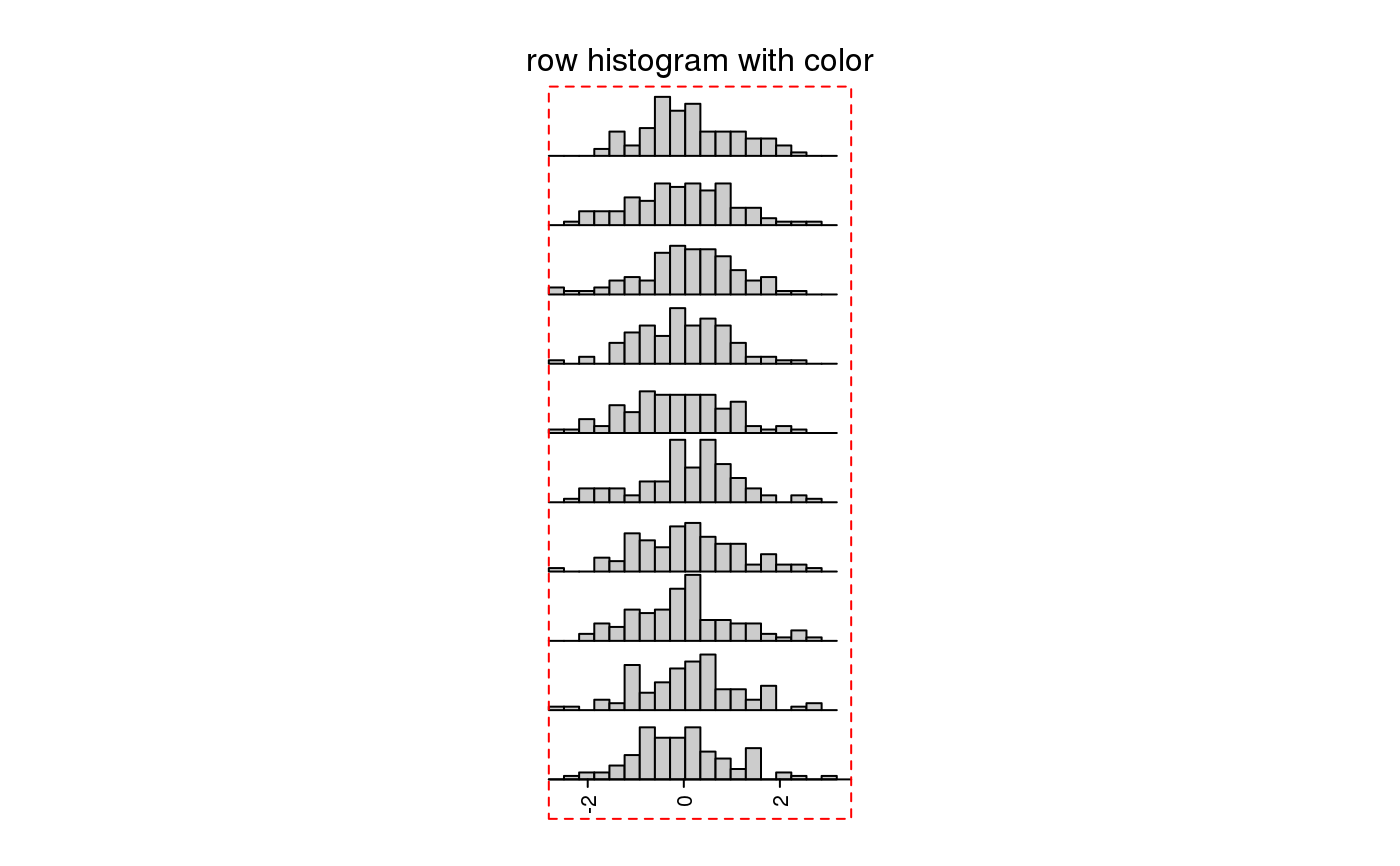
Examples
m = matrix(rnorm(1000), nc = 10)
anno = anno_histogram(t(m), which = "row")
draw(anno, test = "row histogram")anno = anno_histogram(t(m), which = "row", gp = gpar(fill = 1:10))
draw(anno, test = "row histogram with color")anno = anno_histogram(t(m), which = "row", n_breaks = 20)
draw(anno, test = "row histogram with color")