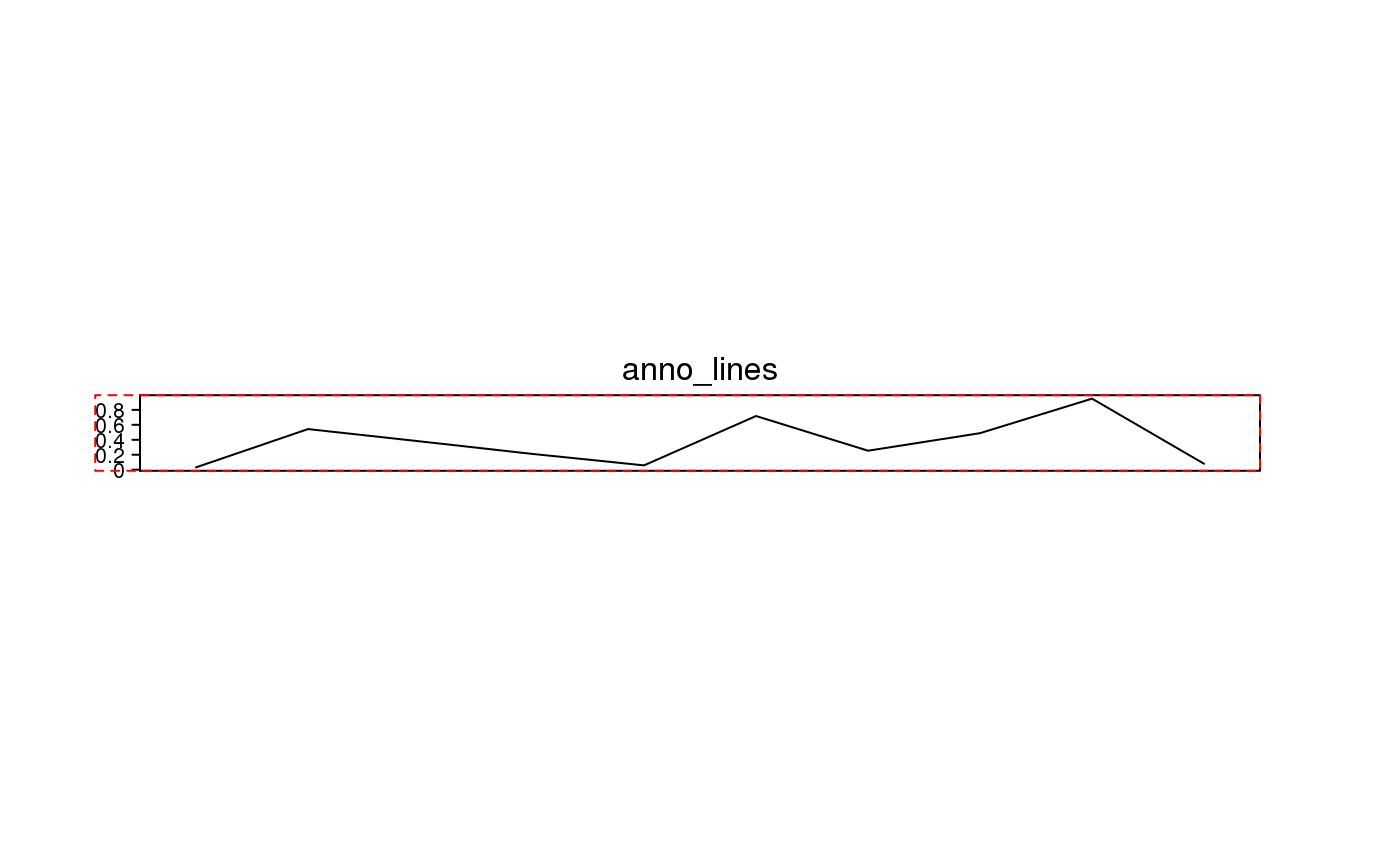
Lines Annotation
anno_lines.RdLines Annotation
anno_lines(x, which = c("column", "row"), border = TRUE, gp = gpar(),
    add_points = smooth, smooth = FALSE, pch = 16, size = unit(2, "mm"), pt_gp = gpar(), ylim = NULL,
    extend = 0.05, axis = TRUE, axis_param = default_axis_param(which),
    width = NULL, height = NULL)
Arguments
| x | The value vector. The value can be a vector or a matrix. The length of the vector or the number of rows of the matrix is taken as the number of the observations of the annotation. |
|---|---|
| which | Whether it is a column annotation or a row annotation? |
| border | Wether draw borders of the annotation region? |
| gp | Graphic parameters for lines. The length of each graphic parameter can be 1, or number of columns of |
| add_points | Whether to add points on the lines? |
| smooth | If it is |
| pch | Point type. The length setting is the same as |
| size | Point size, the value should be a |
| pt_gp | Graphic parameters for points. The length setting is the same as |
| ylim | Data ranges. By default it is |
| extend | The extension to both side of |
| axis | Whether to add axis? |
| axis_param | parameters for controlling axis. See |
| width | Width of the annotation. The value should be an absolute unit. Width is not allowed to be set for column annotation. |
| height | Height of the annotation. The value should be an absolute unit. Height is not allowed to be set for row annotation. |
Value
An annotation function which can be used in HeatmapAnnotation.
See also
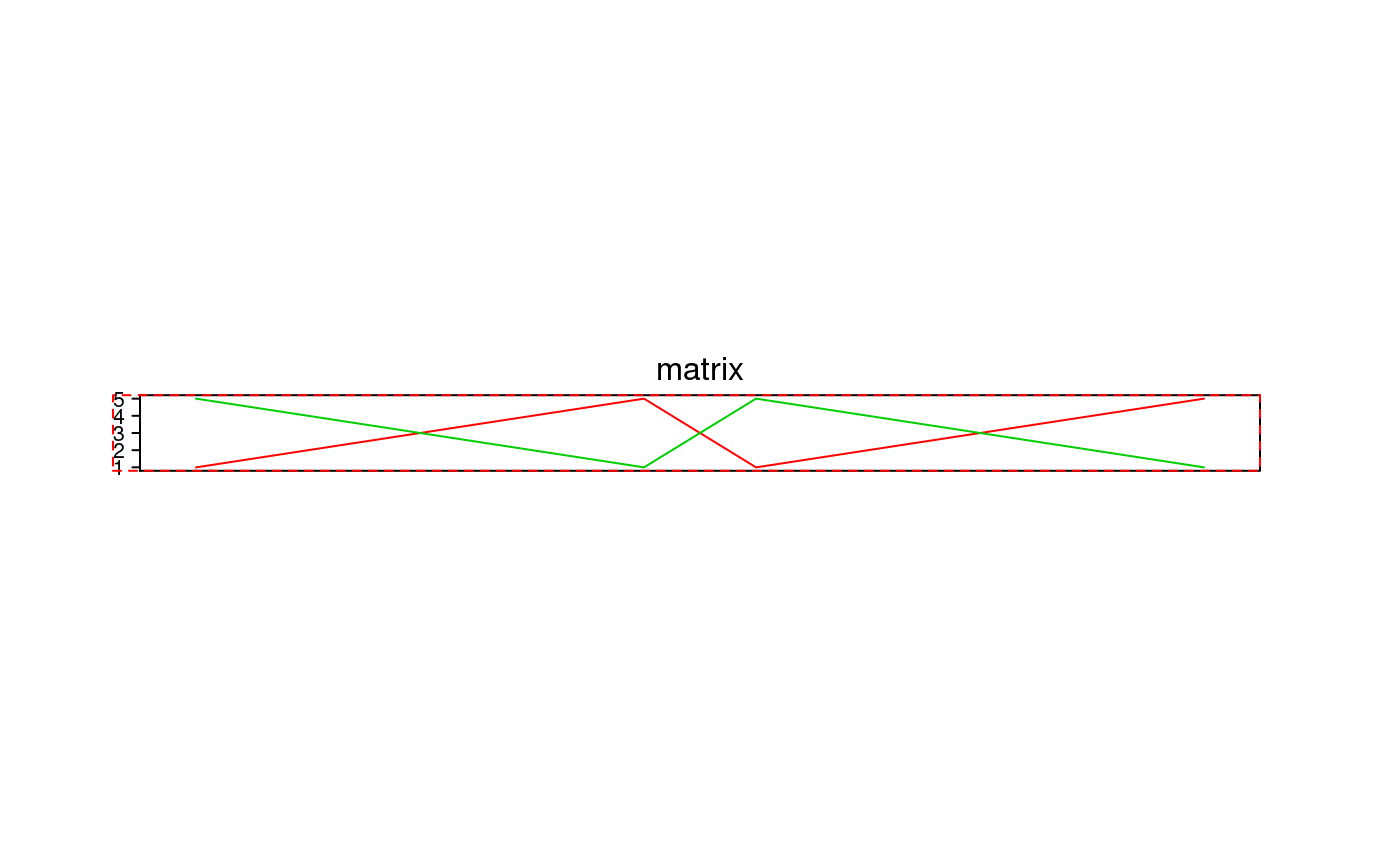
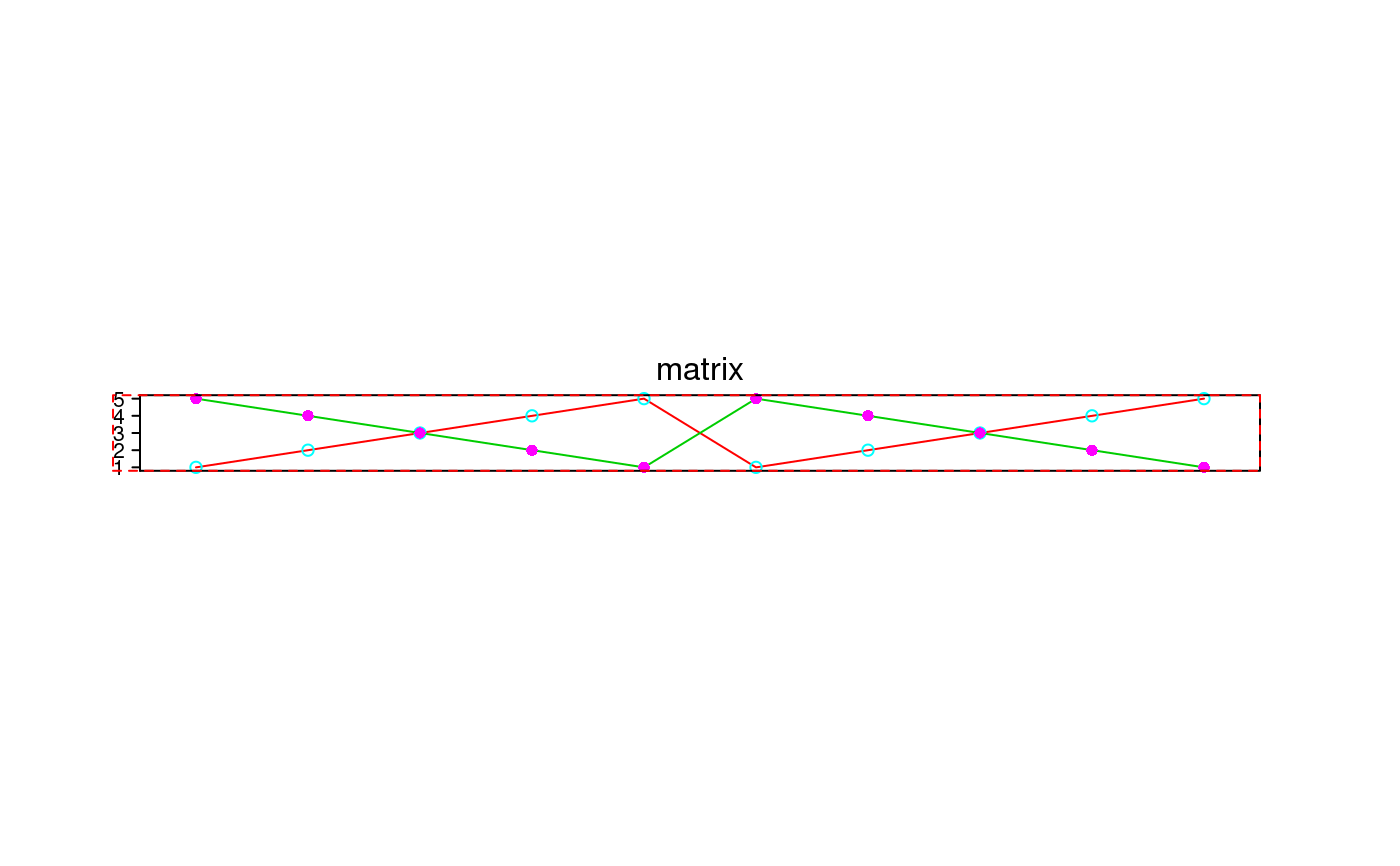
Examples
anno = anno_lines(cbind(c(1:5, 1:5), c(5:1, 5:1)), gp = gpar(col = 2:3)) draw(anno, test = "matrix")anno = anno_lines(cbind(c(1:5, 1:5), c(5:1, 5:1)), gp = gpar(col = 2:3), add_points = TRUE, pt_gp = gpar(col = 5:6), pch = c(1, 16)) draw(anno, test = "matrix")