Link annotation with labels
anno_mark.RdLink annotation with labels
anno_mark(at, labels, which = c("column", "row"),
    side = ifelse(which == "column", "top", "right"),
    lines_gp = gpar(), labels_gp = gpar(),
    labels_rot = ifelse(which == "column", 90, 0), padding = 0.5,
    link_width = unit(5, "mm"), link_height = link_width,
    link_gp = lines_gp,
    extend = unit(0, "mm"))
Arguments
| at | Numeric index from the original matrix. |
|---|---|
| labels | Corresponding labels. |
| which | Whether it is a column annotation or a row annotation? |
| side | Side of the labels. If it is a column annotation, valid values are "top" and "bottom"; If it is a row annotation, valid values are "left" and "right". |
| lines_gp | Please use |
| link_gp | Graphic settings for the segments. |
| labels_gp | Graphic settings for the labels. |
| labels_rot | Rotations of labels, scalar. |
| padding | Padding between neighbouring labels in the plot. |
| link_width | Width of the segments. |
| link_height | Similar as |
| extend | By default, the region for the labels has the same width (if it is a column annotation) or same height (if it is a row annotation) as the heatmap. The size can be extended by this options. The value can be a proportion number or a |
Details
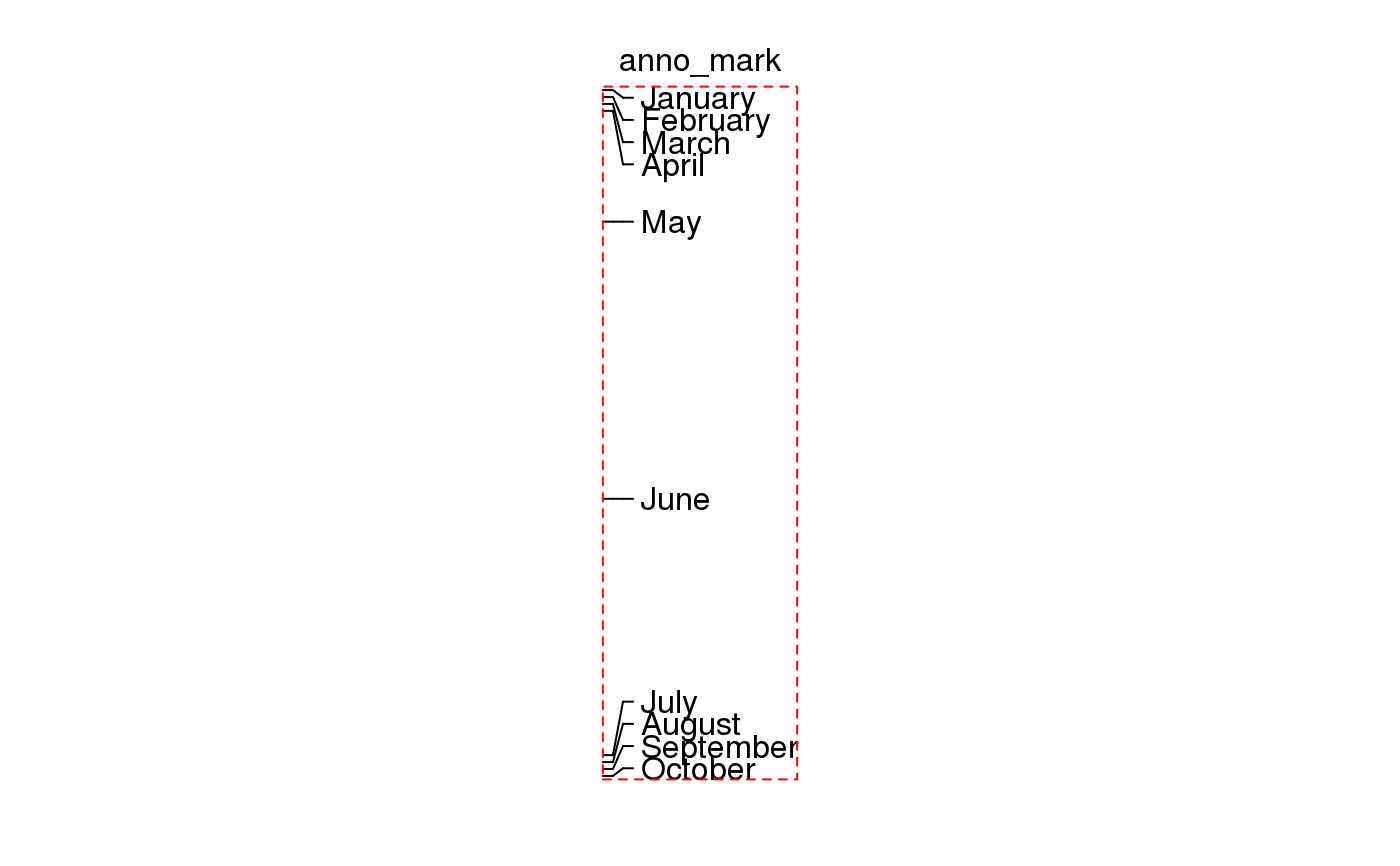
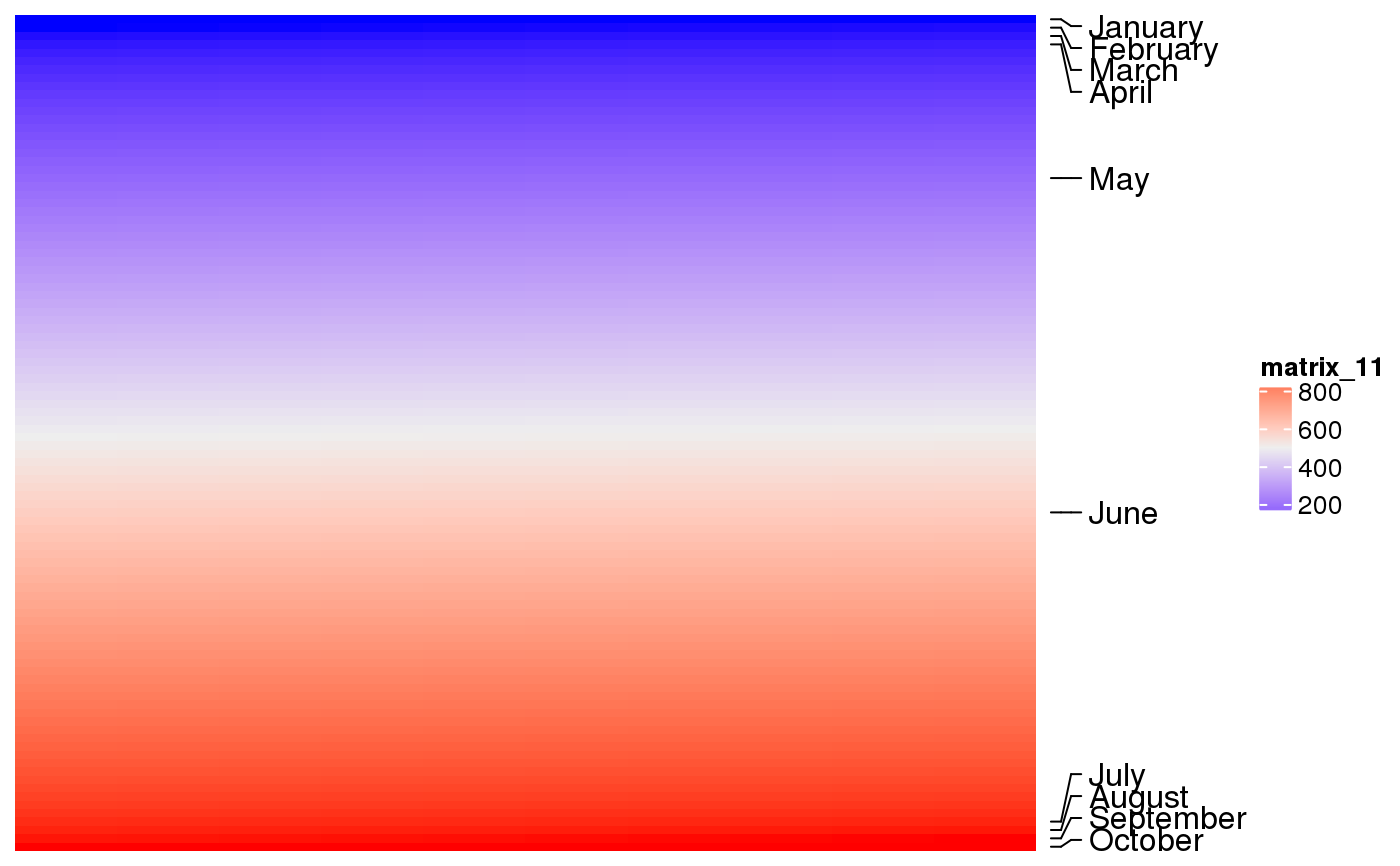
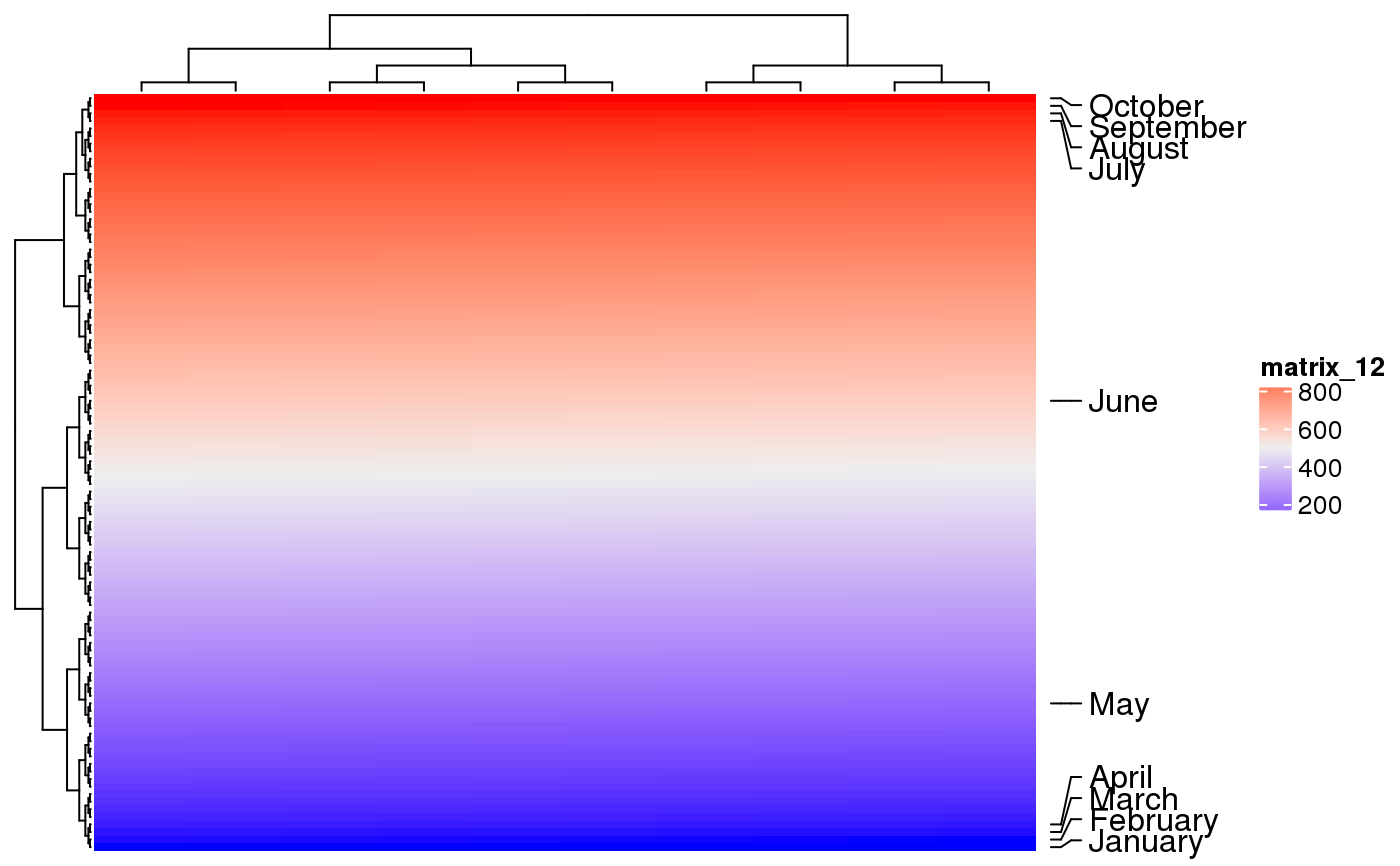
Sometimes there are many rows or columns in the heatmap and we want to mark some of the rows. This annotation function is used to mark these rows and connect labels and corresponding rows with links.
Value
An annotation function which can be used in HeatmapAnnotation.
See also
Examples
anno = anno_mark(at = c(1:4, 20, 60, 97:100), labels = month.name[1:10], which = "row") draw(anno, index = 1:100, test = "anno_mark")m = matrix(1:1000, byrow = TRUE, nr = 100) anno = anno_mark(at = c(1:4, 20, 60, 97:100), labels = month.name[1:10], which = "row") Heatmap(m, cluster_rows = FALSE, cluster_columns = FALSE) + rowAnnotation(mark = anno)


