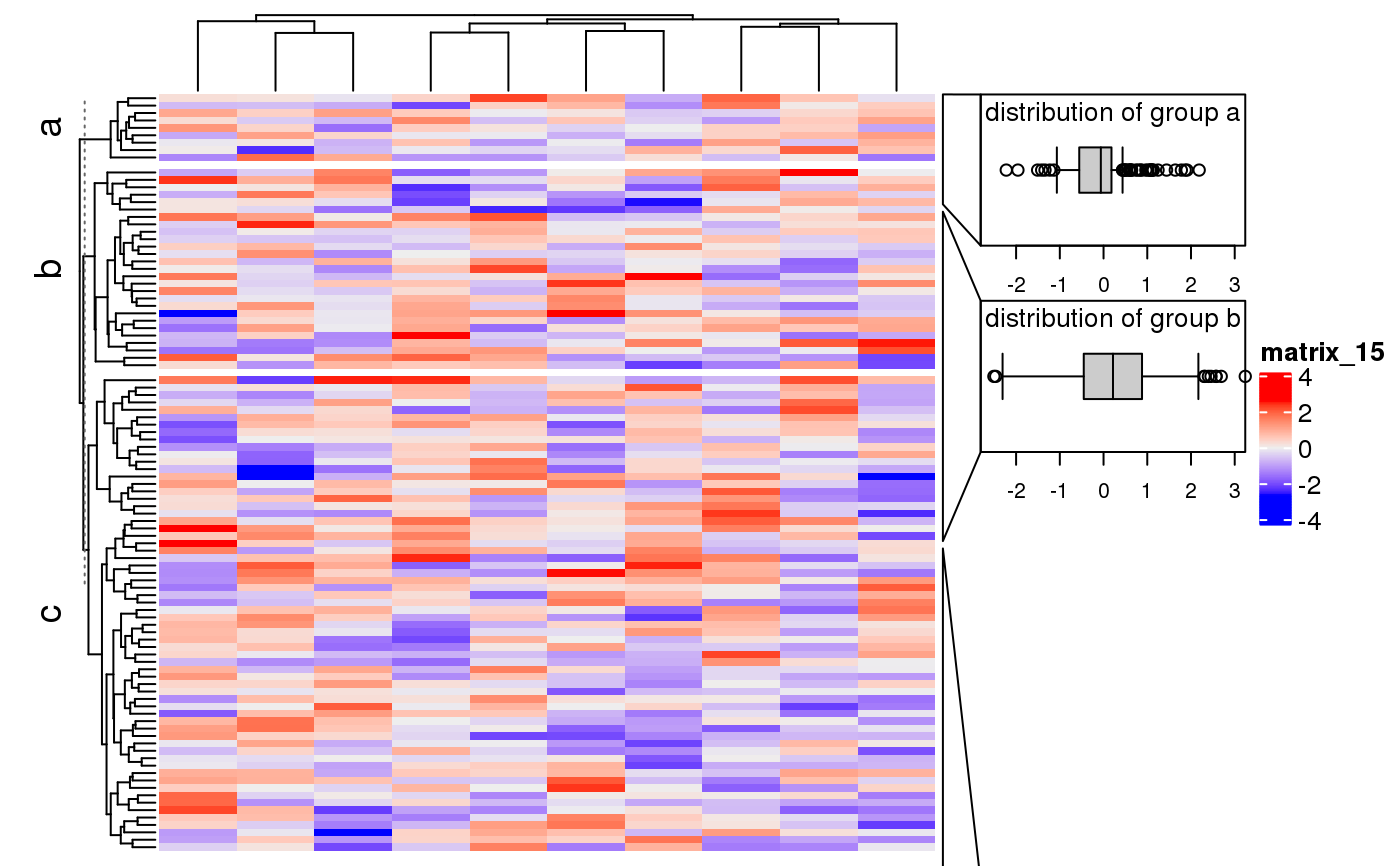
Zoom annotation
anno_zoom.RdZoom annotation
anno_zoom(align_to, panel_fun = function(index, nm = NULL) { grid.rect() },
    which = c("column", "row"), side = ifelse(which == "column", "top", "right"),
    size = NULL, gap = unit(1, "mm"),
    link_width = unit(5, "mm"), link_height = link_width, link_gp = gpar(),
    extend = unit(0, "mm"), width = NULL, height = NULL)
Arguments
| align_to | It defines how the boxes correspond to the rows or the columns in the heatmap. If the value is a list of indices, each box corresponds to the rows or columns with indices in one vector in the list. If the value is a categorical variable (e.g. a factor or a character vector) that has the same length as the rows or columns in the heatmap, each box corresponds to the rows/columns in each level in the categorical variable. |
|---|---|
| panel_fun | A self-defined function that defines how to draw graphics in the box. The function must have a |
| which | Whether it is a column annotation or a row annotation? |
| side | Side of the boxes If it is a column annotation, valid values are "top" and "bottom"; If it is a row annotation, valid values are "left" and "right". |
| size | The size of boxes. It can be pure numeric that they are treated as relative fractions of the total height/width of the heatmap. The value of |
| gap | Gaps between boxes. |
| link_gp | Graphic settings for the segments. |
| link_width | Width of the segments. |
| link_height | Similar as |
| extend | By default, the region for the labels has the same width (if it is a column annotation) or same height (if it is a row annotation) as the heatmap. The size can be extended by this options. The value can be a proportion number or a |
| width | Width of the annotation. The value should be an absolute unit. Width is not allowed to be set for column annotation. |
| height | Height of the annotation. The value should be an absolute unit. Height is not allowed to be set for row annotation. |
Details
anno_zoom creates several plotting regions (boxes) which can be corresponded to subsets of rows/columns in the
heatmap.
Value
An annotation function which can be used in HeatmapAnnotation.
See also
Examples
set.seed(123)
m = matrix(rnorm(100*10), nrow = 100)
subgroup = sample(letters[1:3], 100, replace = TRUE, prob = c(1, 5, 10))
rg = range(m)
panel_fun = function(index, nm) {
        pushViewport(viewport(xscale = rg, yscale = c(0, 2)))
        grid.rect()
        grid.xaxis(gp = gpar(fontsize = 8))
        grid.boxplot(m[index, ], pos = 1, direction = "horizontal")
        grid.text(paste("distribution of group", nm), mean(rg), y = 1.9,
                just = "top", default.units = "native", gp = gpar(fontsize = 10))
        popViewport()
}
anno = anno_zoom(align_to = subgroup, which = "row", panel_fun = panel_fun,
        size = unit(2, "cm"), gap = unit(1, "cm"), width = unit(4, "cm"))
Heatmap(m, right_annotation = rowAnnotation(foo = anno), row_split = subgroup)