# Screenshots — full admin tour This is the long-form companion to the README. The README now leads with one animated tour and one static report screenshot; the grid below shows every admin surface, kept here so the README stays readable in 90 seconds and the detail is still one click away for anyone evaluating the project. Click any image to open the same page in the live admin demo.
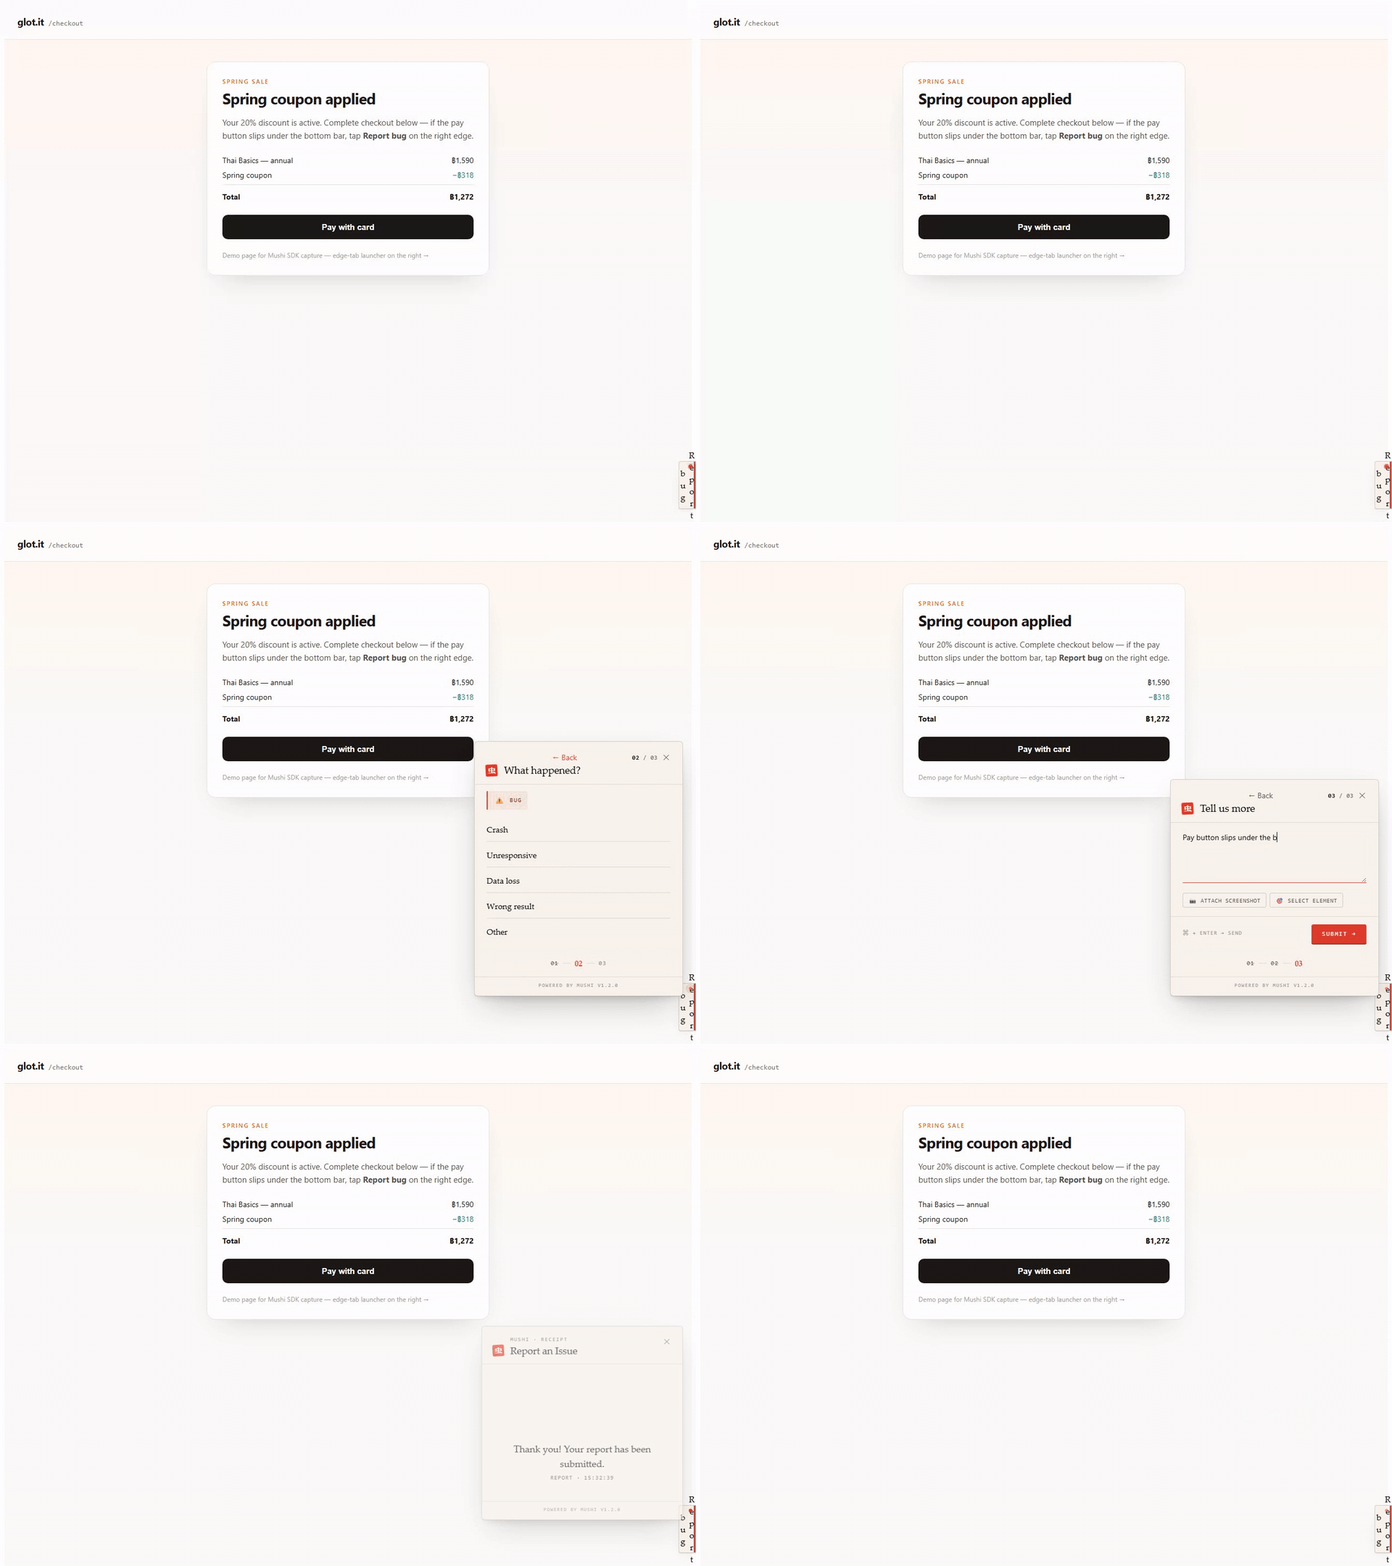
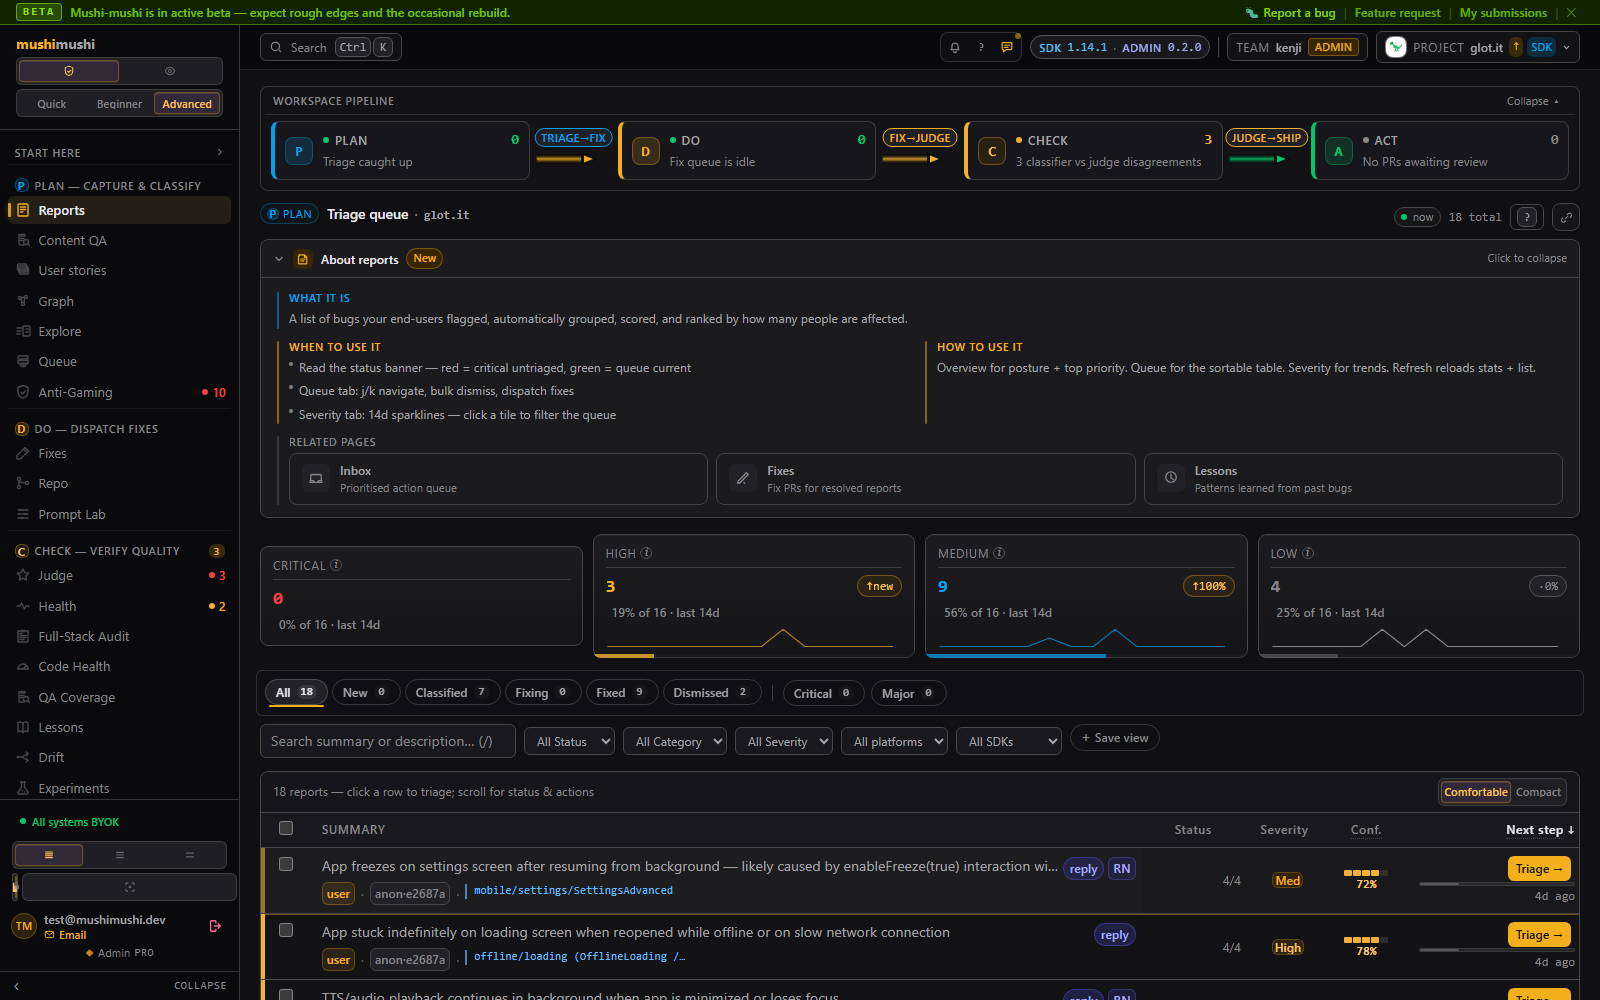
Animated guided tour through the logged-in admin console — dashboard, reports, fixes, and Connect hub. ↑ animated 4-stop tour · free signup · dashboard → reports → fixes → Connect glot.it live app — Mushi web SDK feedback flow (dogfood project) ↑ SDK on glot.it · reports land in the admin console above A real classified user-felt bug inside Mushi Mushi — 4-stamp PDCA receipt strip, live Branch & PR timeline, Langfuse trace deeplink. ↑ a real bug, end-to-end · the admin is dark-only by design
## Tour A walk through the rooms inside. Click any panel to land on it in the live demo.
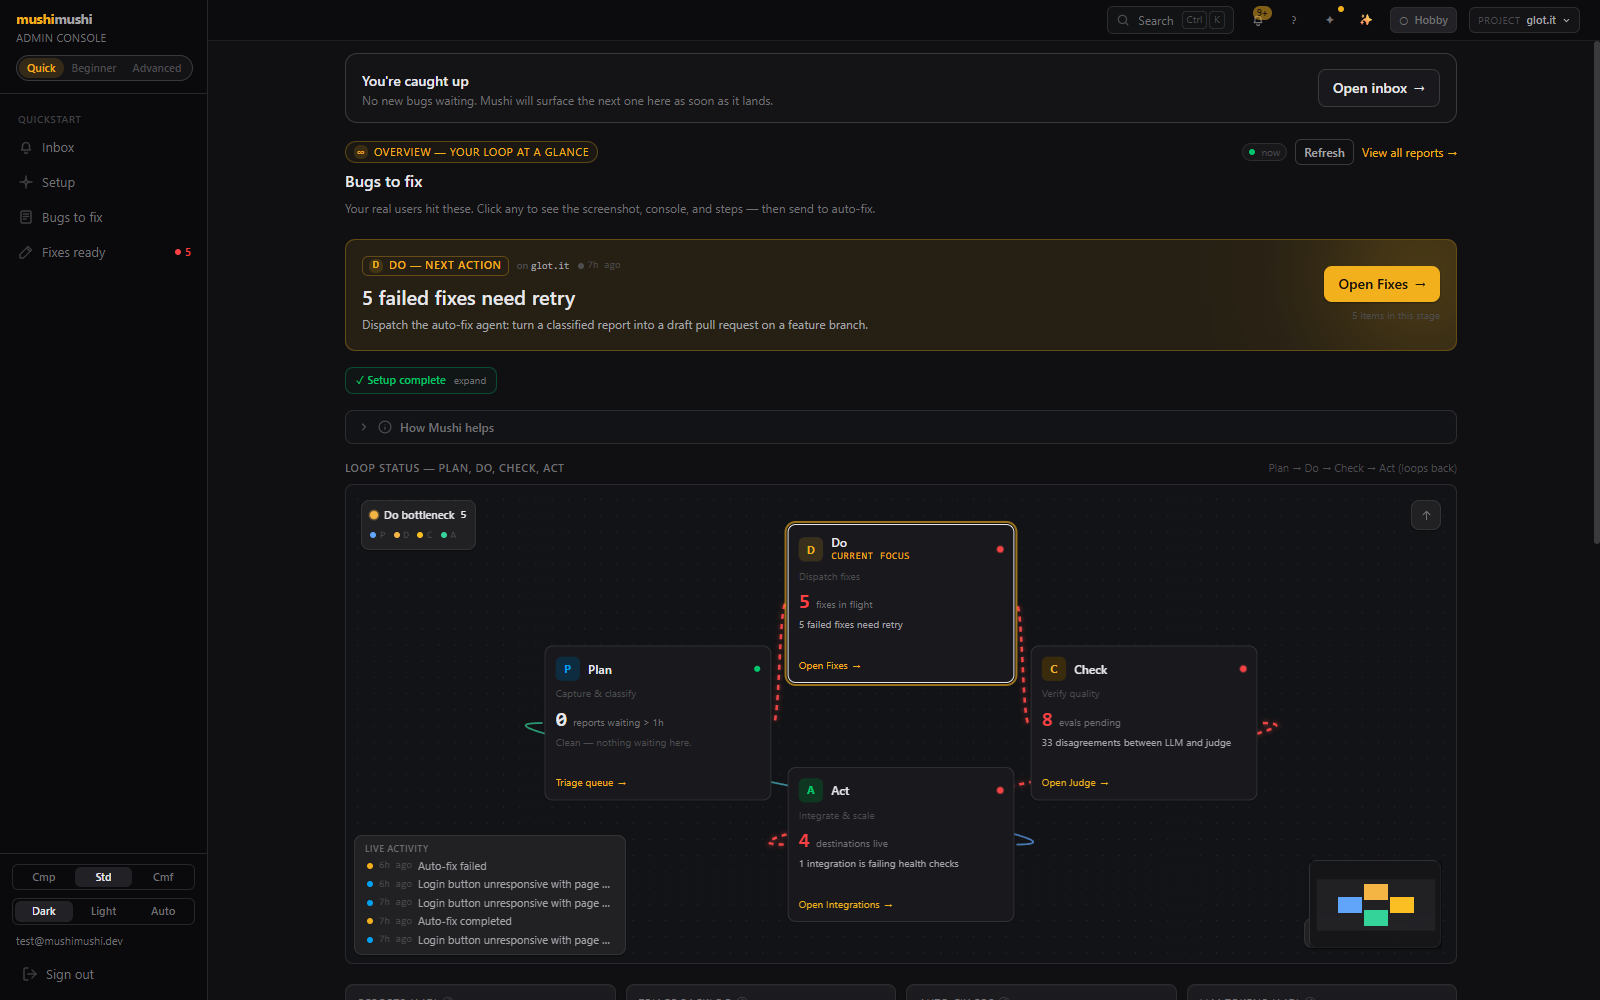
Quickstart mode dashboard — three-page sidebar (Setup, Bugs to fix, Fixes ready) with verb-led labels and zero PDCA jargon.

Quickstart mode · 3 pages, verb-led labels, no PDCA jargon. The default for first-time visitors — pill-toggle up to Beginner (9 pages) or Advanced (all pages) anytime.

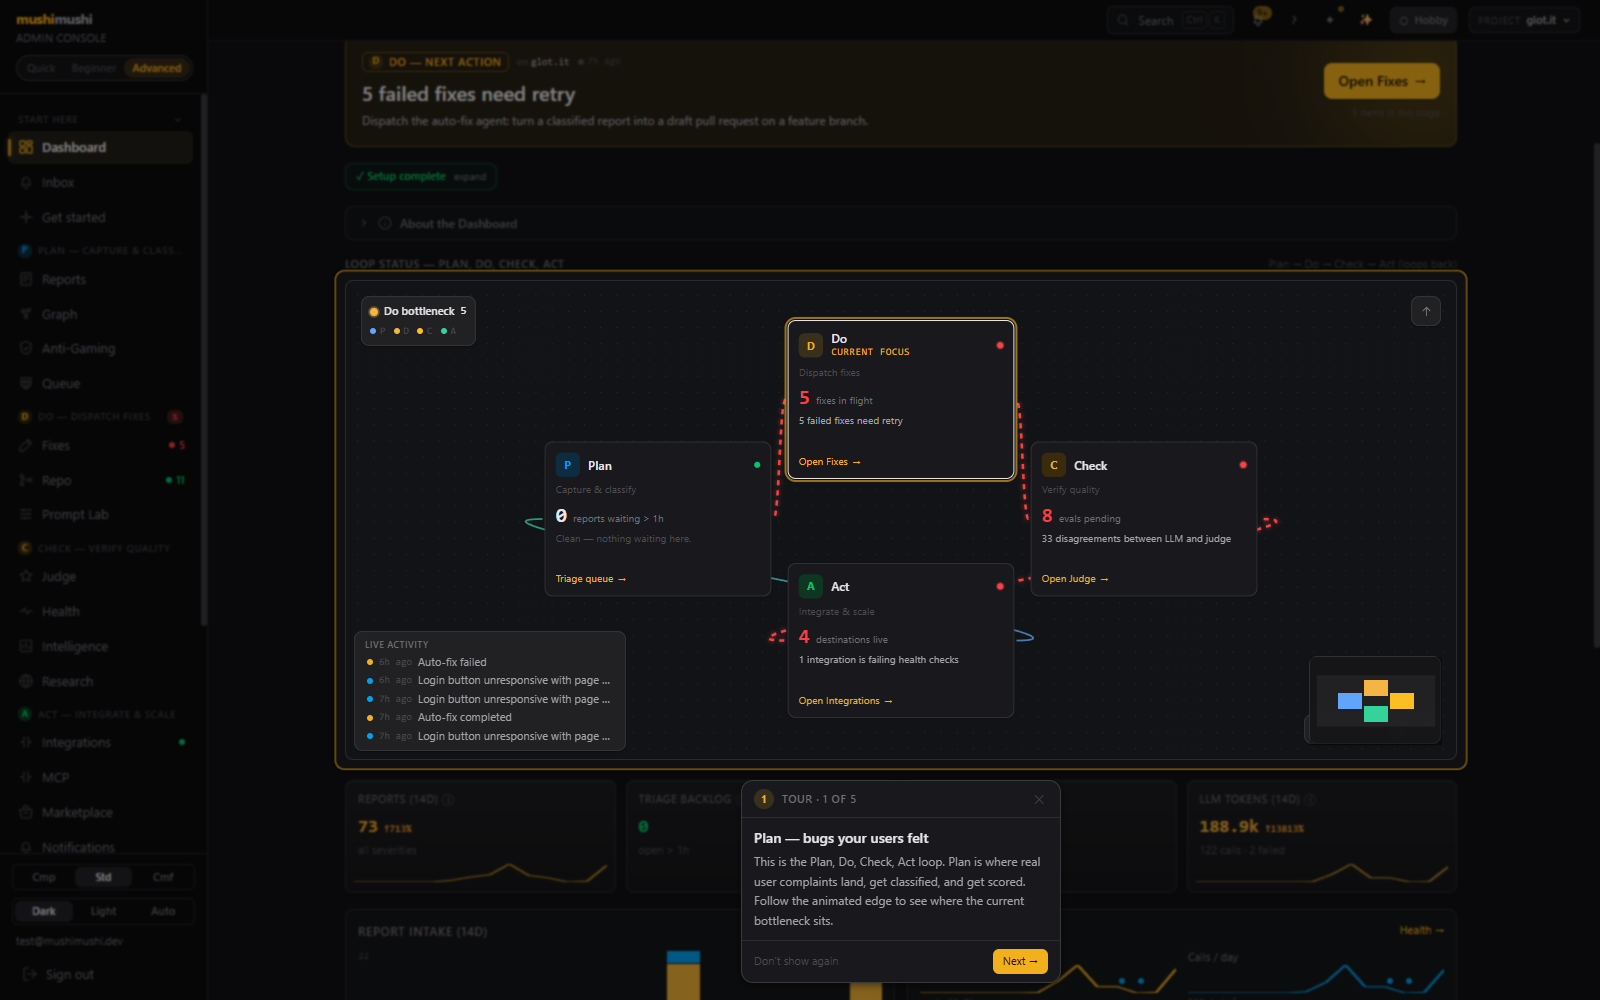
First-run interactive tour — spotlight cutout around the Plan tile, dark backdrop, coach-mark panel with Next button.

First-run tour · 5-stop spotlight tour, no react-joyride dep so it inherits dark theme tokens. Stops that need real data silently skip until the first report lands.

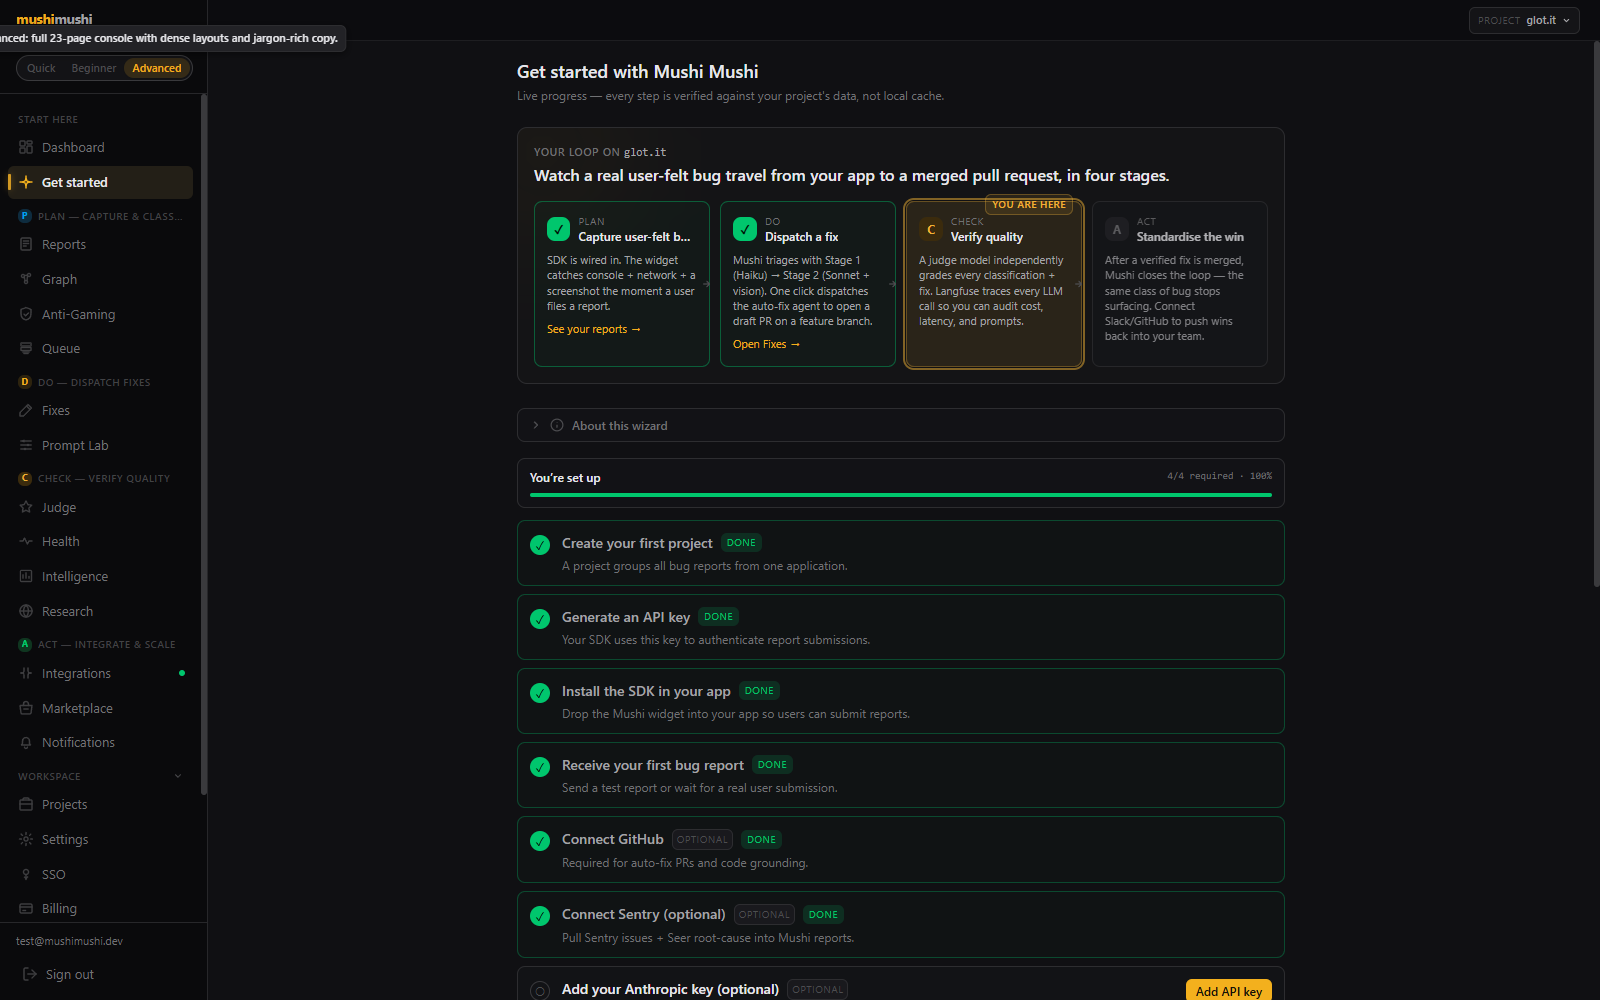
Plug-n-play onboarding wizard with PDCA storyboard.

Plug-n-play onboarding · opens with a Plan→Do→Check→Act storyboard so you see the loop before the checklist. Required steps drive the green progress bar; optional steps stay tagged.

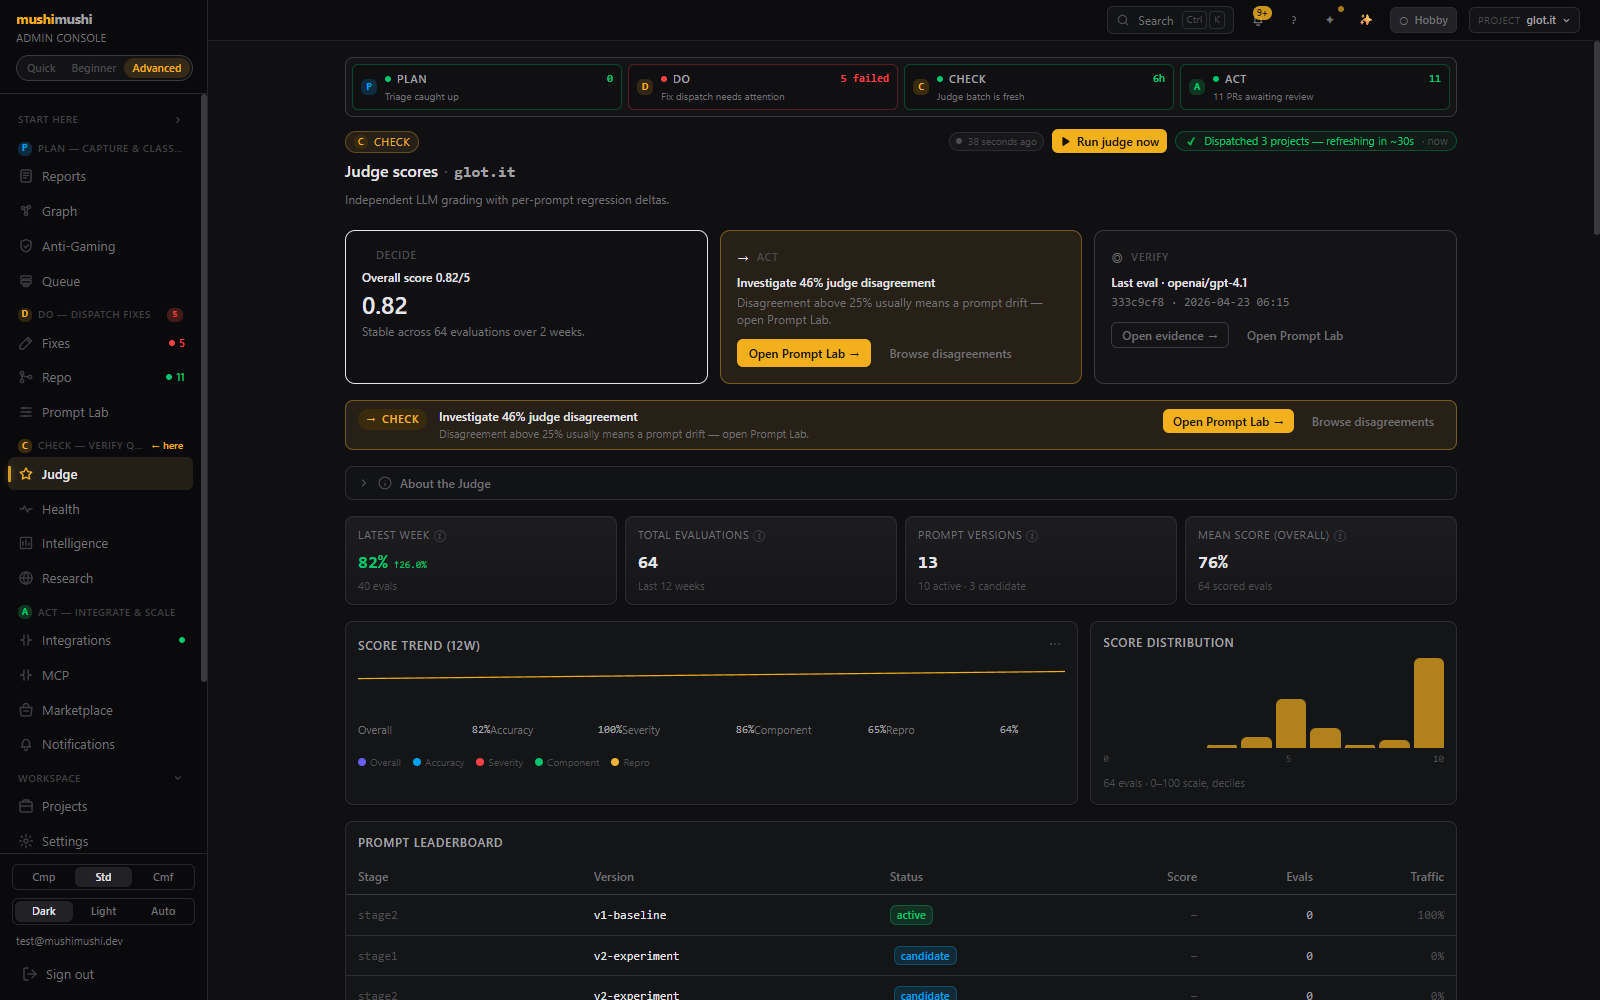
Judge scores page right after clicking 'Run judge now' — sticky ResultChip beside the button reads 'Dispatched 3 projects'.

Sticky run receipts · every Run / Generate / Dispatch button leaves a persistent ResultChip next to it, so you never have to wonder "did it actually work?" after the toast fades.

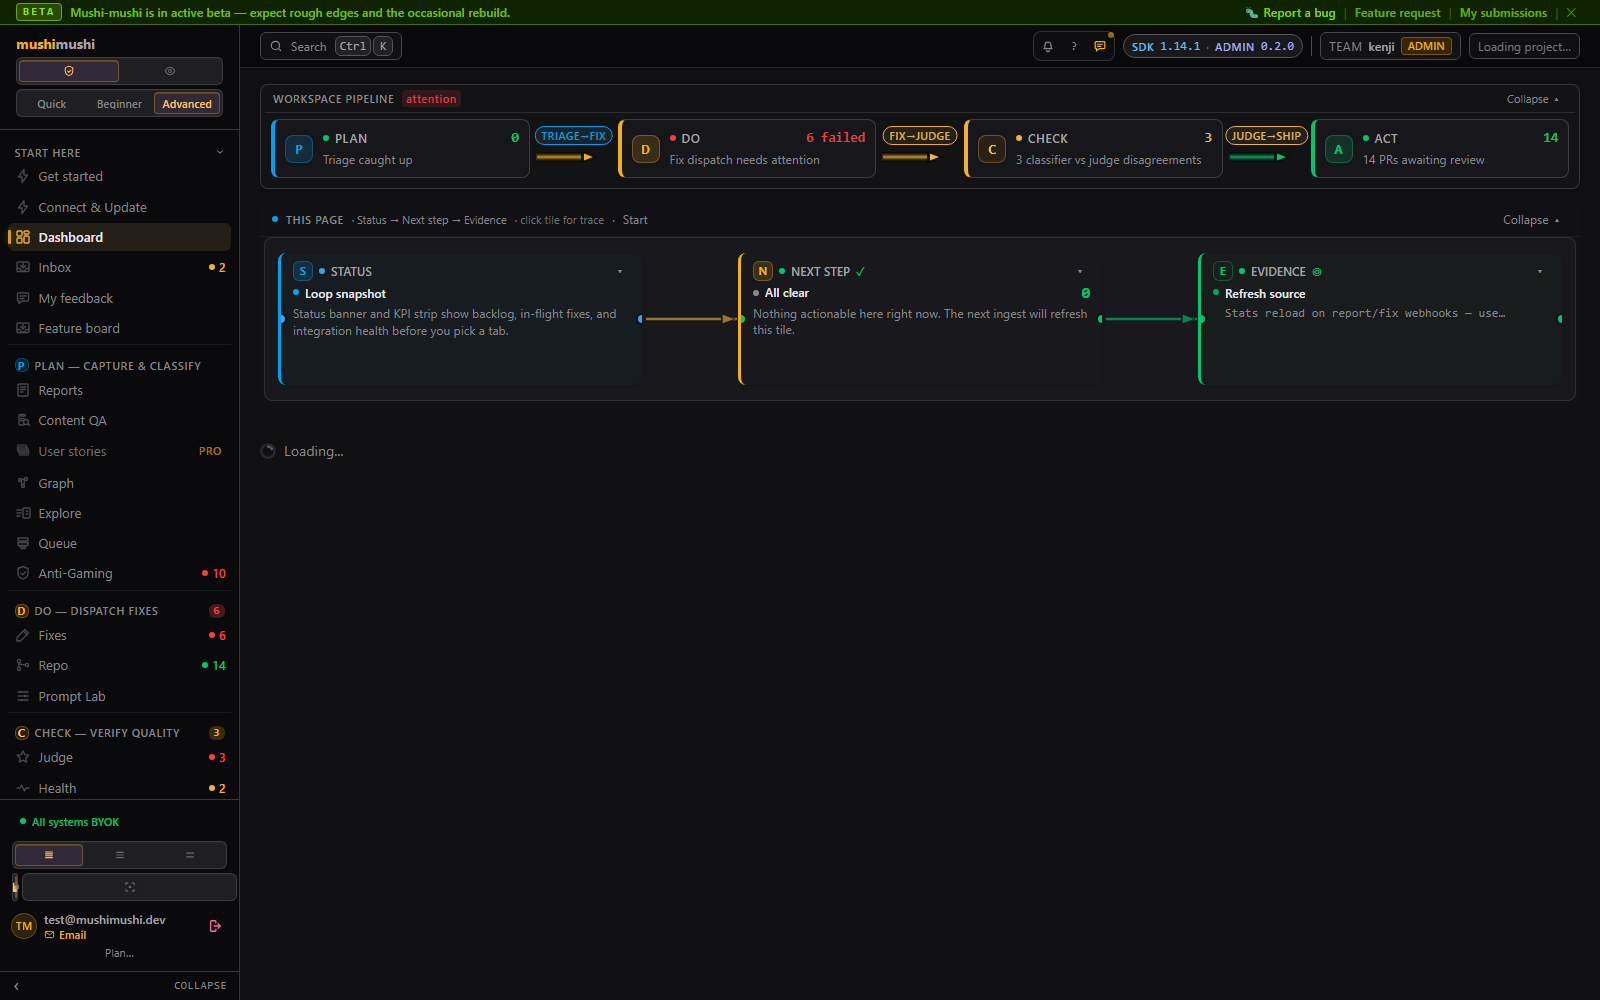
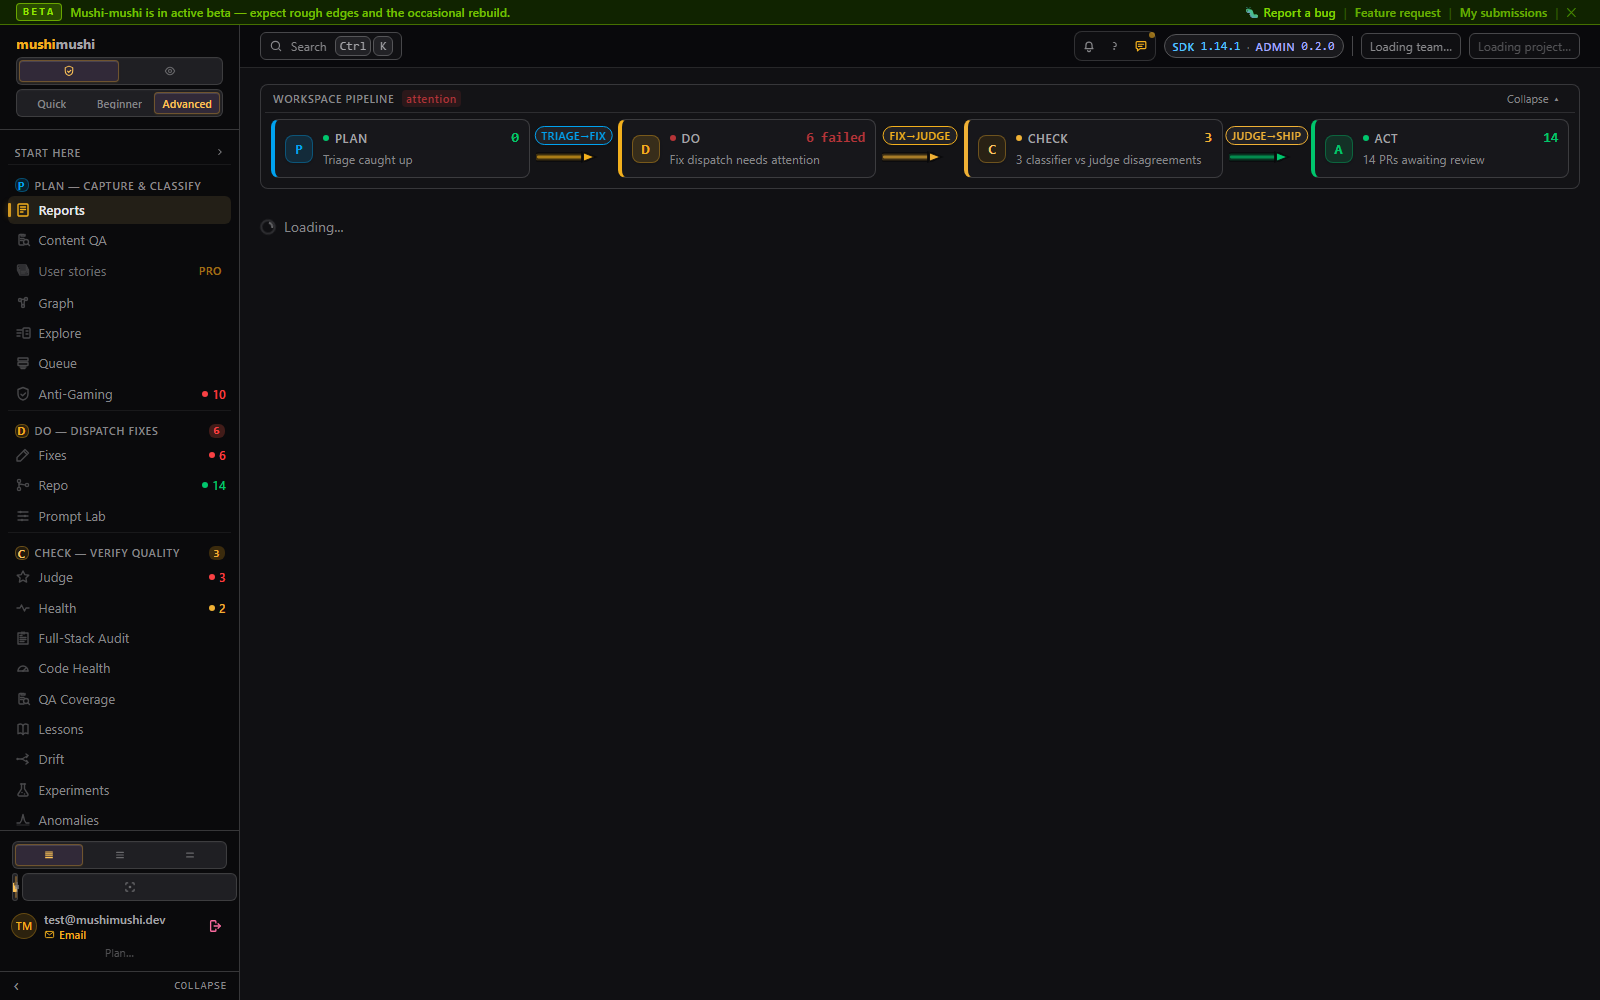
Advanced-mode dashboard with PDCA cockpit — 24-page sidebar grouped by Plan / Do / Check / Act, Next-Best-Action strip, four PDCA tiles on a React Flow canvas with the Do node marked CURRENT FOCUS.

Dashboard (Advanced) · one living number per stage, bottleneck ring, Next-Best-Action strip, 14d severity-stacked histogram, LLM tokens & calls sparklines.

Triage queue — 4 px severity stripe per row, 14d KPI strip, filter row, 60 real reports with status pills, severity pills, and 'Dispatch fix →' primary action per row.

Reports · triage queue with 4 px severity stripe, 14d severity KPIs with sparklines, blast-radius dedup, Save view preset, single primary action per row.

Auto-fix pipeline — KPI cards with sparklines, '9 PRs are ready for review' banner, per-attempt PDCA cards.

Fixes · per-attempt PDCA cards, 30d KPI sparklines, Langfuse trace per run, real PR links, retry-failed CTA.

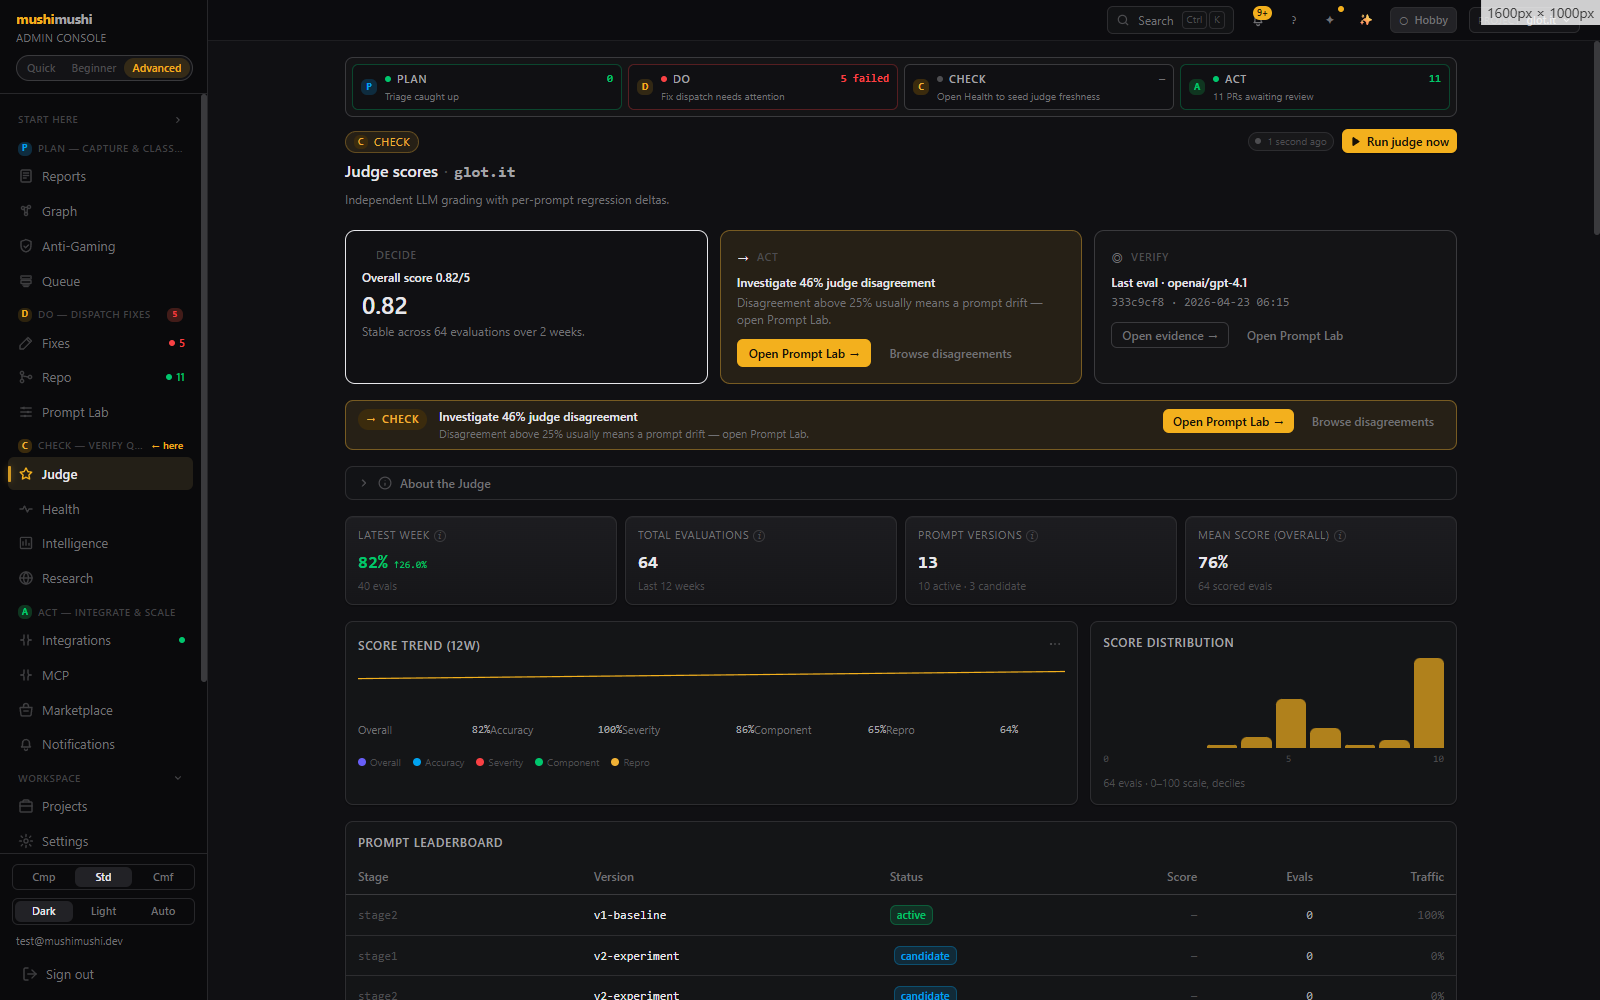
Judge scores with Decide/Act/Verify hero, 12-week score trend with per-dimension lines, score distribution histogram, prompt leaderboard.

Judge · Decide/Act/Verify hero over the charts. Live KPIs, 12w score trend, distribution histogram, prompt leaderboard, one-click re-run.

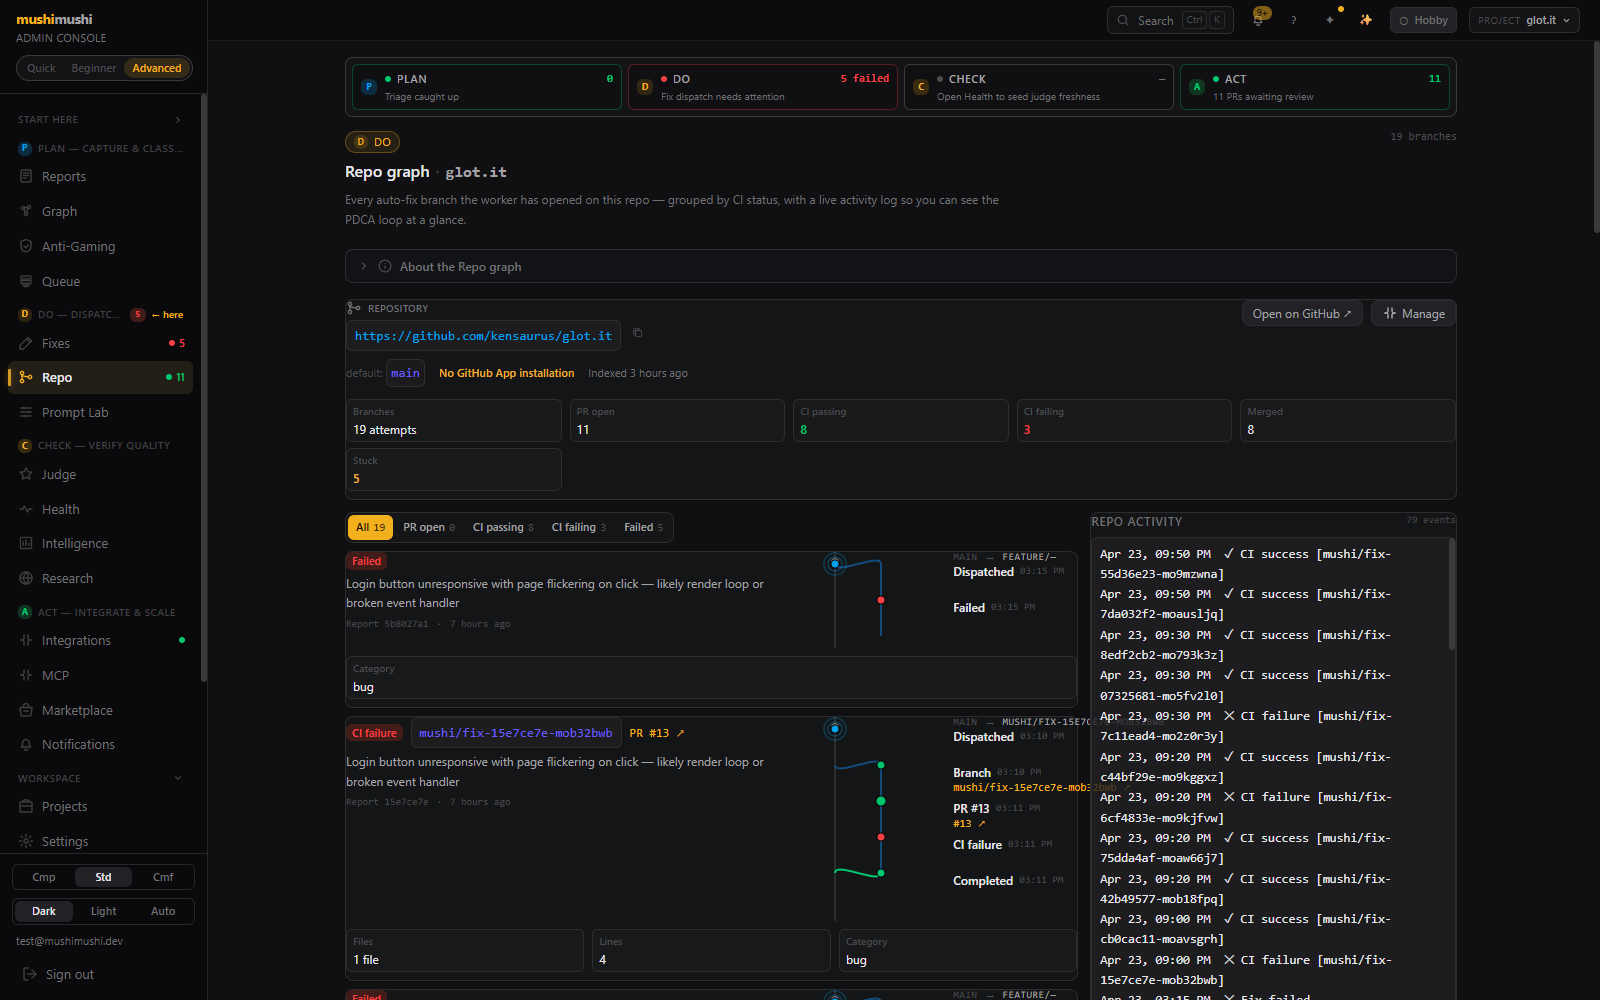
Repo graph page — KPI row, filter tabs, per-branch cards, live REPO ACTIVITY stream on the right.

Repo · one branch per auto-fix attempt, grouped by CI status. Live event stream via Supabase Realtime on fix_events.

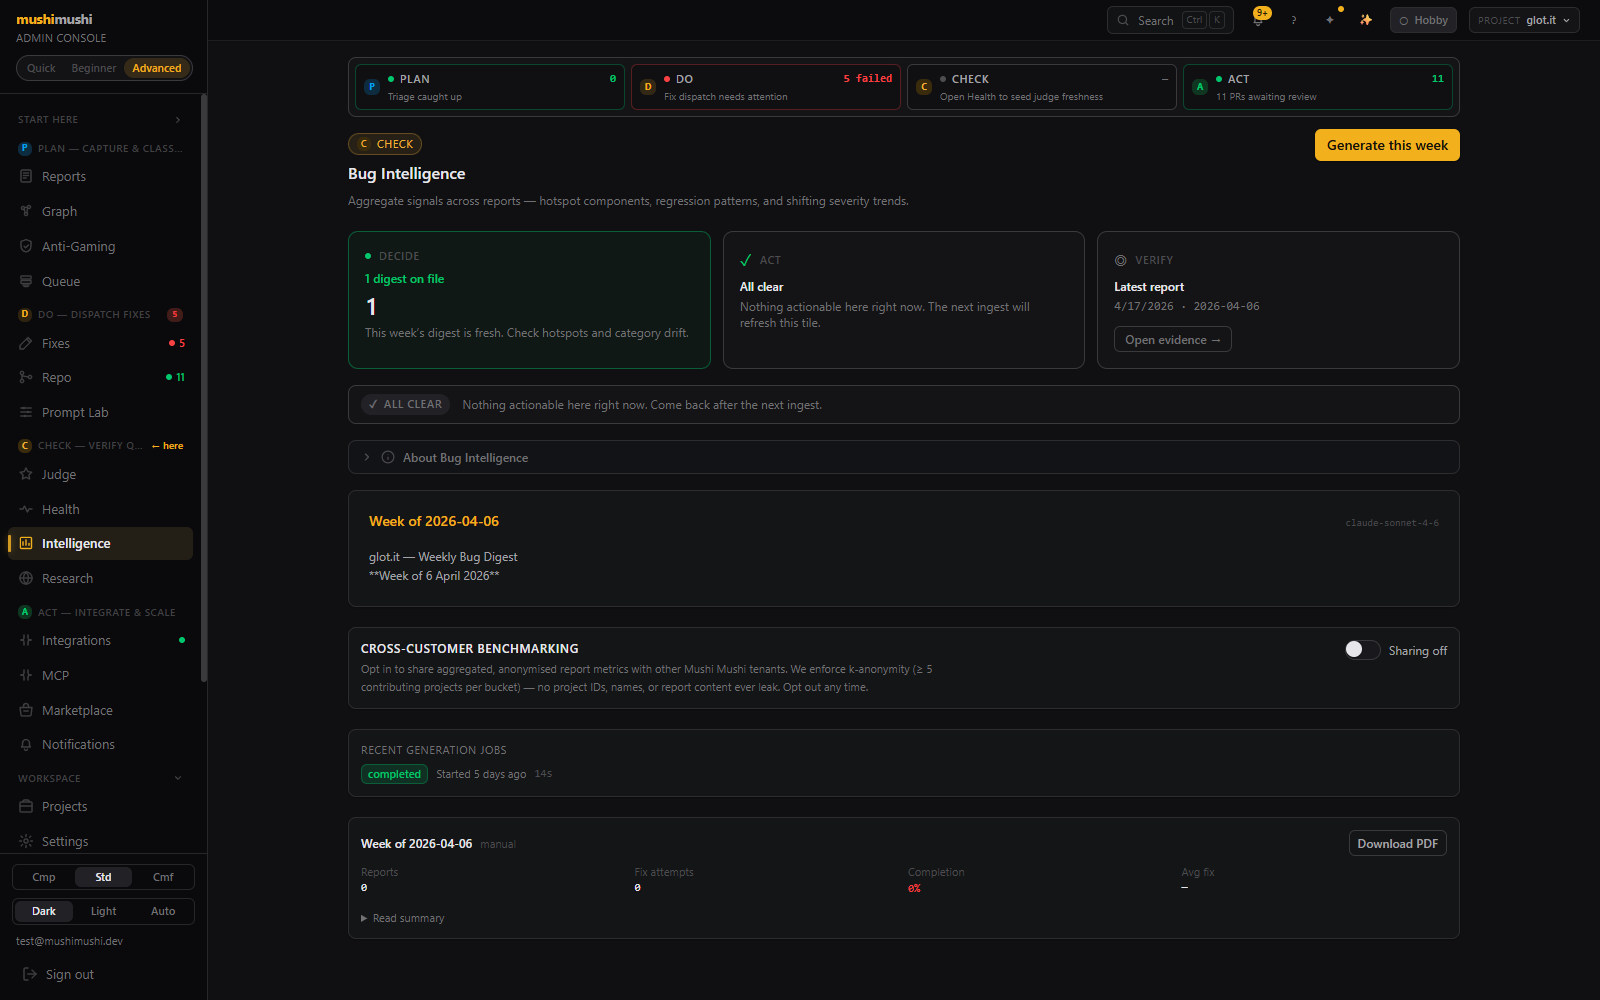
Bug intelligence page with Decide/Act/Verify hero, weekly digest card, recent generation jobs table.

Intelligence · the 3-tile hero pattern in action — Decide surfaces the one-liner that matters, Act collapses to "All clear" when there's nothing to do, Verify deeplinks to the evidence.

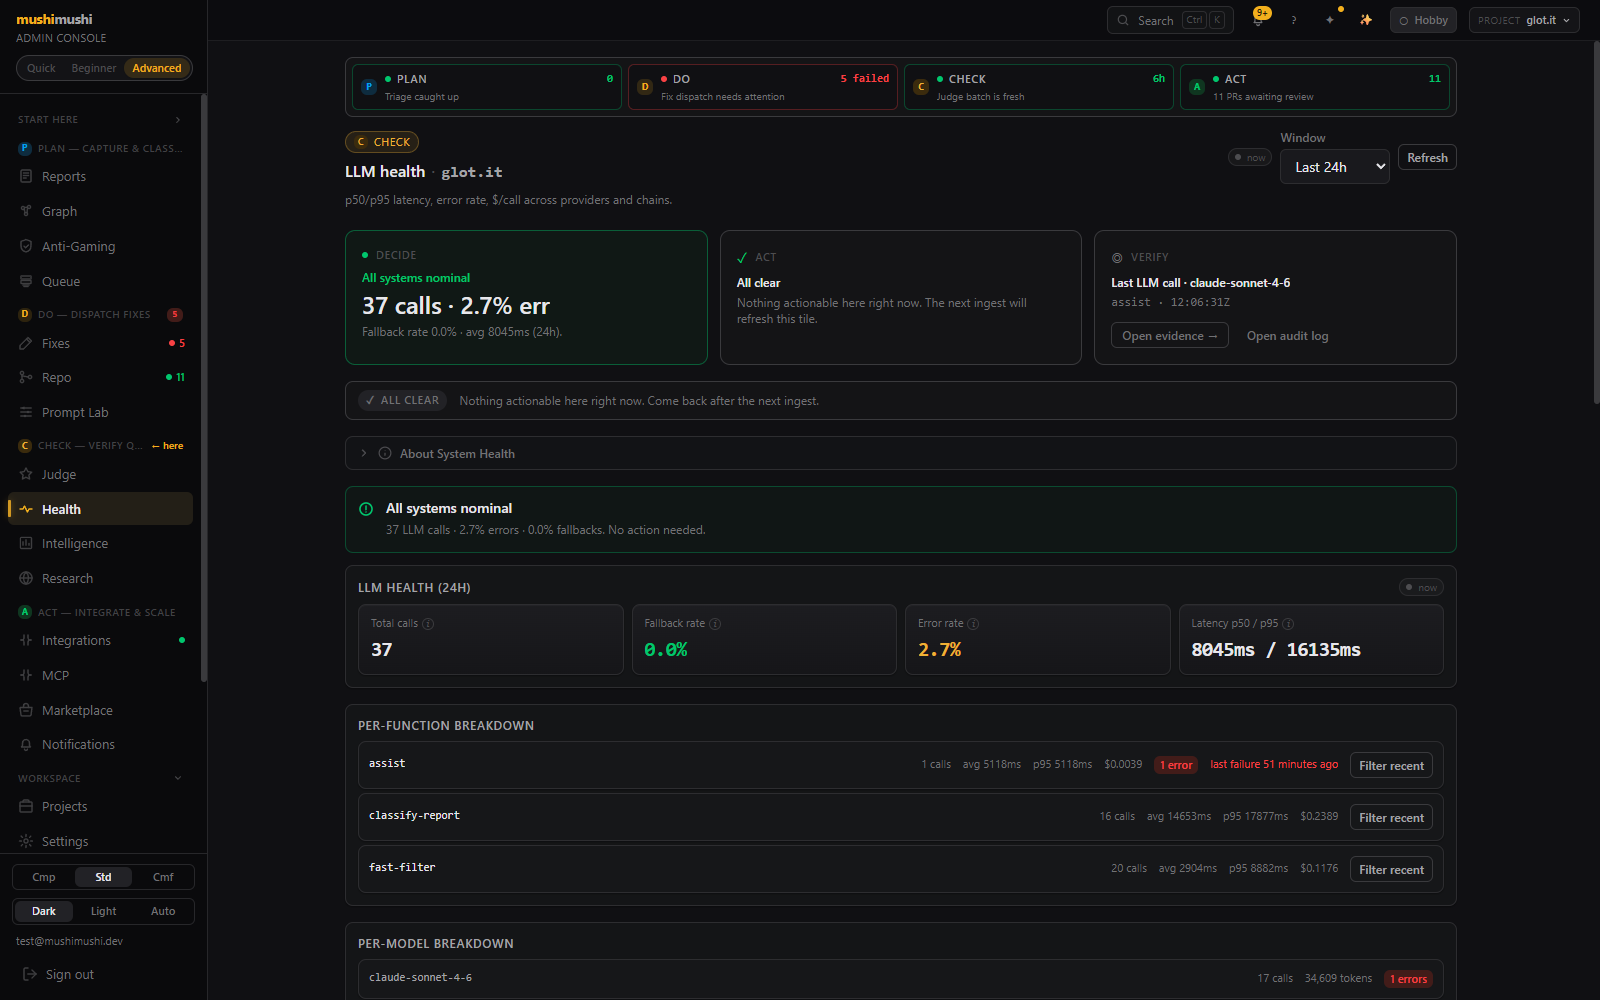
LLM health with Decide/Act/Verify hero, 24h KPI row, per-function and per-model breakdown, provider probes.

Health · real cost_usd per call, per-function / per-model breakdown, p50/p95 latency, fallback rate, cron triggers, Langfuse deeplinks.

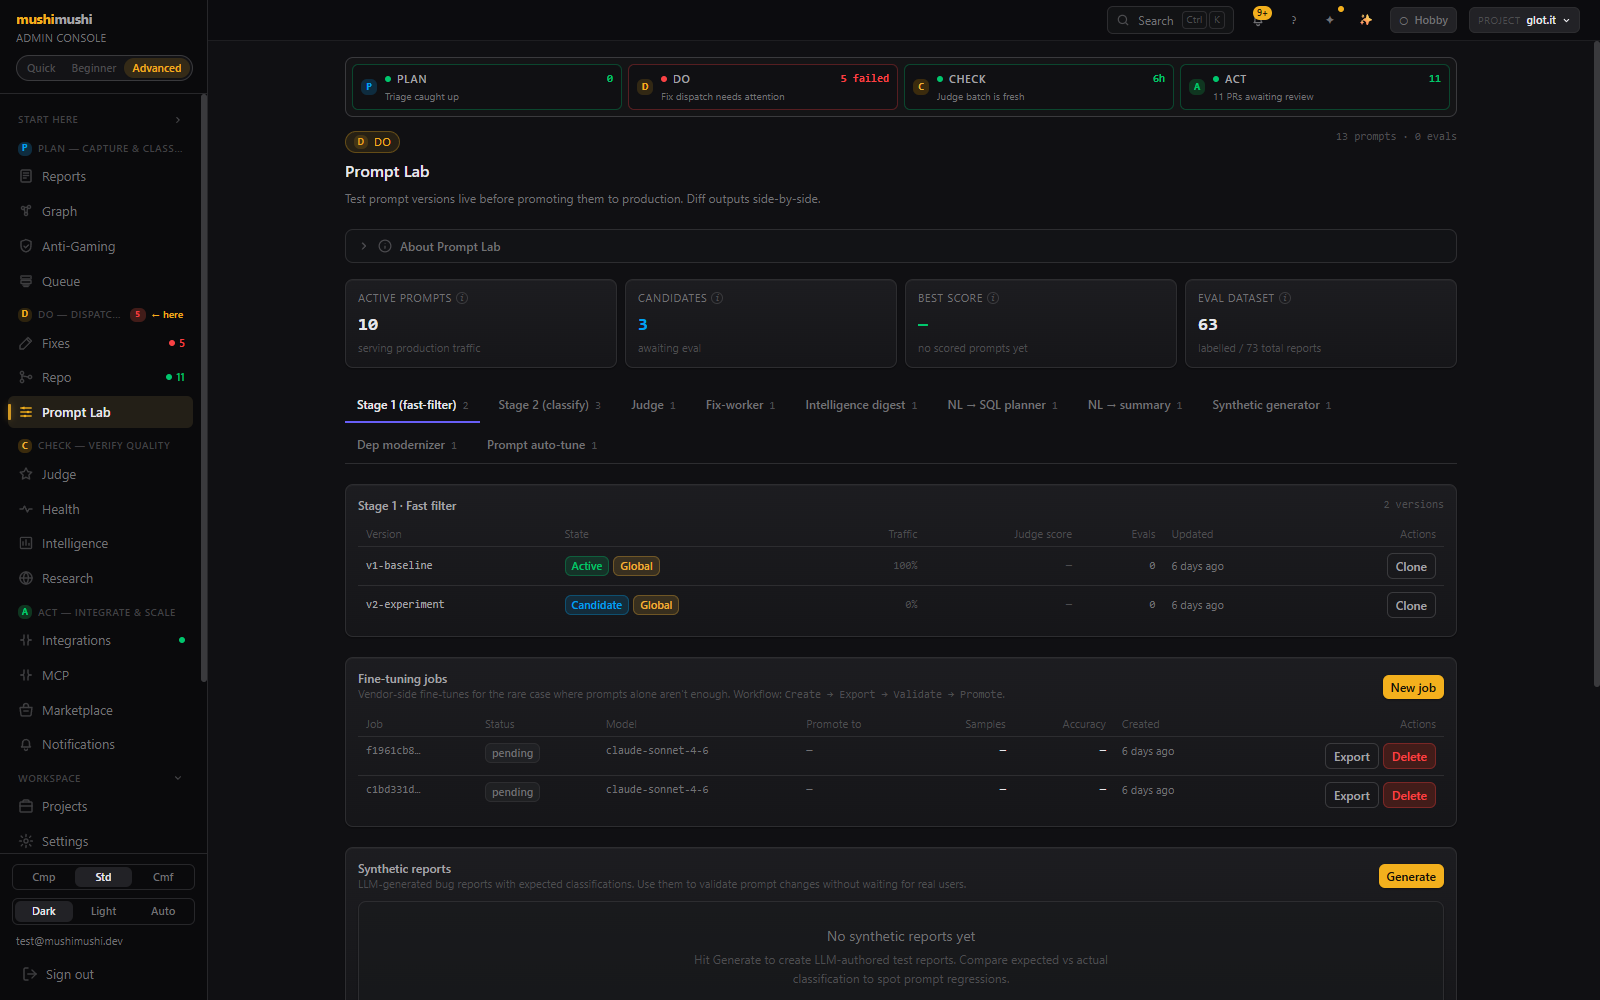
Prompt Lab — KPIs, Stage 1 fast-filter and Stage 2 classify version tables, two pending fine-tuning jobs.

Prompt Lab · A/B traffic split between active and candidate prompts per stage, eval dataset preview, synthetic report generator, fine-tuning jobs queue.

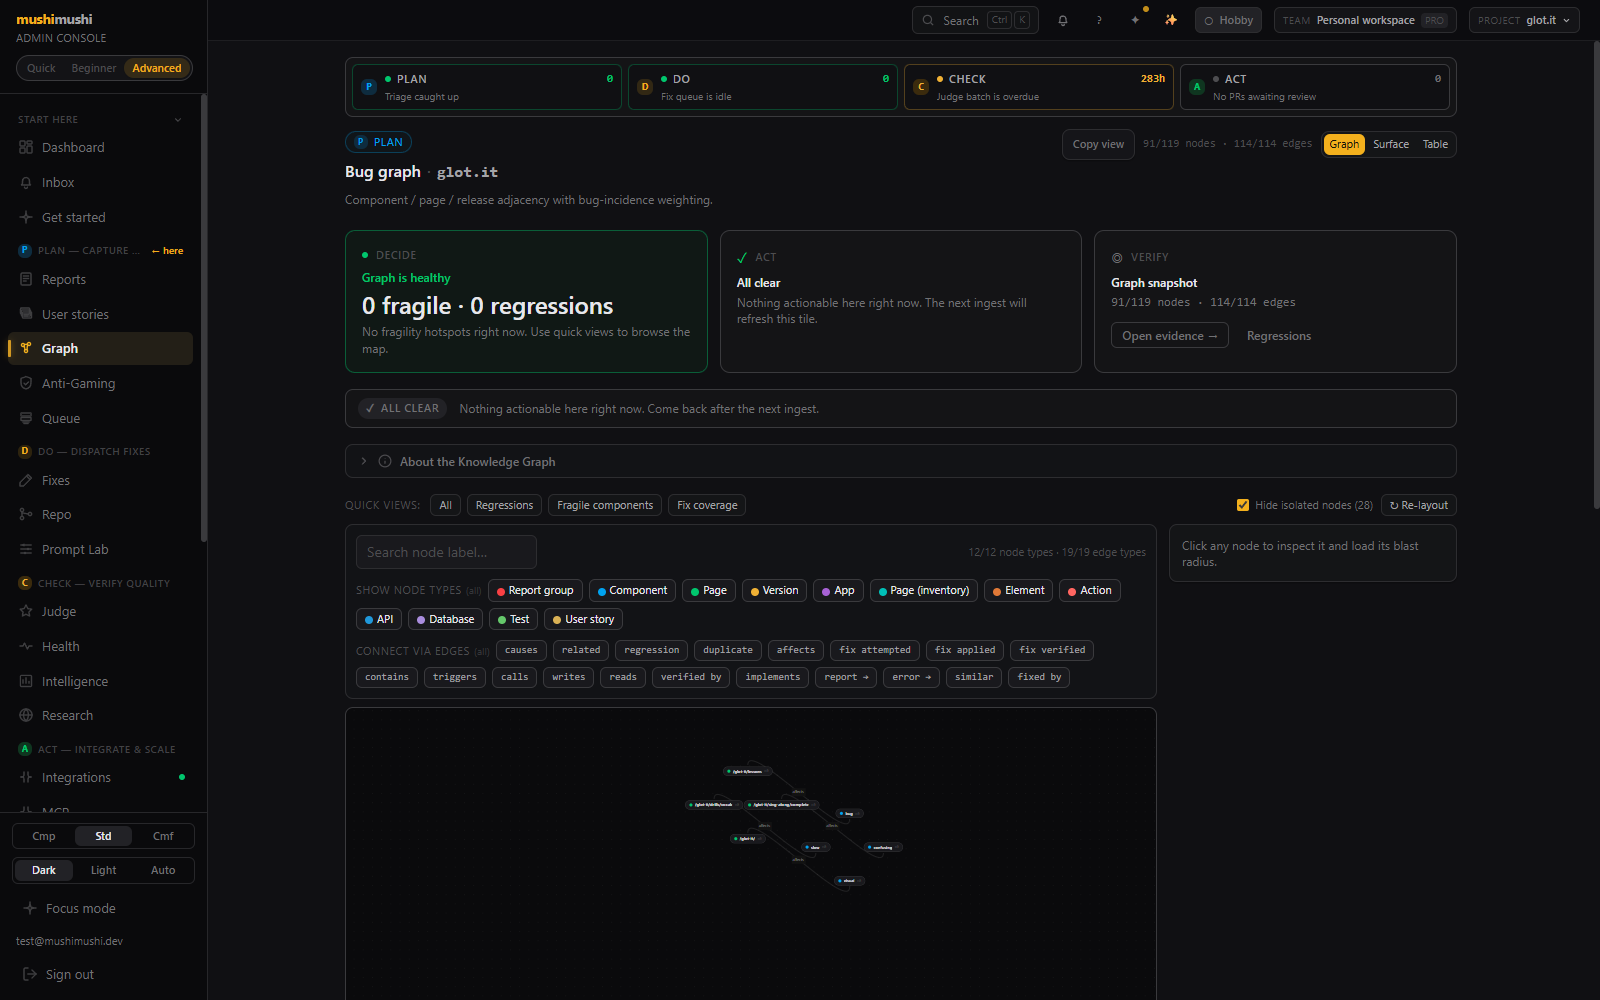
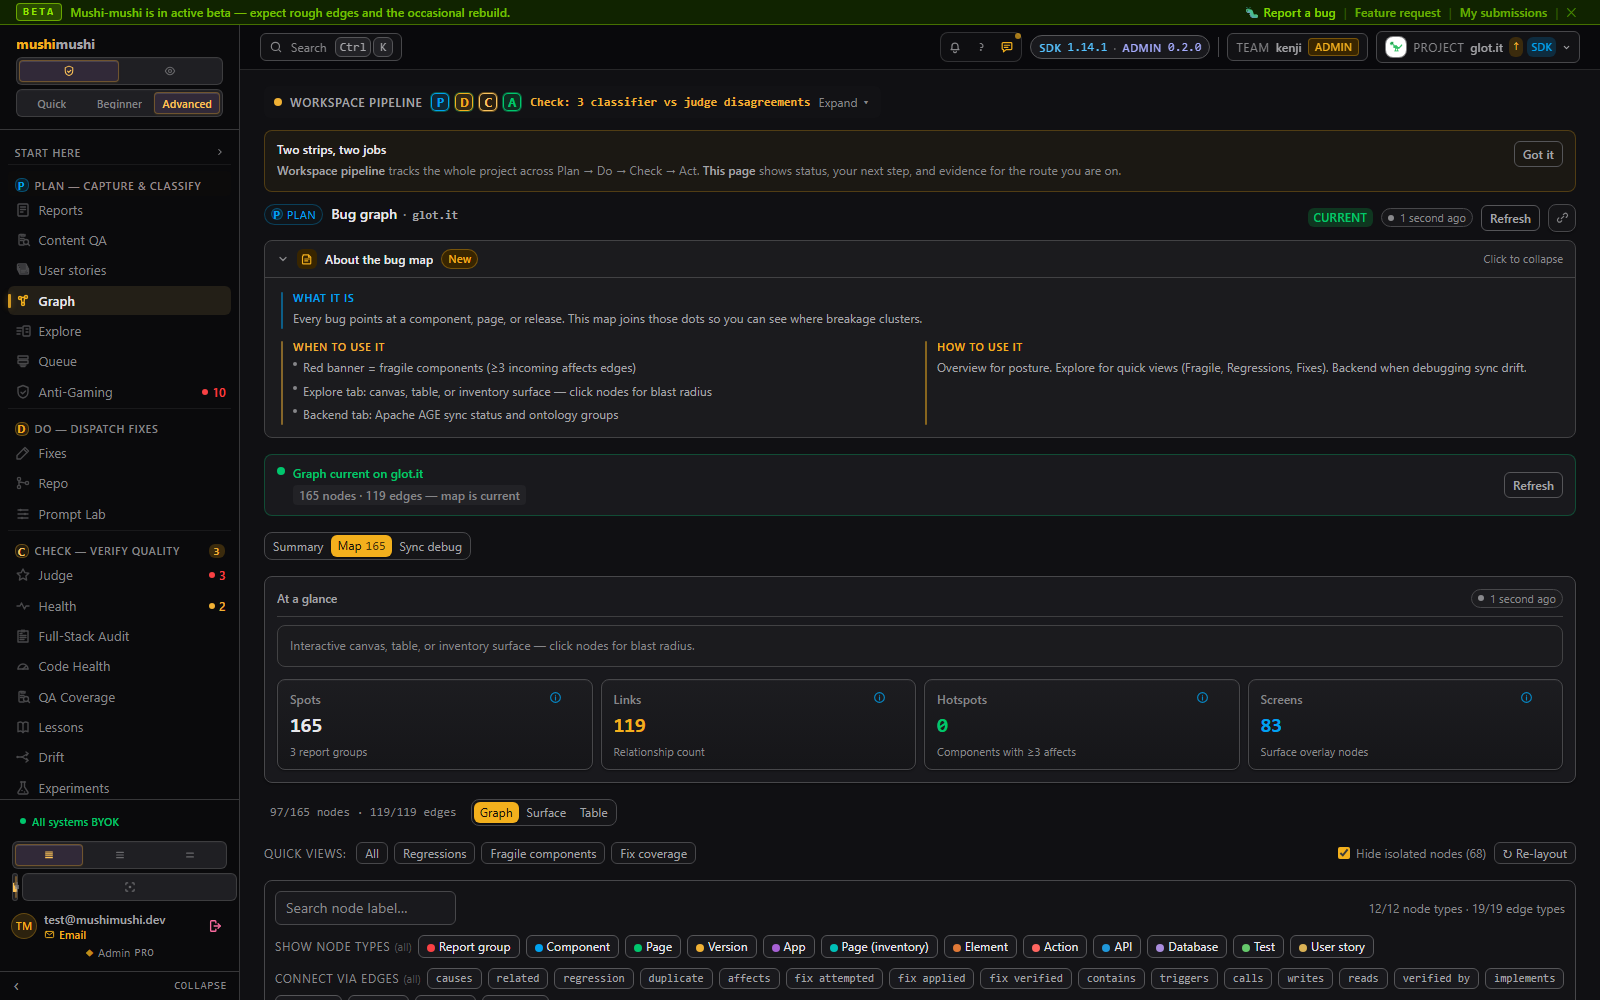
Knowledge graph — Bug graph view with PLAN/DO/CHECK/ACT pills along the top, quick-view filters (All / Regressions / Fragile components / Fix coverage), 12 node types and 19 edge types listed below the search, and Graph / Surface / Table tabs in the upper-right.

Knowledge graph (v2) · component / page / release adjacency weighted by bug incidence. Graph tab is the React Flow canvas; Surface overlays the positive inventory; Table is for grepping. Apache AGE backed when installed, falls back to plain SQL adjacency otherwise.

Graph in Surface mode — same canvas but the orange Surface pill is selected and the subtitle reads SURFACE - INVENTORY OVERLAY · 83/119 nodes · 110/114 edges. The node-type legend now includes Page (inventory), Element, Action, User story, App.

Graph · Surface mode (v2) · flips the same canvas to overlay inventory.yaml on the live knowledge graph. Pages, Elements, Actions, and User stories from the inventory render alongside the bug-incidence weights — the dead corners (unwired actions, regressed elements) light up against the working ones.

User stories · Inventory — the new v2 positive-side surface. Truth-layer hero across the top with three cards (Decide: stories/elements/actions tied to gates, Act: 25 actions still unknown or unwired, Verify: latest ingest snapshot). Below: per-story cards each with verified / regressed counts, action rows, and Run gates / Run crawler buttons.

User stories · Inventory (v2) · the headline new surface. Every user-facing action grouped under its story, with verified / unwired / regressed counts and one-click Run gates / Run crawler from the row. Ships with a YAML drop-zone, an SDK-driven Discovery feed, and an LLM proposer that writes the first inventory.yaml for you.

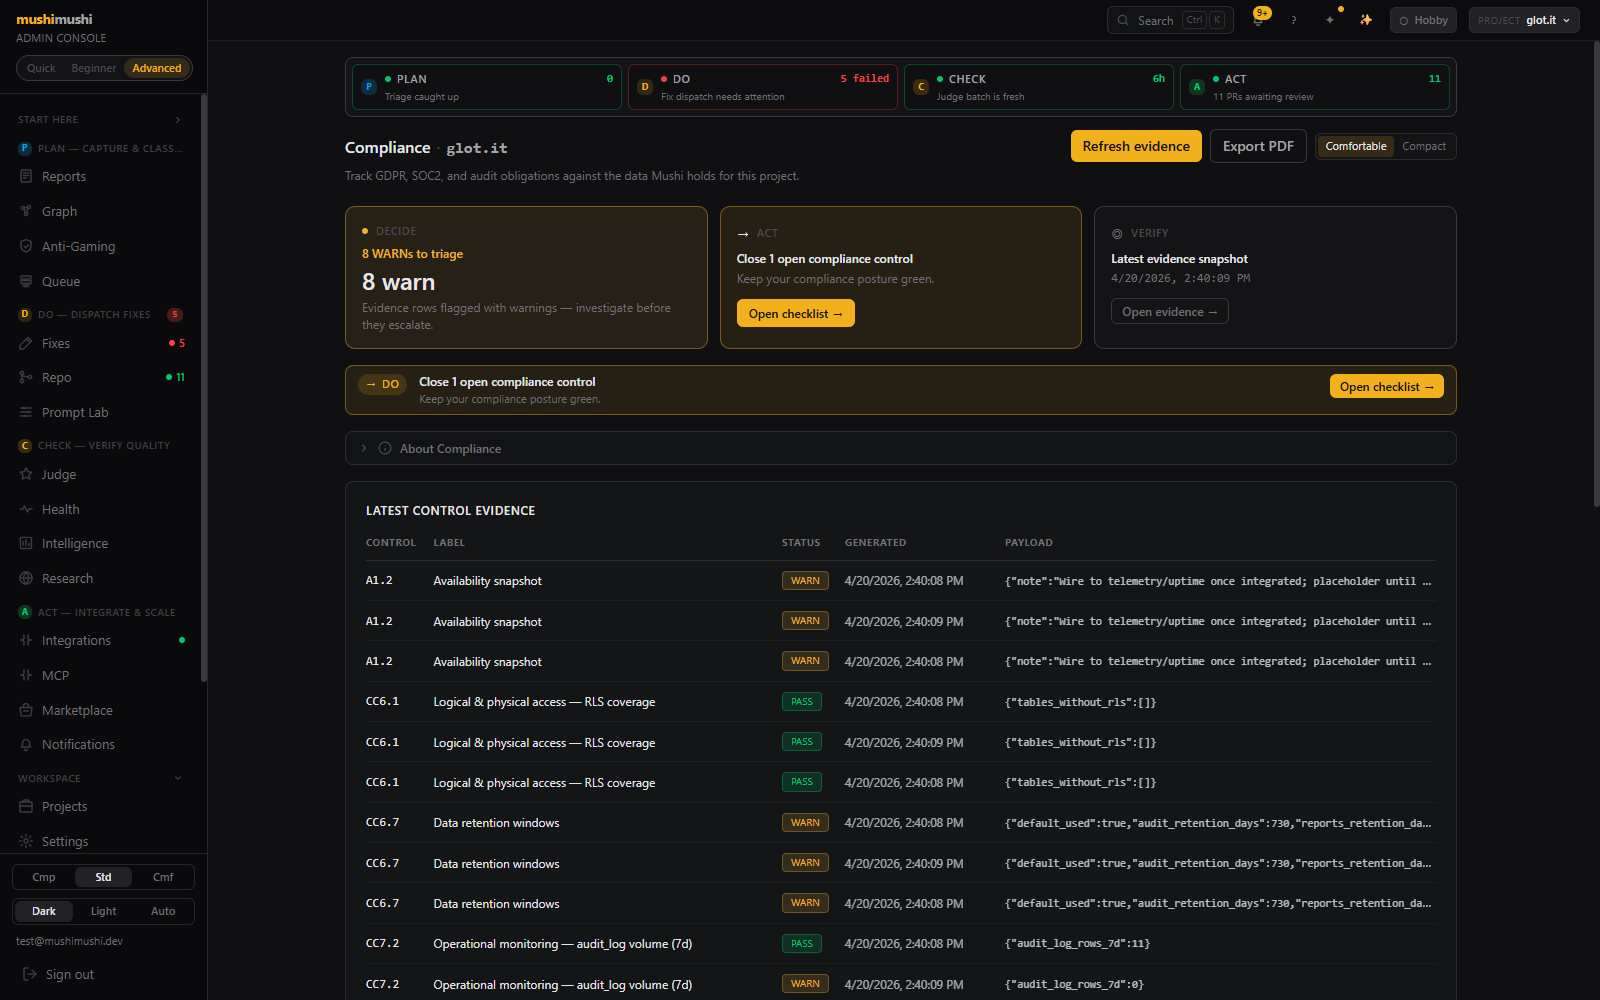
Compliance dashboard — Latest control evidence table with PASS / WARN pills, Data residency table.

Compliance · SOC 2 control evidence pack with PASS / WARN pills and inline JSON, region pinning per project, print-styled Export PDF, DSAR workflow tracking.

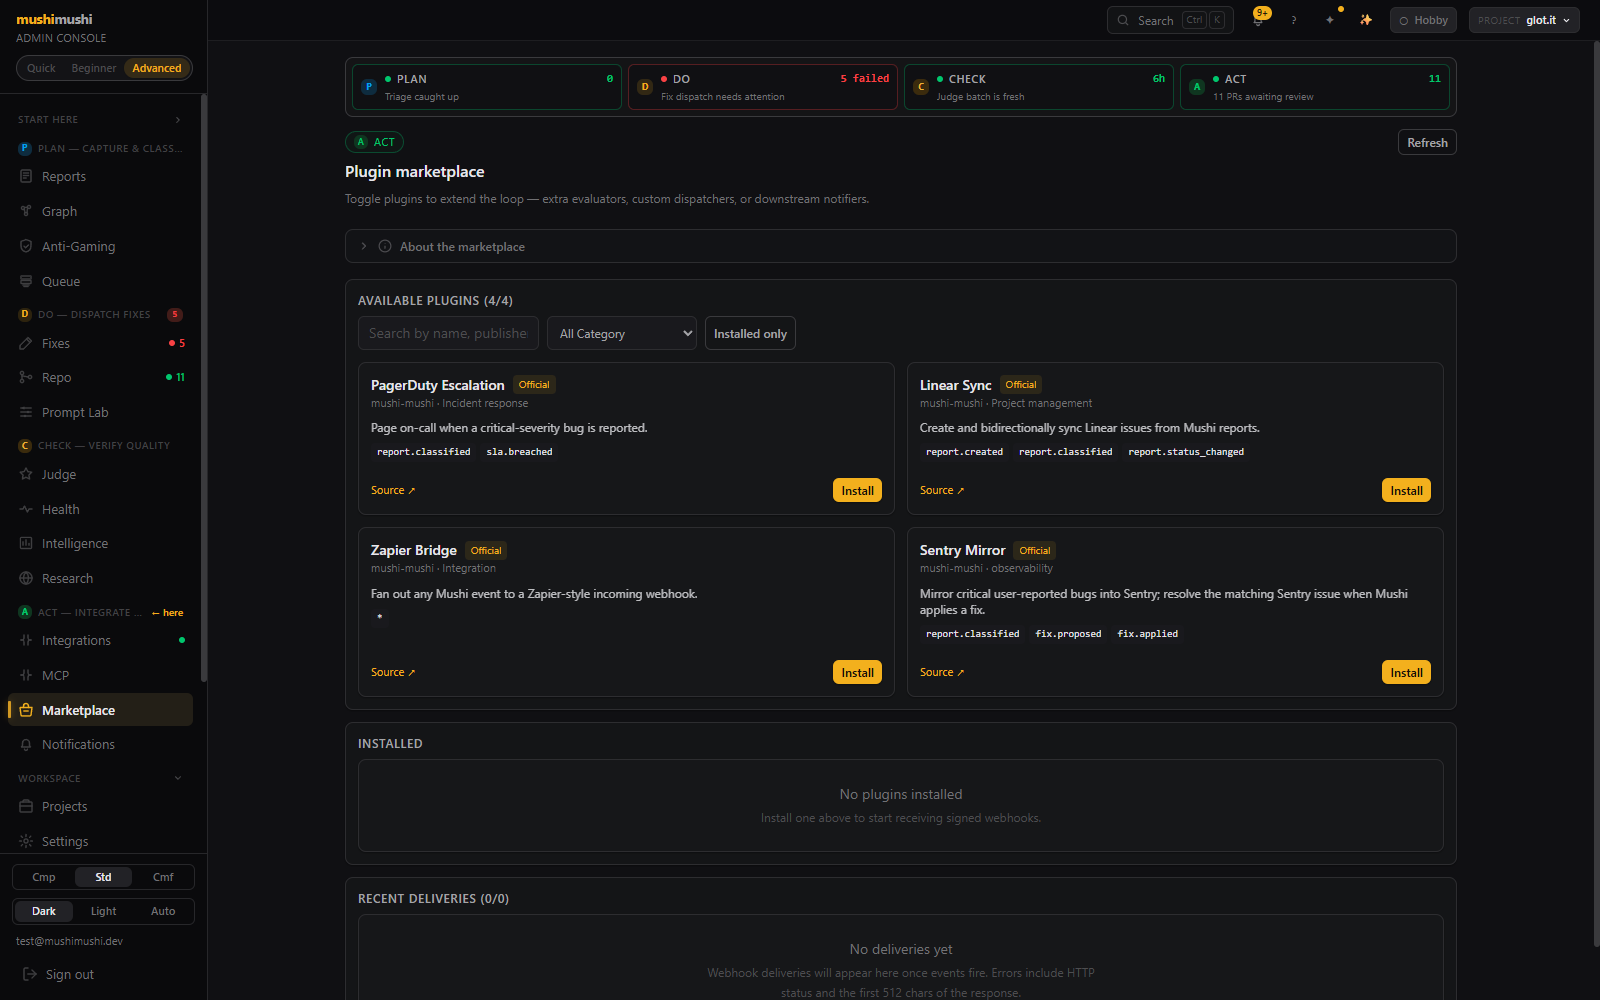
Plugin marketplace — Available plugins, Installed section, Recent deliveries.

Marketplace · toggleable extension layer for the loop. Each plugin declares the events it subscribes to and ships with HMAC-signed webhooks.

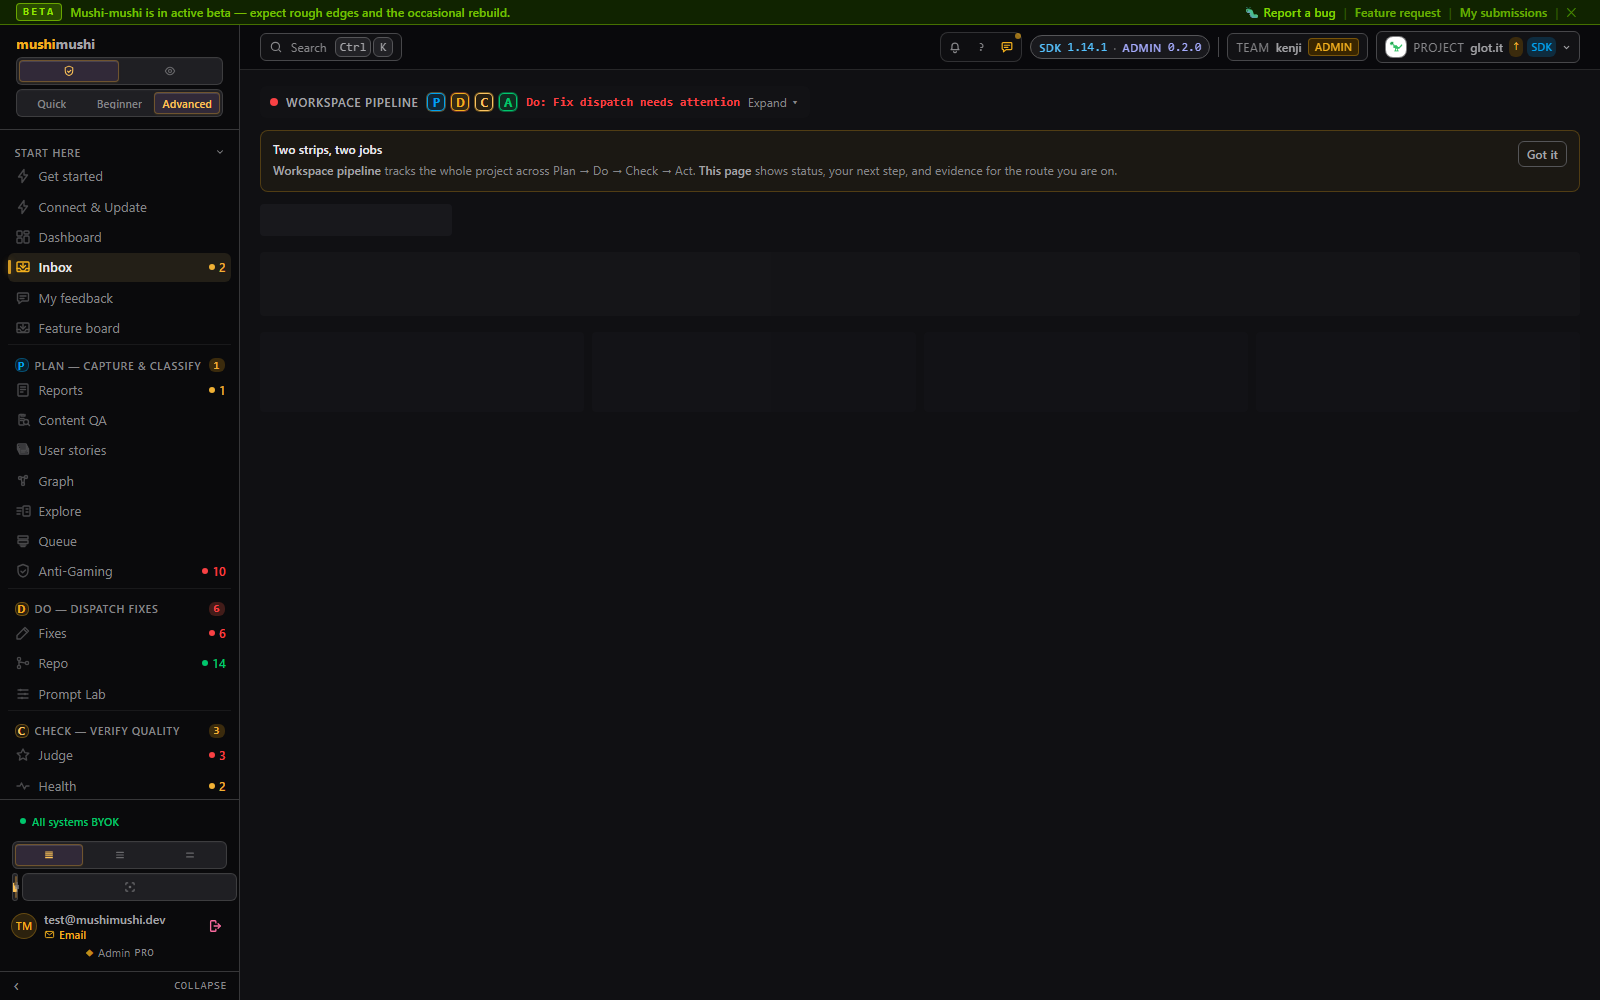
Action inbox grouped by PDCA stage — KPI strip, sections per stage with one CTA per group.

Action inbox · open actions across the PDCA loop, grouped by stage with one CTA per group. Empty groups skip — the page only renders what's actually waiting on you.

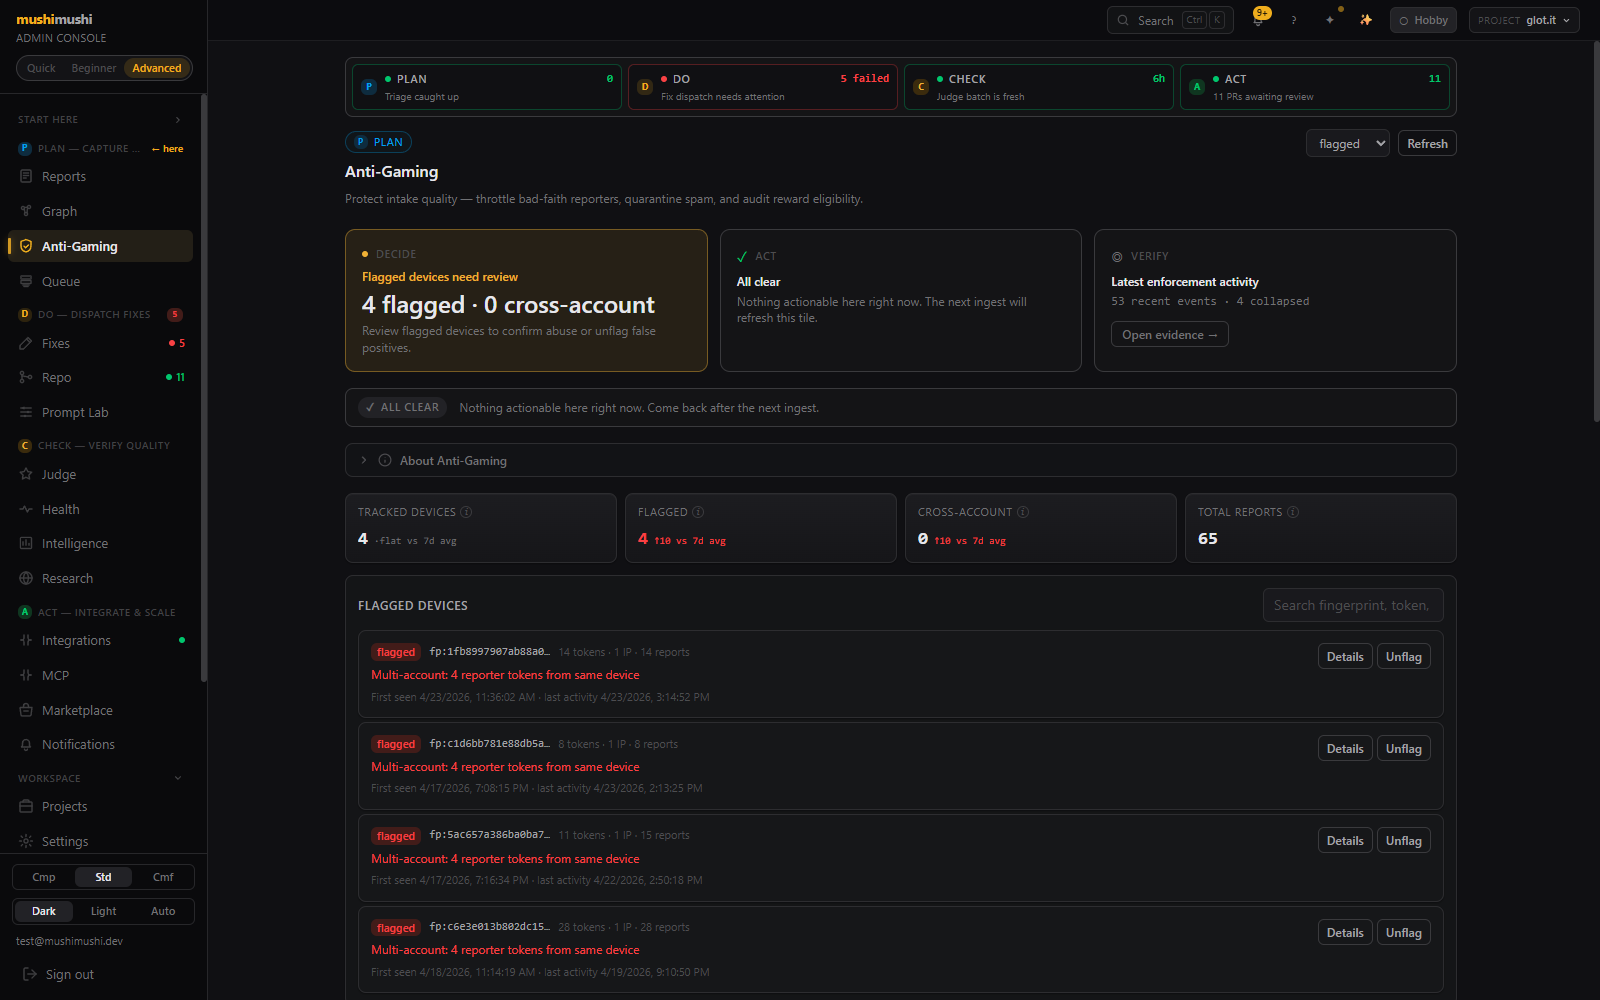
Anti-gaming dashboard — Decide/Act/Verify hero, KPI strip, Flagged devices table.

Anti-gaming · per-device fingerprint tracker that throttles bad-faith reporters and surfaces multi-account abuse. Every enforcement action lands in the audit trail.

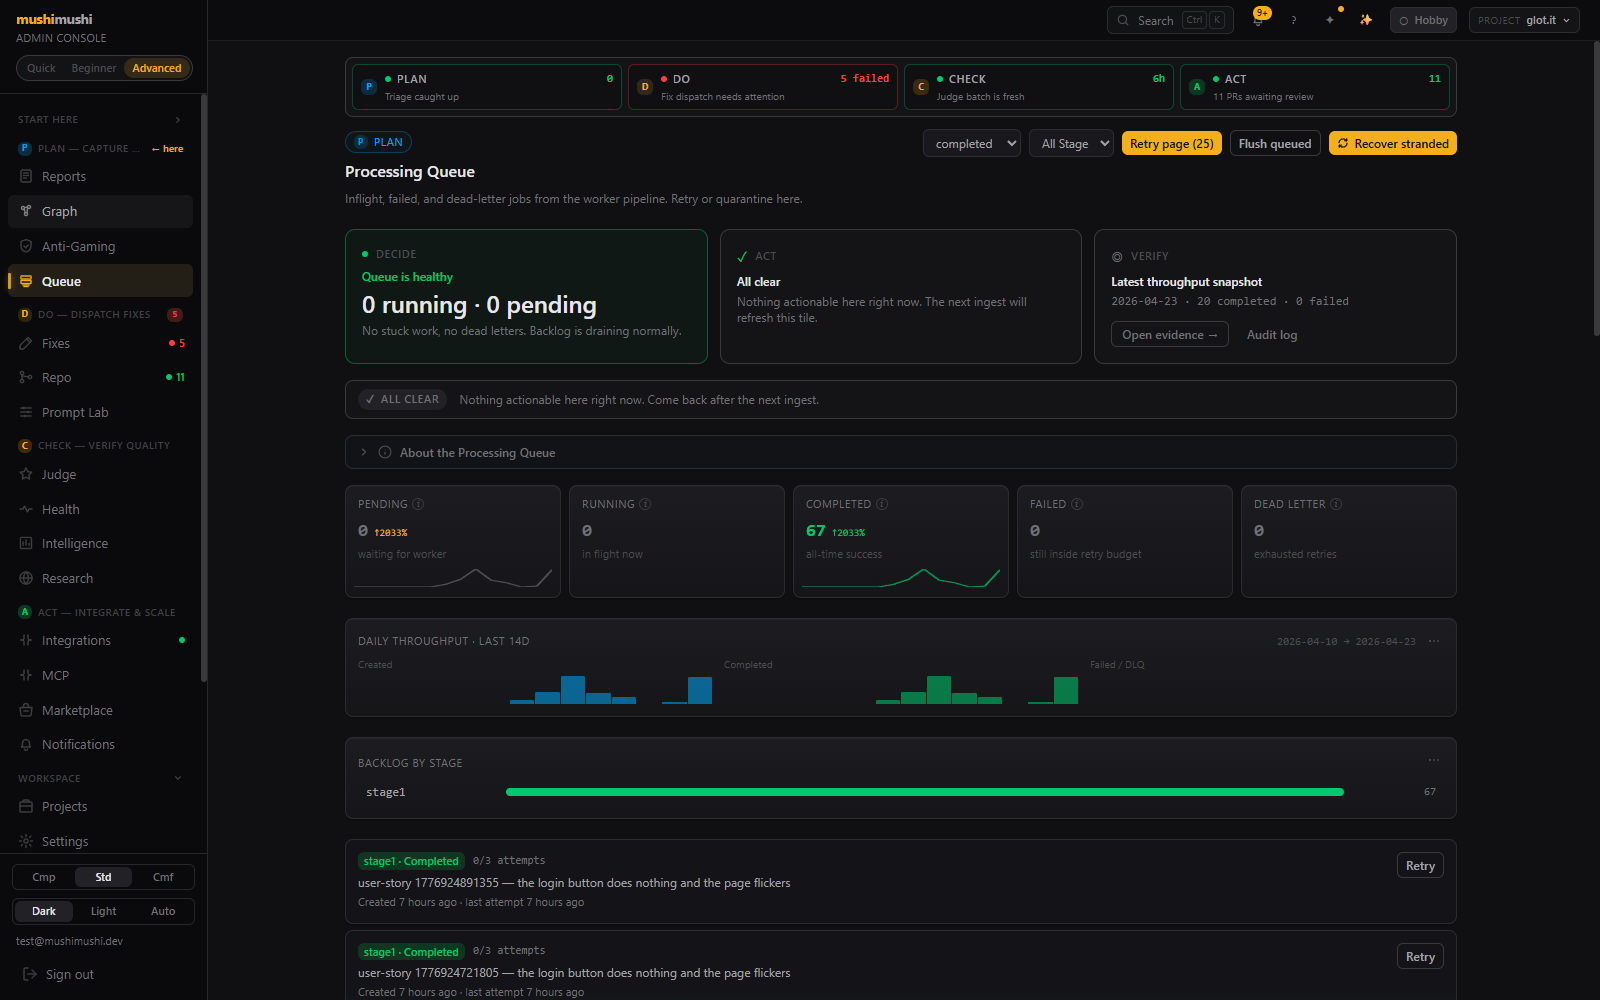
Processing queue (DLQ) — Decide/Act/Verify hero, KPI cards, 14d daily throughput histogram, per-stage backlog bar.

Processing queue (DLQ) · worker_jobs viewer with 14d throughput histogram, per-stage backlog bar, and per-job Retry action.

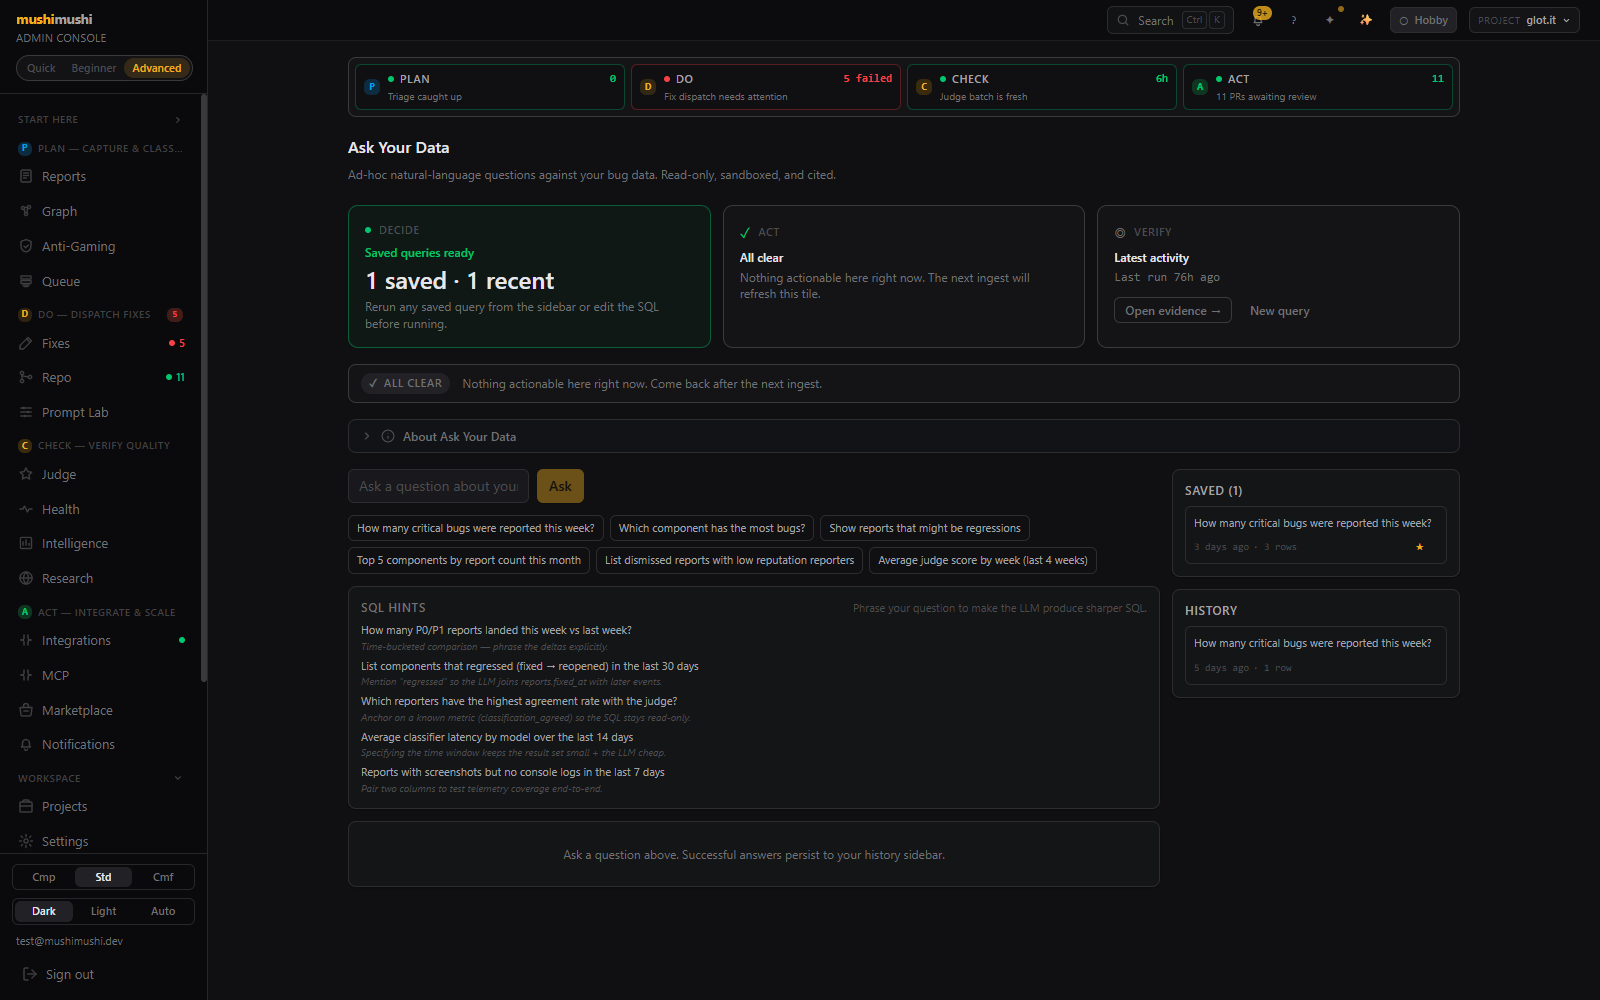
Ask Your Data — natural-language SQL, quick-prompt chips, SQL HINTS panel, Saved queries + History sidebar.

Ask Your Data · ad-hoc natural-language SQL over the bug data — read-only Postgres, pre-canned chip prompts, Saved queries + History sidebar.

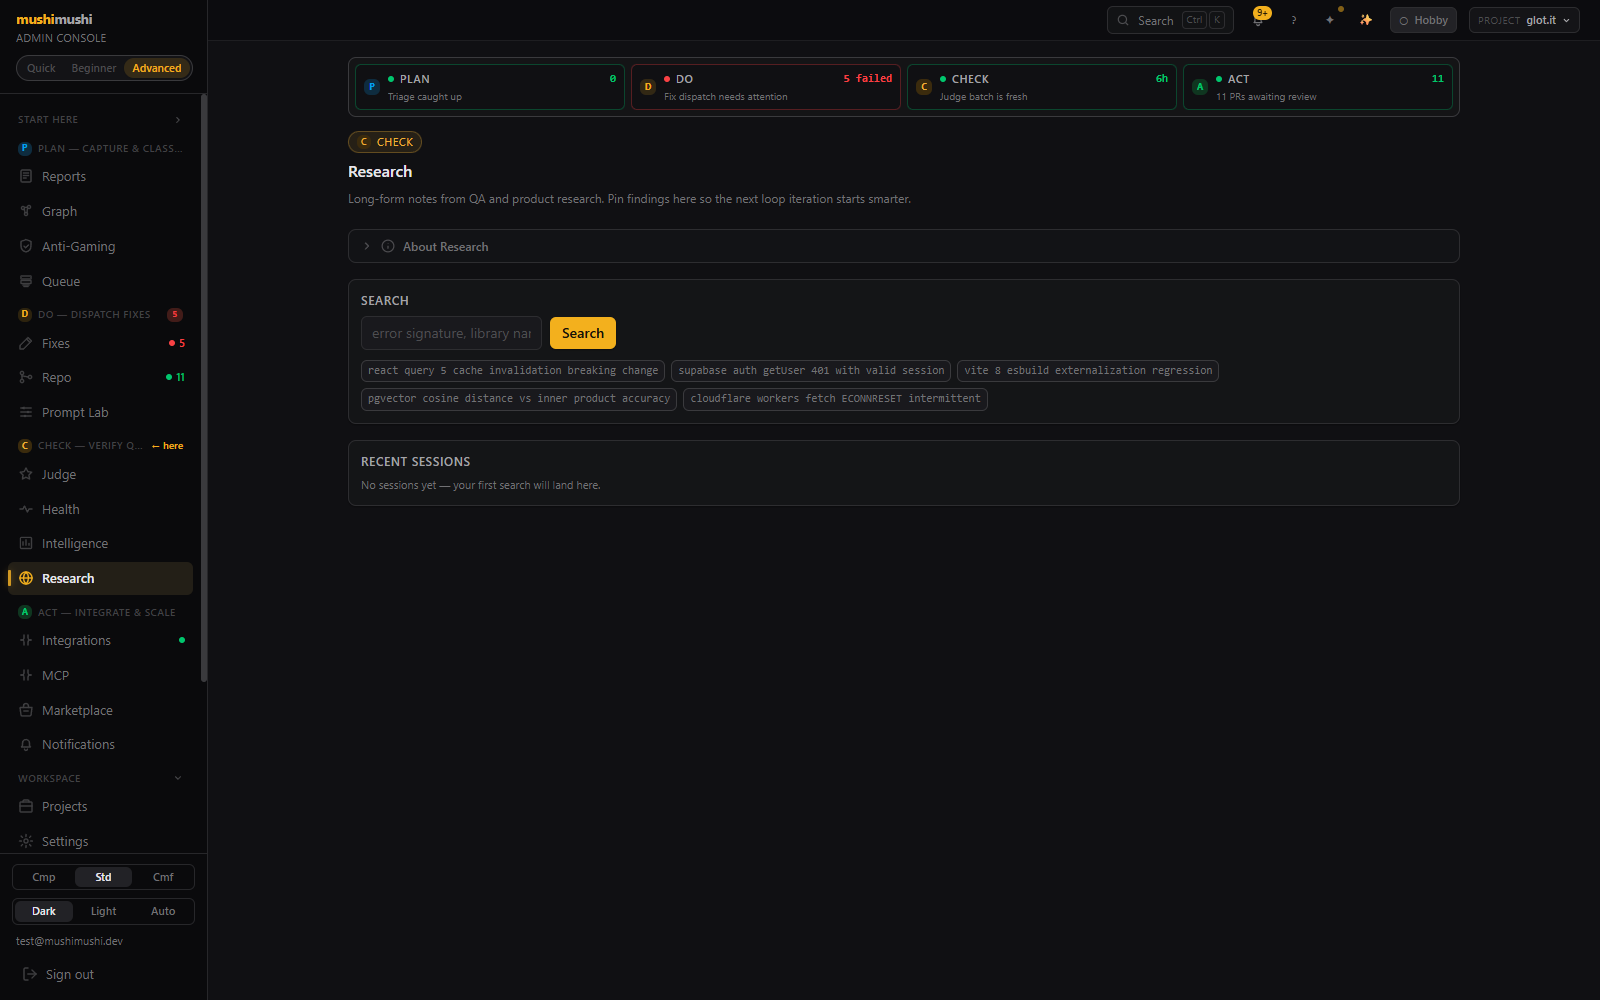
Research notes page — long-form notes from QA and product research, search section with chip topics.

Research · pin QA + product findings here so the next loop iteration starts smarter.

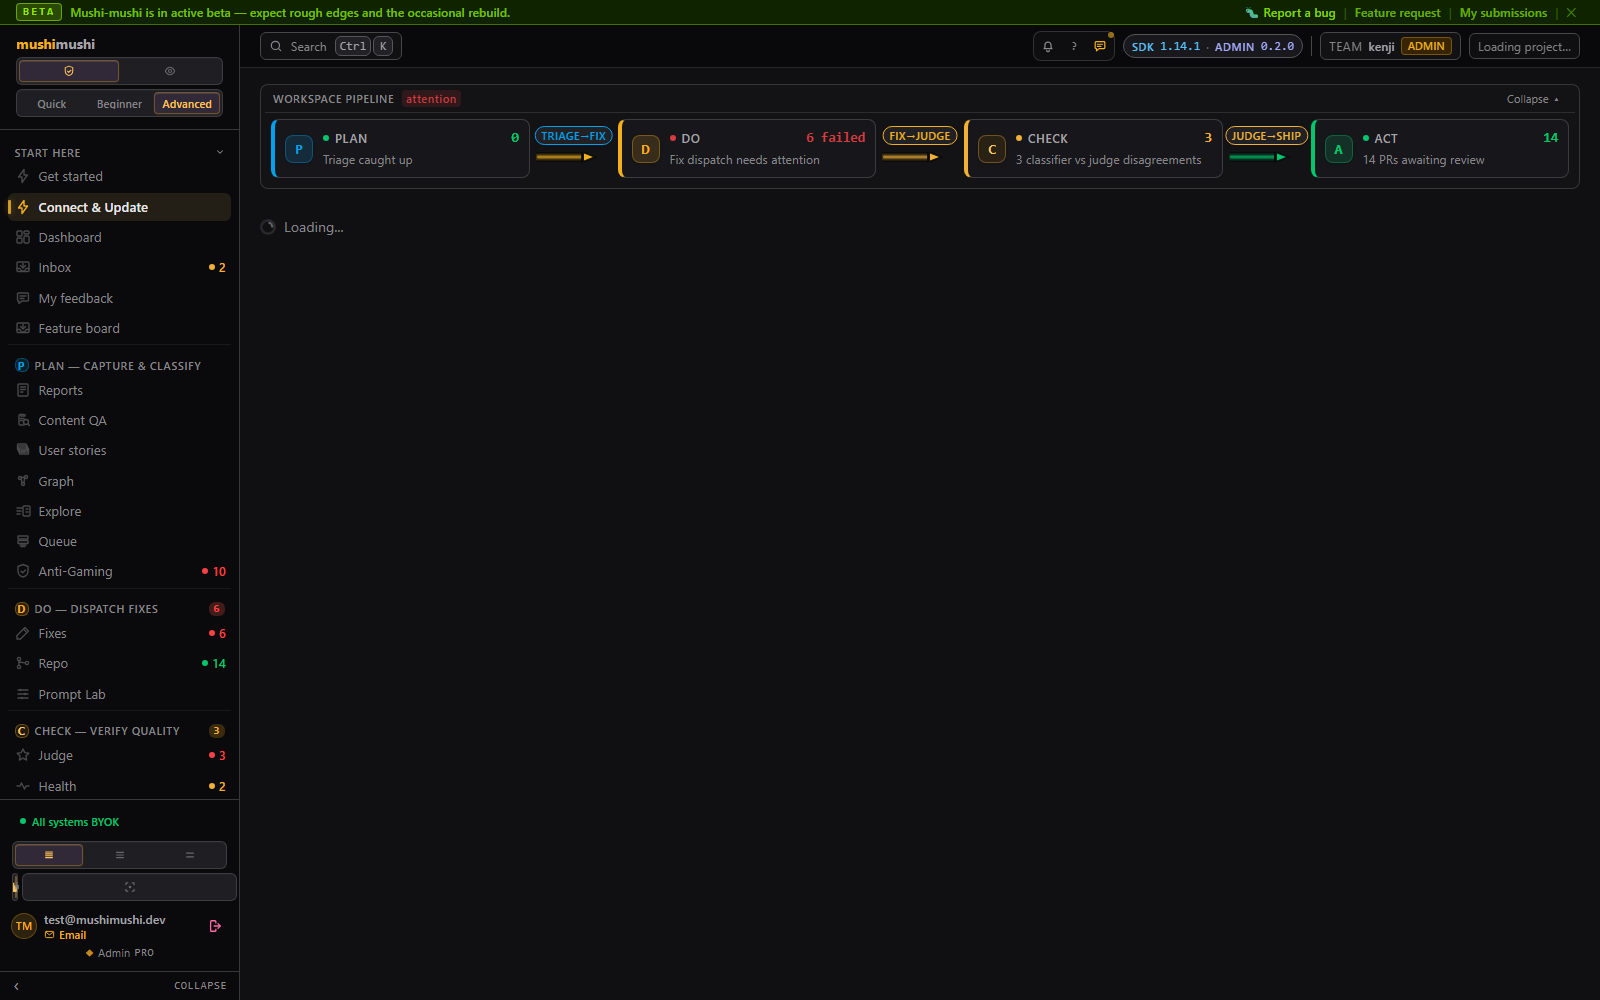
Connect & Update — GitHub status, SDK install card with framework tabs and live banner preview, MCP Add to Cursor, CLI copy, Create Upgrade PR.

Connect & Update · June 2026 hub — GitHub link, SDK snippet, MCP deeplinks, CLI install, and semver-only upgrade PRs via sdk-upgrade-worker

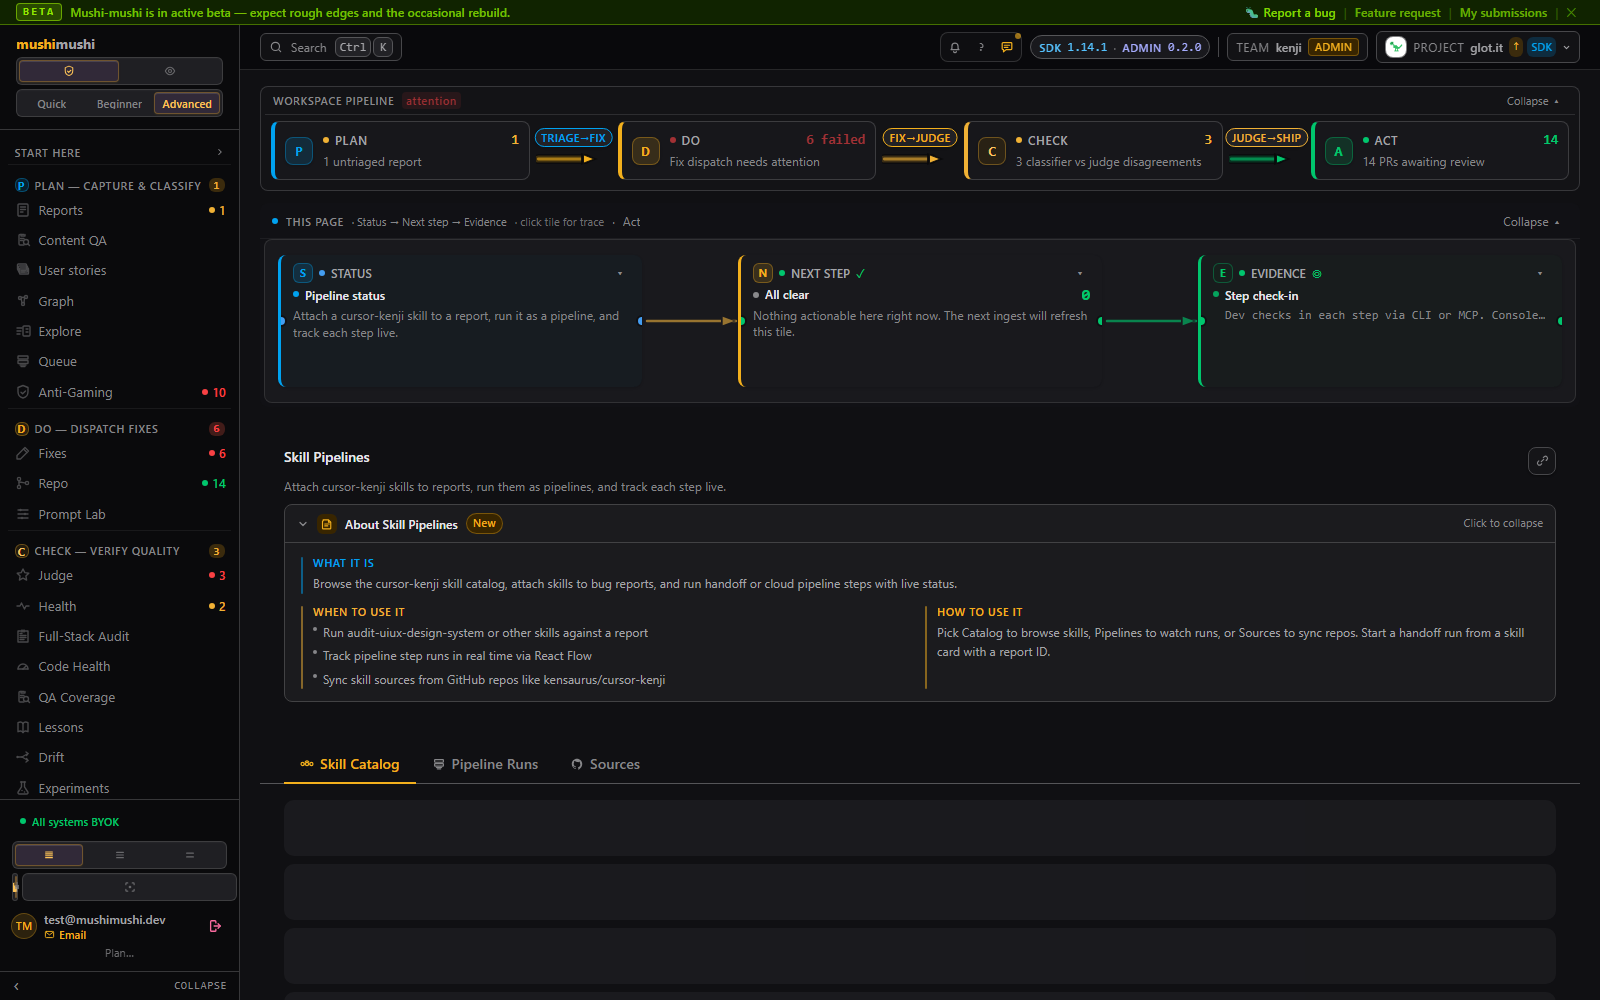
Skill Pipelines — 85-skill catalog from cursor-kenji, workflow bundles, pipeline runs tab.

Skill Pipelines · skills.sh-compatible catalog synced daily; attach a skill chain to a report and stream step status over Realtime — handoff or Cursor Cloud mode

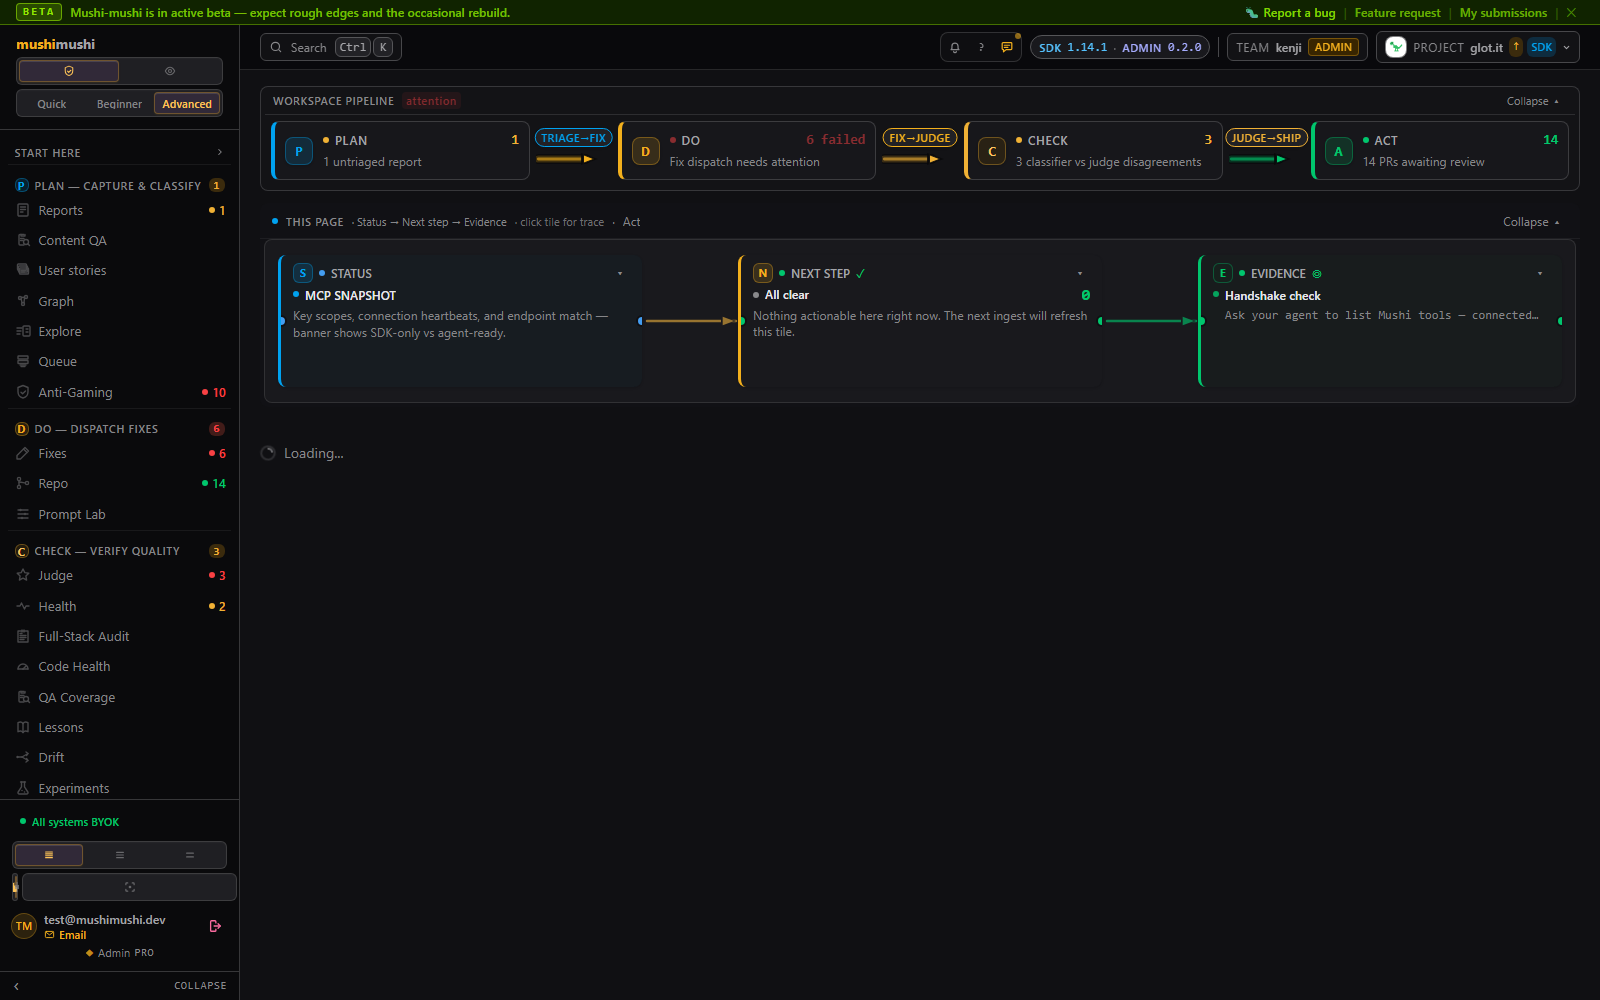
MCP — Model Context Protocol page with Add to Cursor deeplink, feature-group selector, and 76-tool catalog synced from packages/mcp/src/catalog.ts.

MCP — Model Context Protocol · lean default (triage,fixes,inventory,setup,docs), one-click Cursor deeplink, hosted Streamable HTTP at /functions/v1/mcp, catalog parity guarded by pnpm check:catalog-sync. The same install block also lives on Connect & Update.

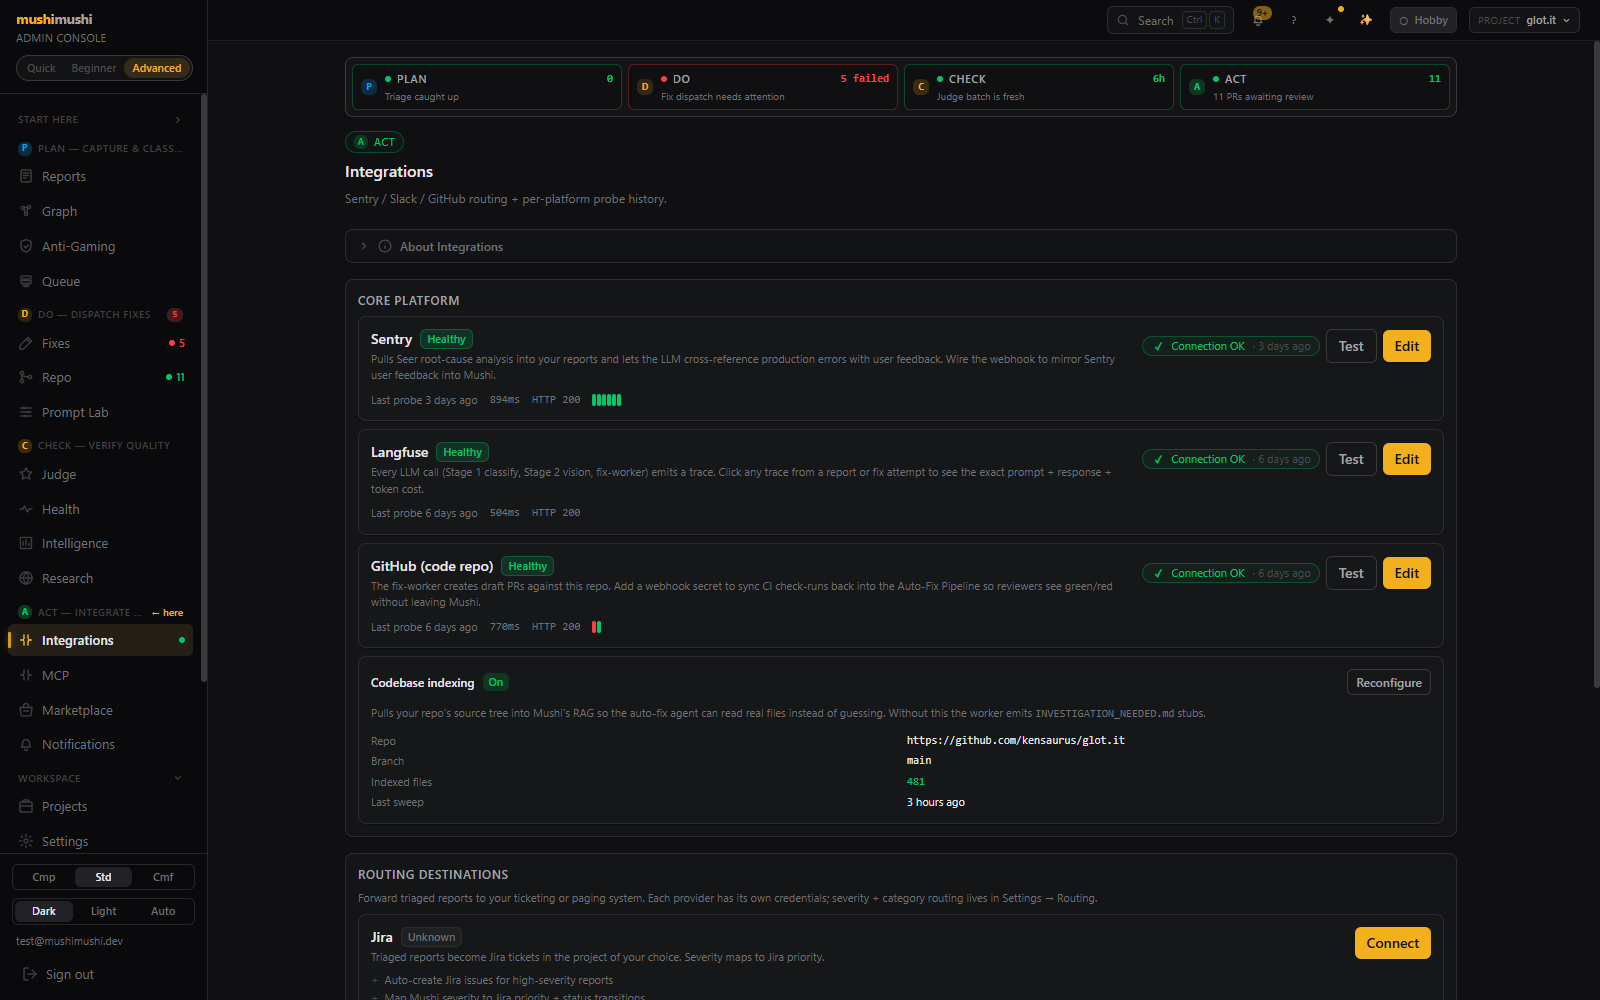
Integrations page — Sentry / Langfuse / GitHub health-checked probes, Codebase indexing card, ROUTING DESTINATIONS.

Integrations · Sentry / Langfuse / GitHub health-checked probes with last-probe latency + HTTP code + sparkline, codebase indexing status, routing-destination CRUD.

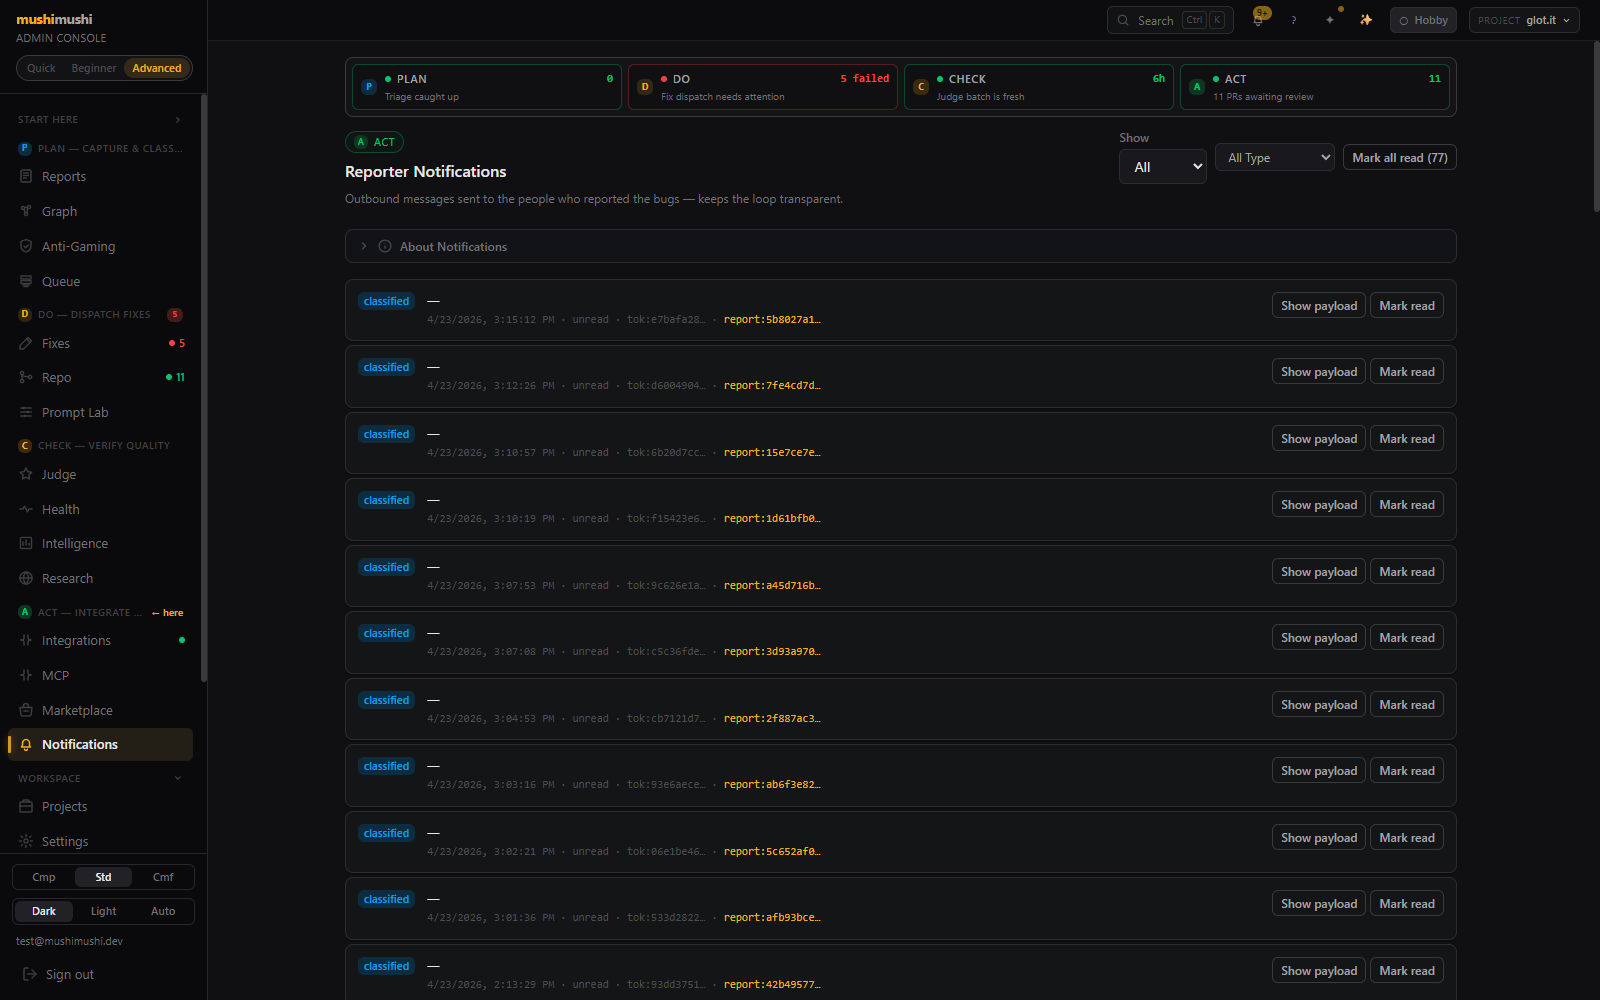
Reporter Notifications page — outbound messages sent to bug reporters, table with timestamp, type, and per-row actions.

Reporter notifications · outbound messages sent to the people who reported each bug. Show payload reveals the exact JSON the SDK delivered.

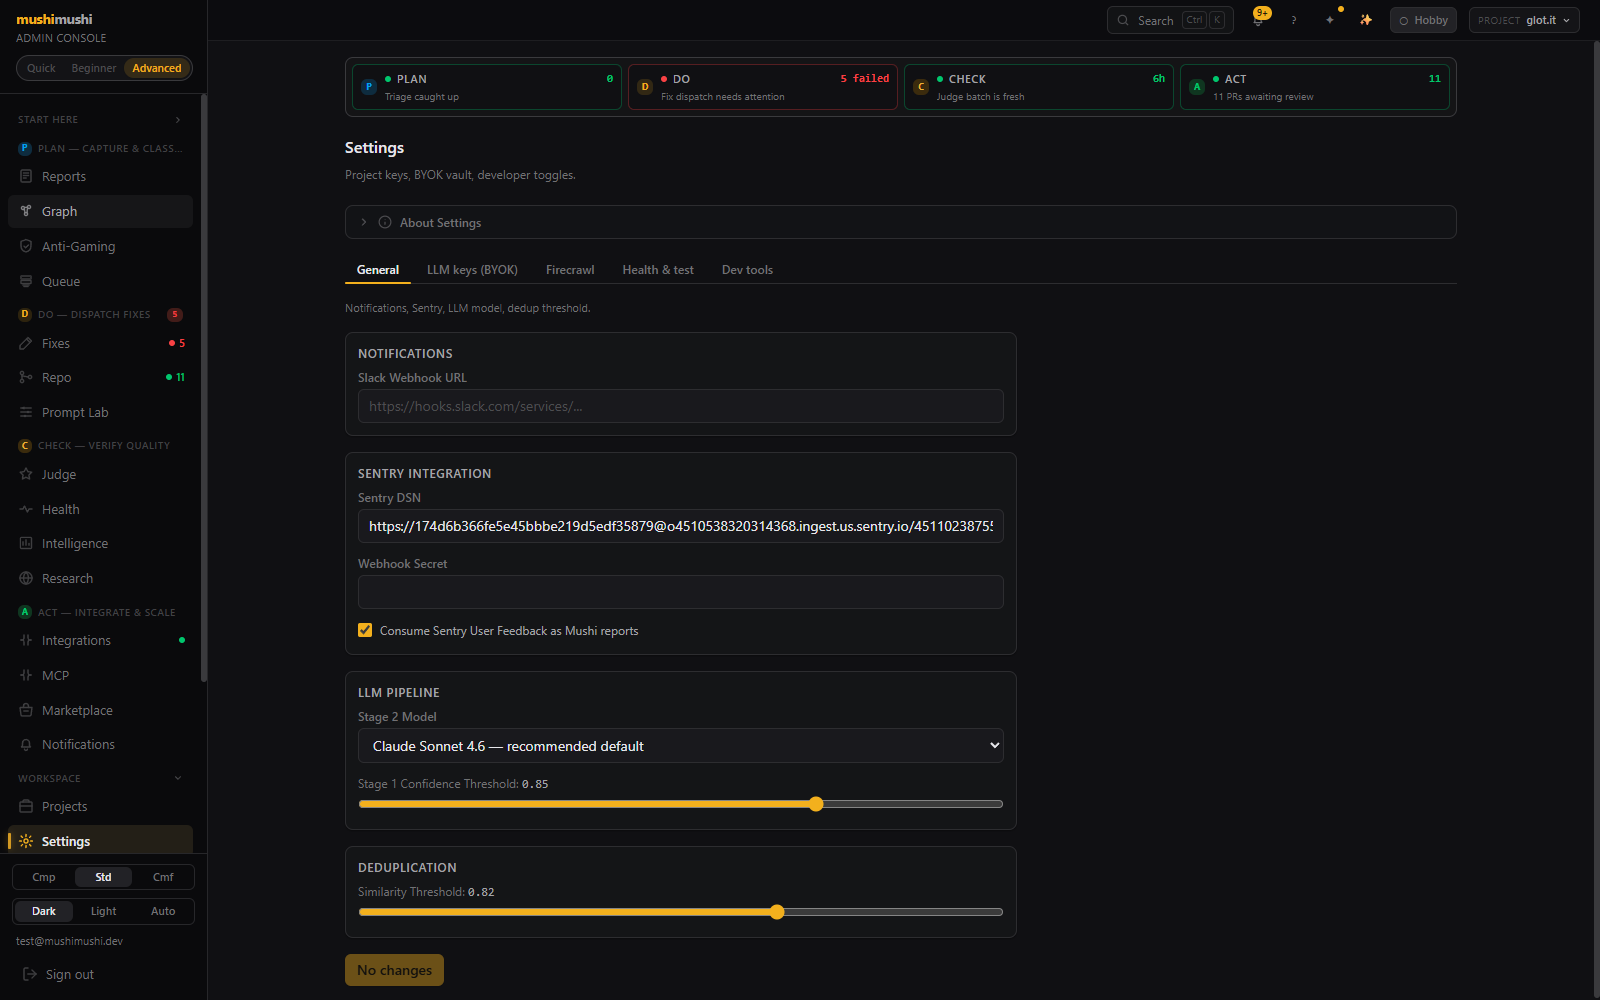
Settings page — 5-tab nav, NOTIFICATIONS card, SENTRY INTEGRATION card, LLM PIPELINE card, DEDUPLICATION card.

Workspace settings · 5 tabs covering Slack webhook, Sentry DSN, Stage-2 model picker, Stage-1 confidence threshold, dedup similarity threshold.

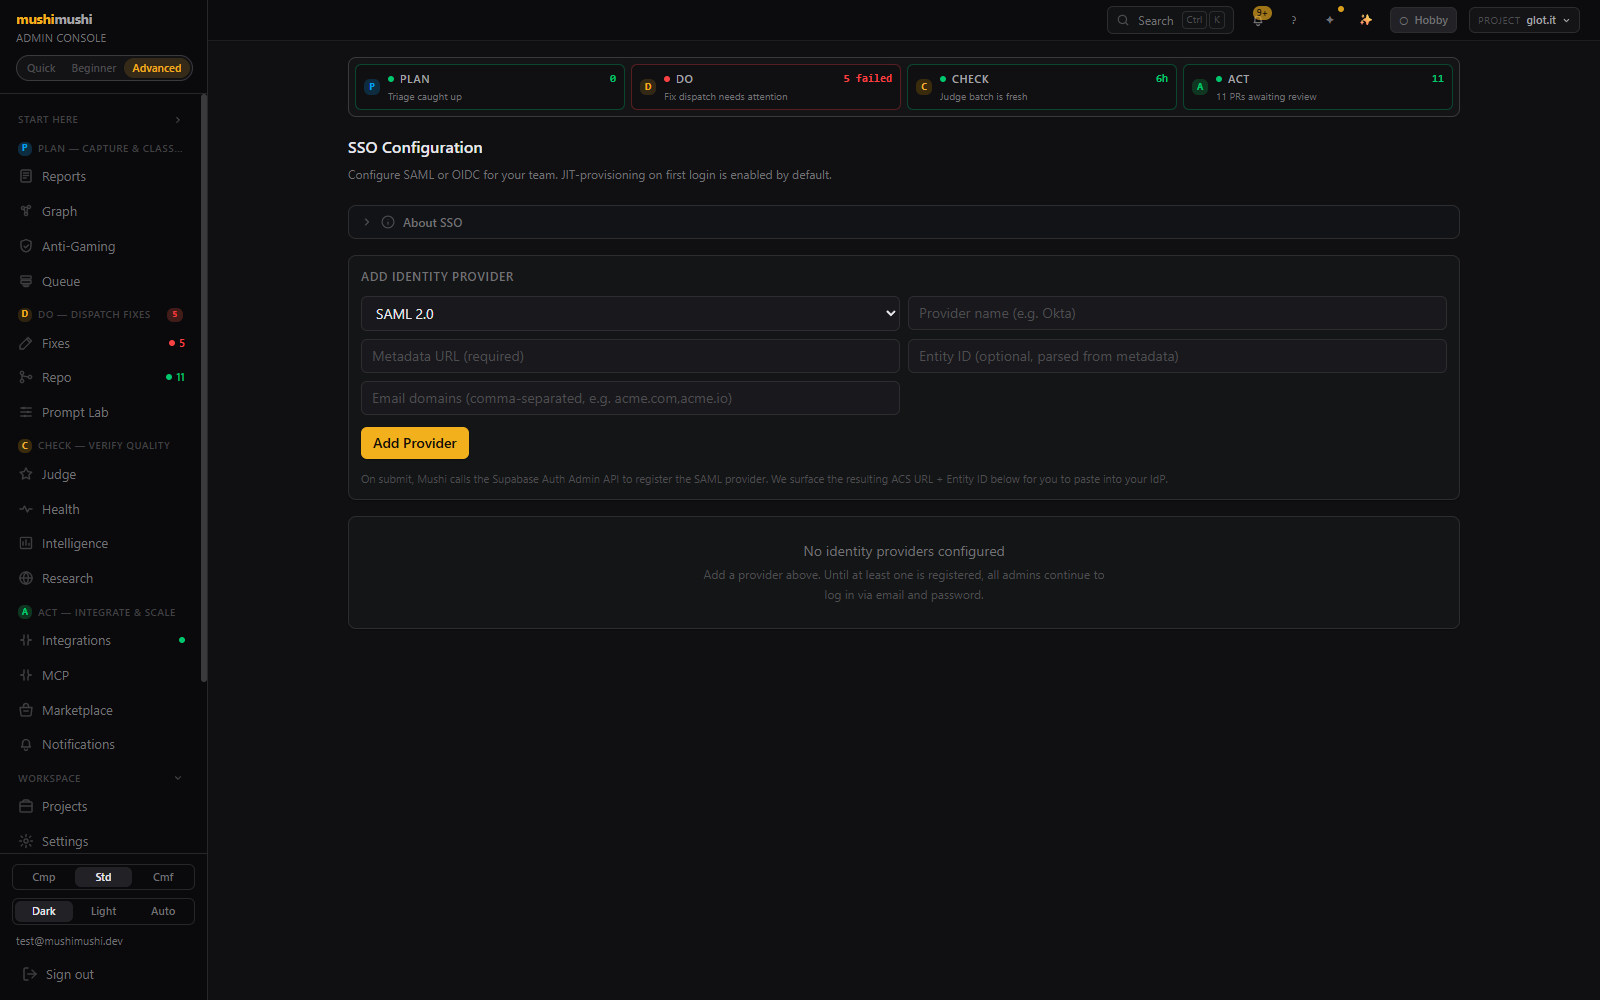
SSO Configuration page — SAML 2.0 + OIDC form, ADD IDENTITY PROVIDER card.

SSO config · SAML 2.0 + OIDC form, calls the Supabase Auth Admin API on submit, surfaces the resulting ACS URL + Entity ID for IdP setup. JIT provisioning on first login is the default.

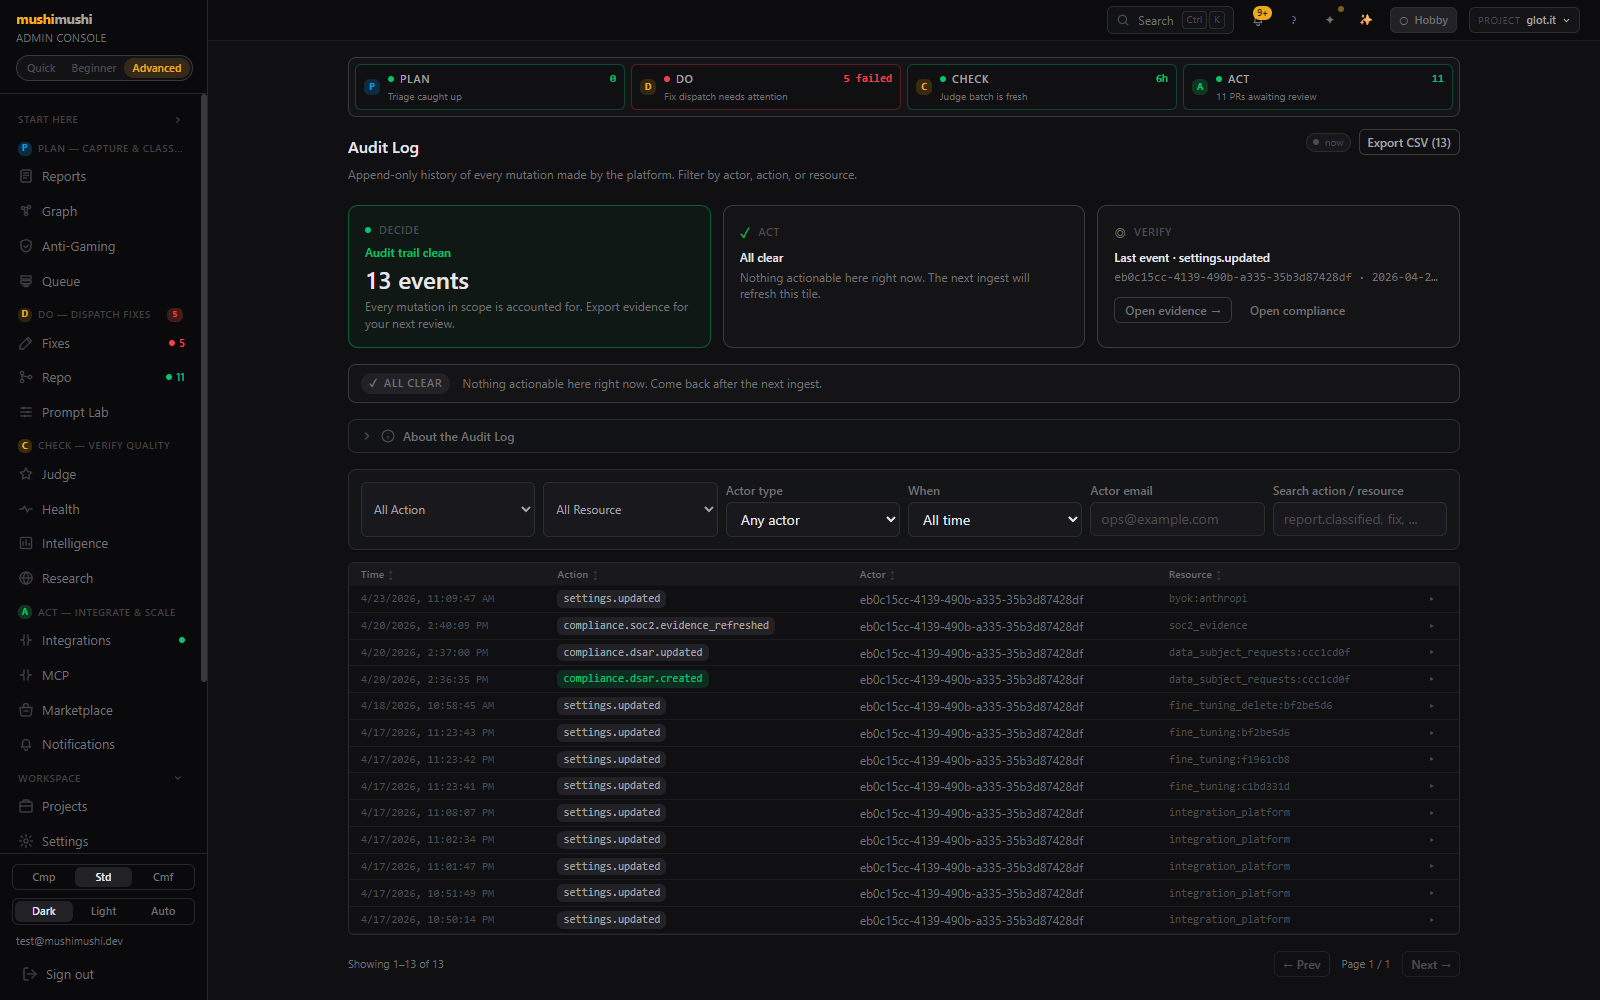
Audit Log page — Decide/Act/Verify hero, filter row, table with Time / Action / Actor / Resource columns.

Audit log · append-only history of every mutation, filterable by actor / action / resource / time. Export CSV for the next SOC 2 review.

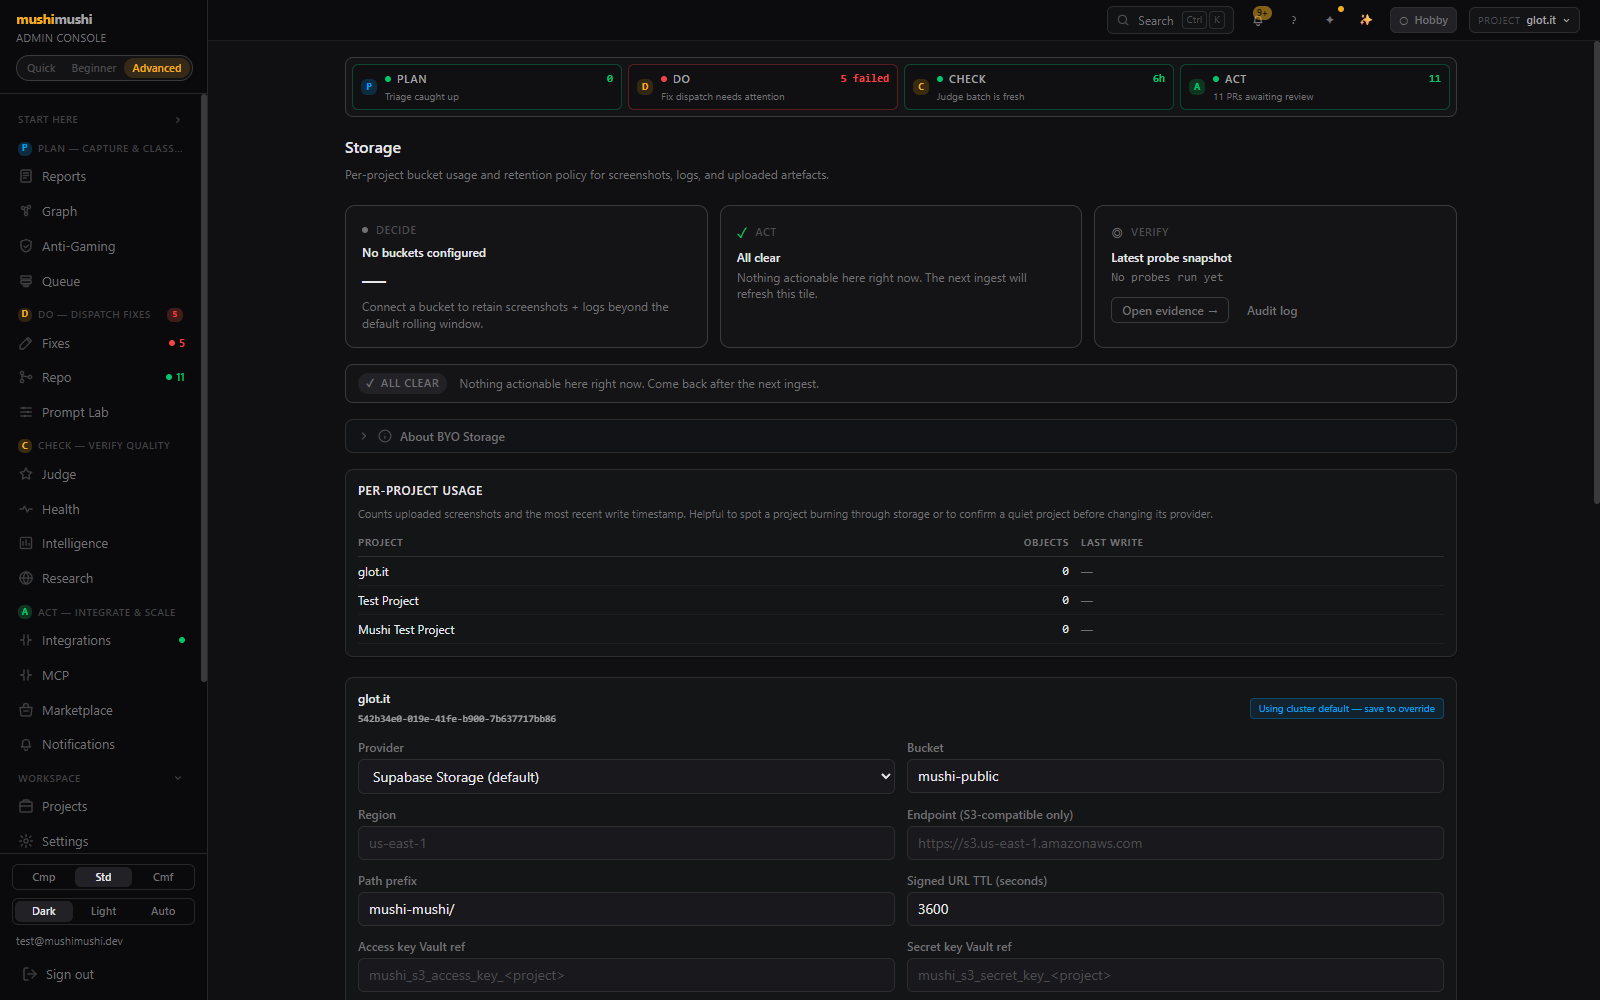
Storage page — Decide/Act/Verify hero, PER-PROJECT USAGE table, per-project bucket form.

BYO storage · per-project bucket form (Supabase / S3 / R2), region pinning, presigned-URL TTL editor, vault-ref'd access keys (never plaintext).

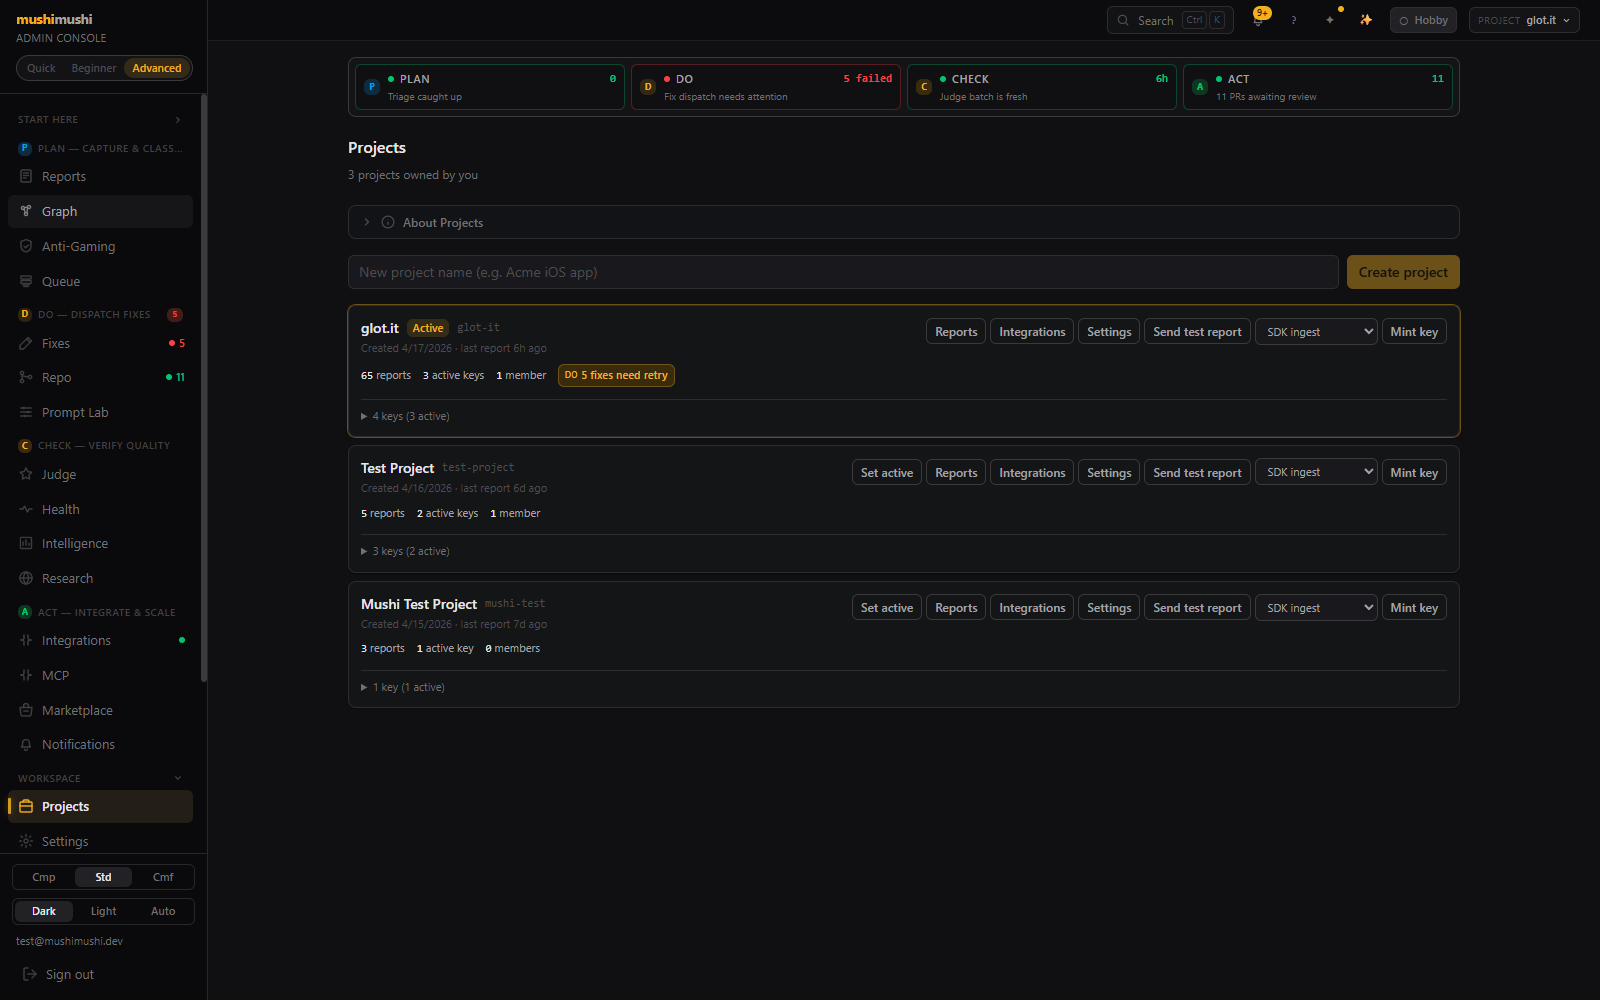
Projects page — 3 per-project cards with Active pill, slug, last report timestamp, key/report/member counts.

Multi-project workspace · per-project cards with active-key count, reports count, member count, plus inline CTAs to mint a fresh key, send a test report, or open project-scoped Integrations / Settings.

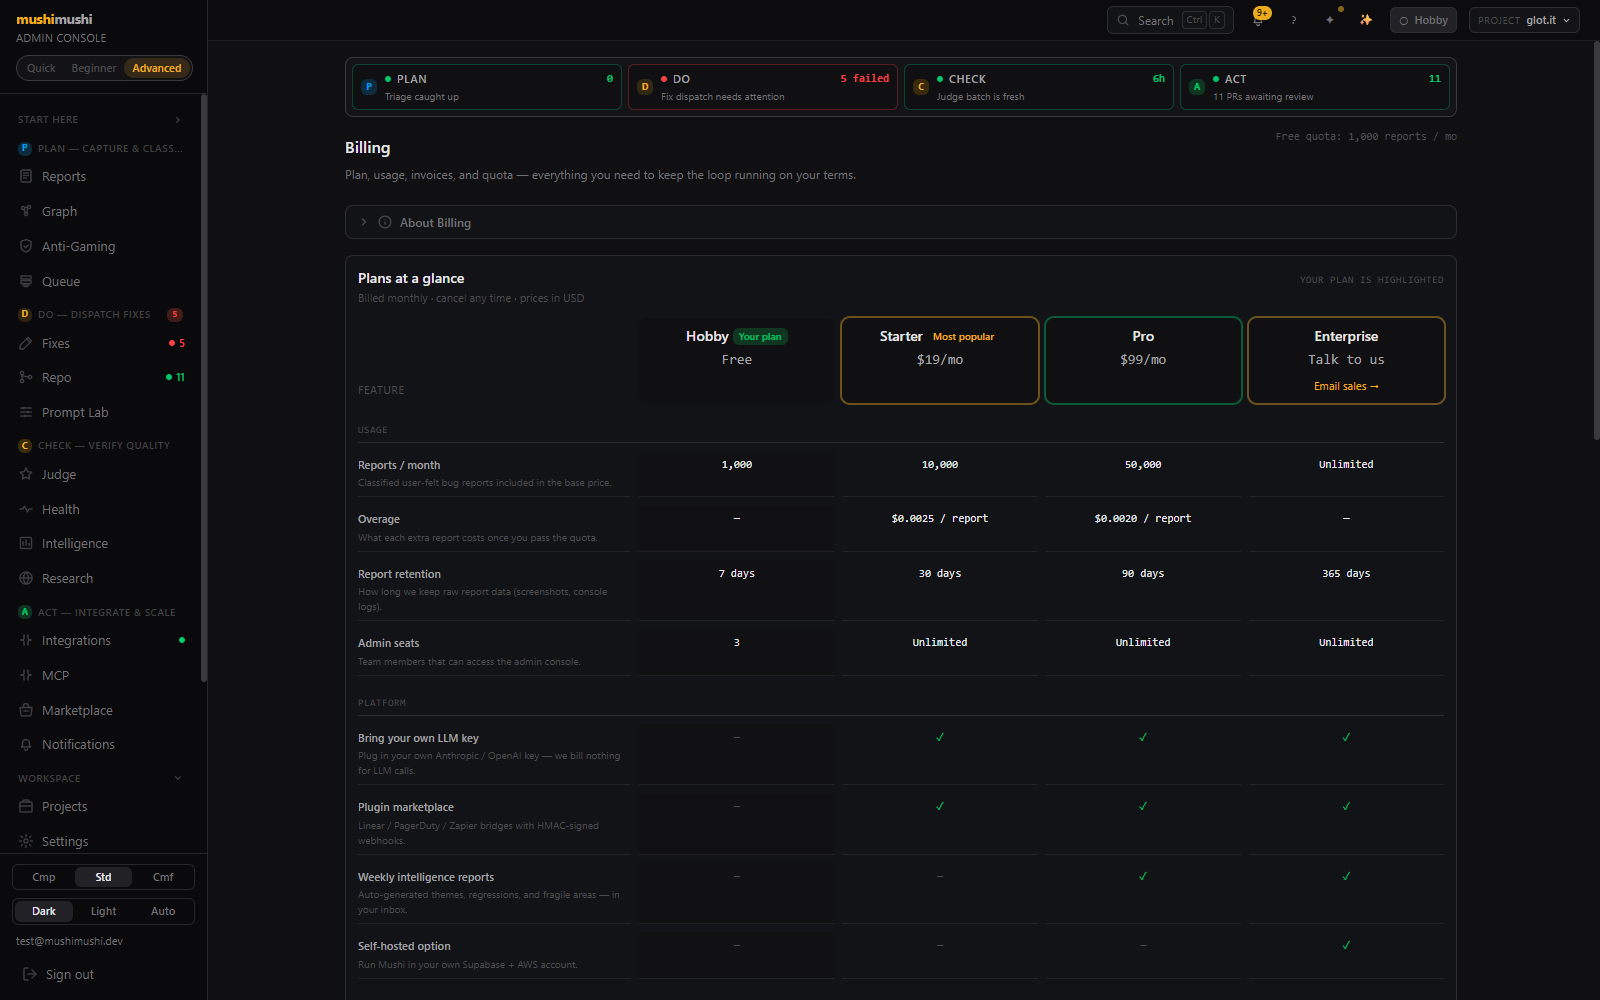
Billing page — Plans at a glance card with 4-column comparison table.

Billing · plan comparison (Hobby Free / Starter $19 / Pro $99 / Enterprise), per-plan reports/month + overage cents/report + retention days + admin seats, Stripe-metered LLM $ per day, in-app support form.

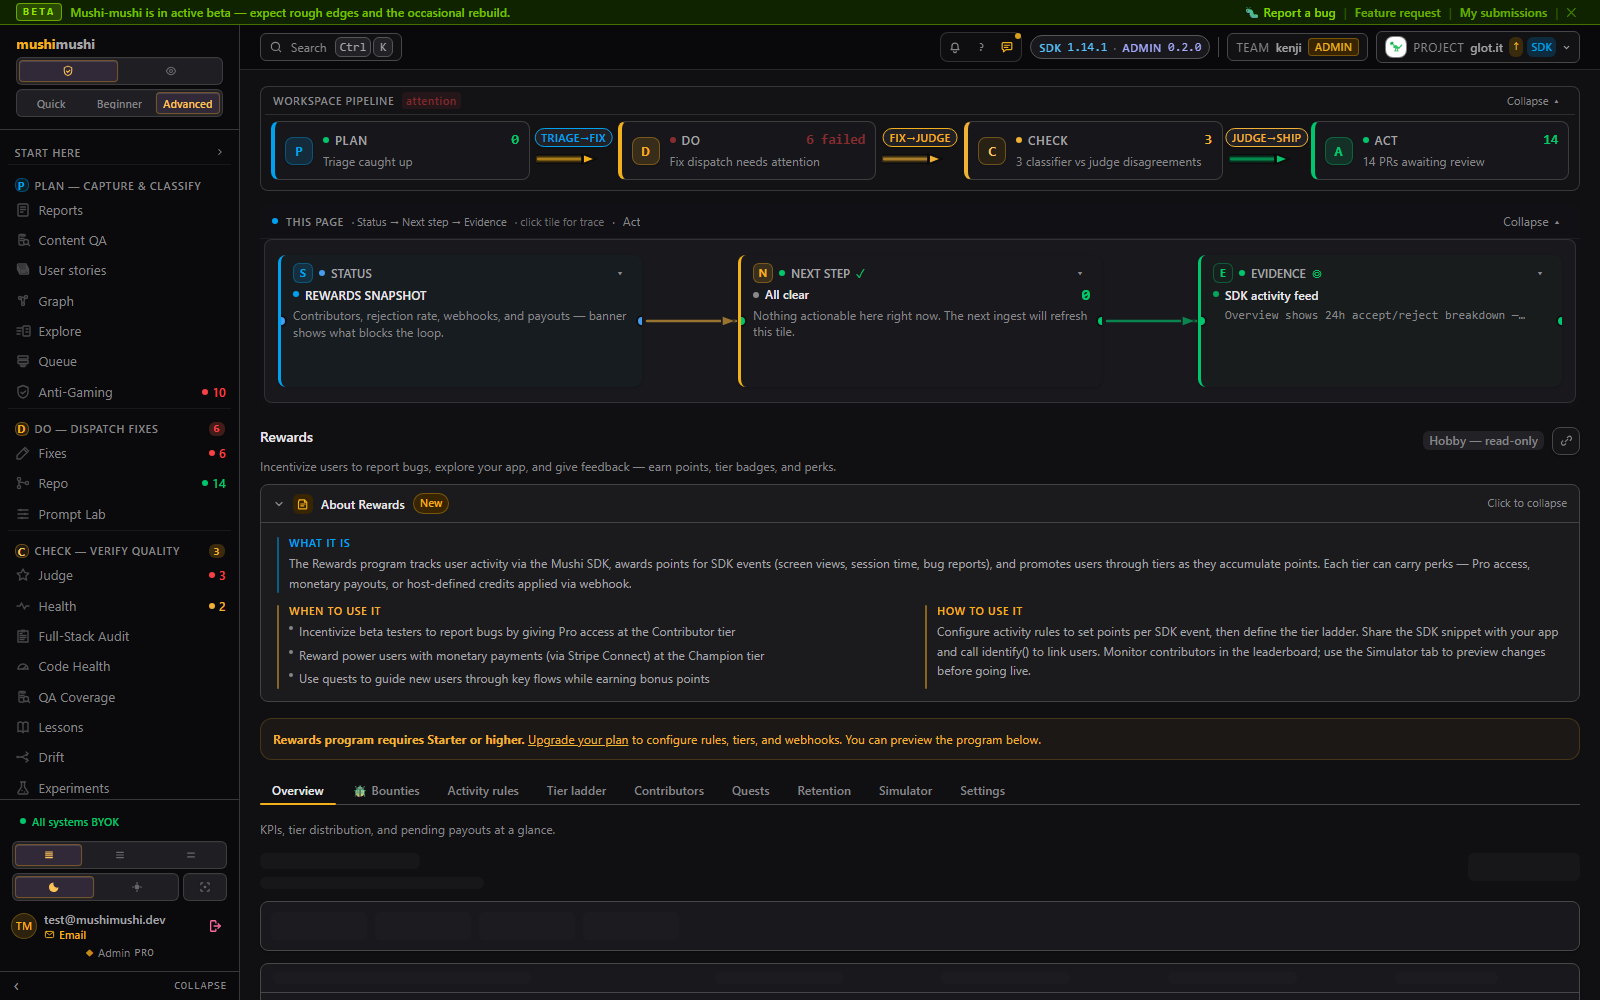
Rewards program — point rules, tier ladder with host_credit_payload grants, and contributor leaderboard.

Rewards · automatic report.submitted / report.triaged point awards, one-click preset install, vault-backed reward webhooks, and @mushi-mushi/node HMAC receiver for host-side tier grants.

Report detail — DiagnosisFixHero, PDCA receipt strip, Branch and PR timeline.

Report detail · DiagnosisFixHero at the fold — plain-English root cause, confidence chip, paste-ready Cursor fix prompt, plus 4-stamp PDCA receipt and live Branch & PR timeline.

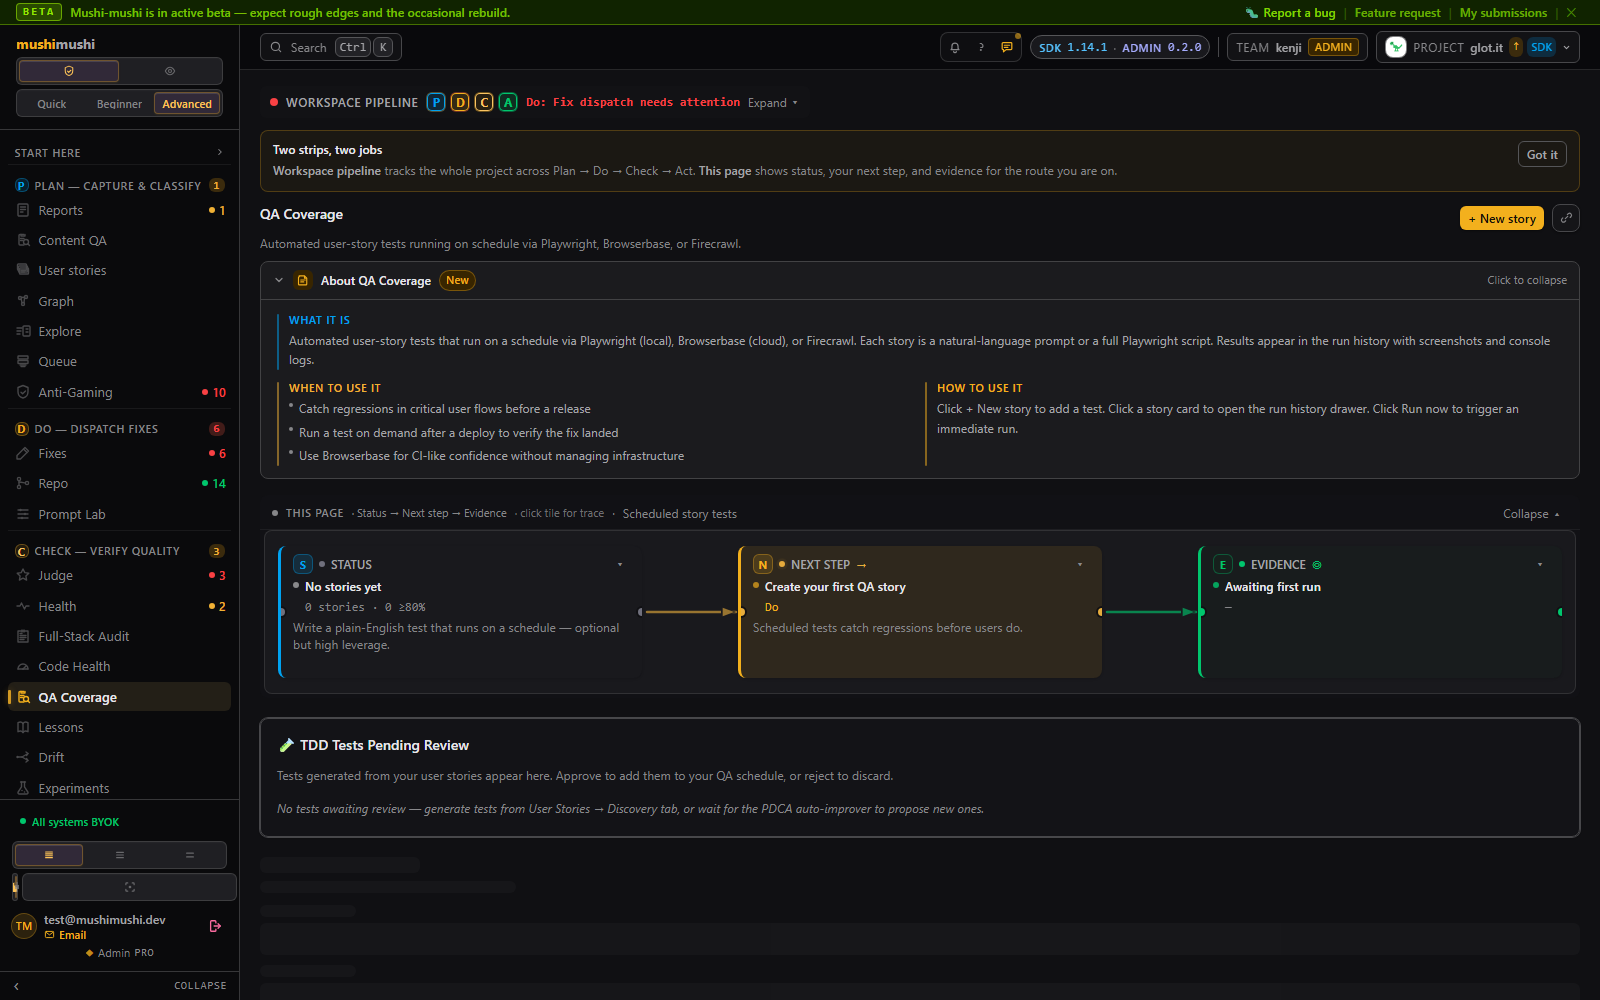
QA Coverage — scheduled user-story tests with Firecrawl / Browserbase / local Playwright providers.

QA Coverage Suite · NL prompts or Playwright scripts on cron — Firecrawl Actions default, Browserbase BYOK, local CLI — pass/fail history and Slack failure threading.

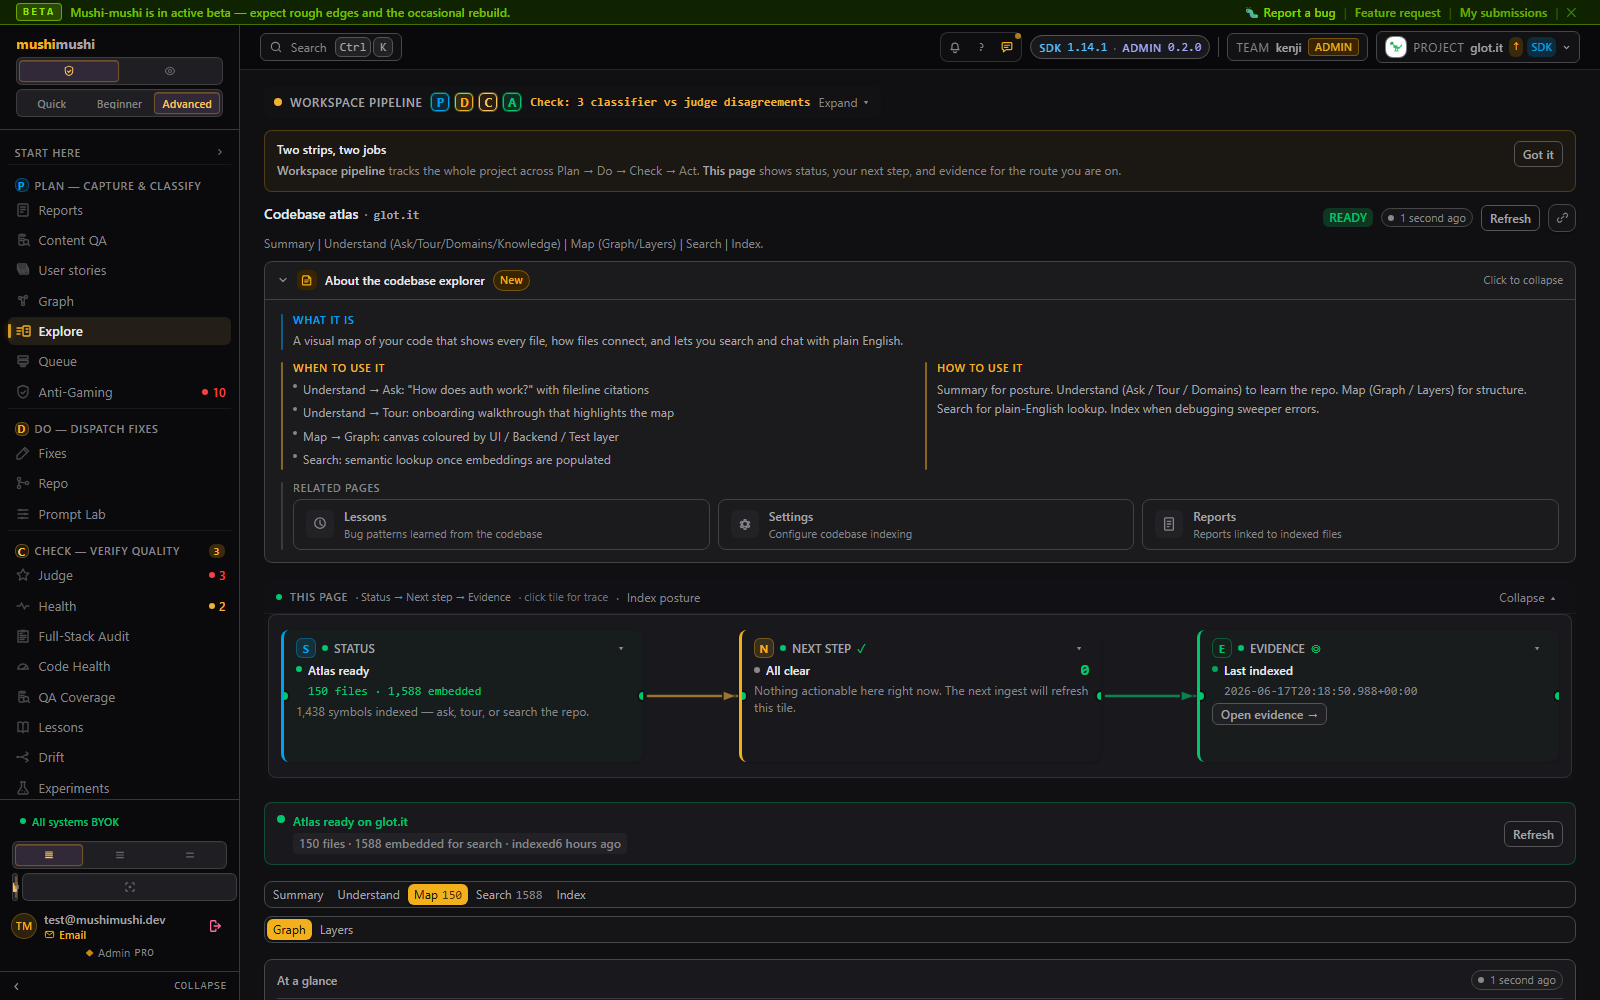
Codebase Atlas (/explore) — Graph view with nodes coloured by architectural layer, directed import arrows, layer legend.

Codebase Atlas — Graph · every indexed source file as a node, coloured by layer (UI / Library / Backend / Tests / Config). Directed import arrows show module dependencies. Semantic search tab ranks pgvector chunks by similarity.

Skill Pipelines — skills.sh catalog synced daily, attach skill chains to reports, handoff or Cursor Cloud mode.

Skill Pipelines · skills.sh-compatible catalog synced daily; attach a skill chain to a report and stream step status over Realtime — handoff or Cursor Cloud mode.