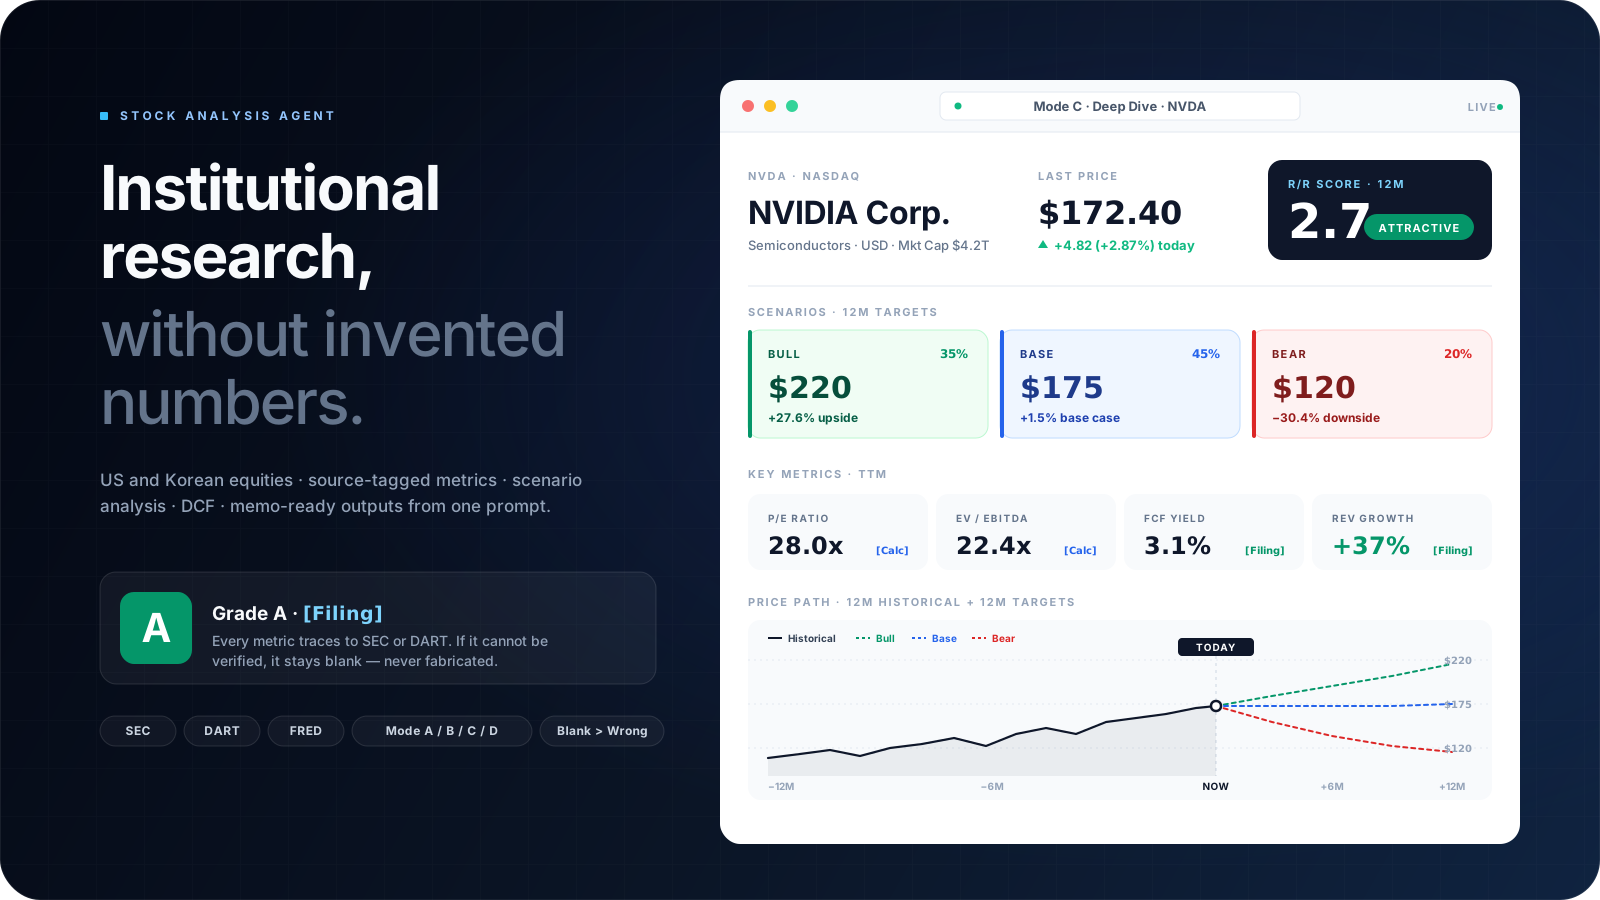
# Stock Analysis Agent ### Institutional-grade research for US & Korean equities — without the invented numbers. **Claude Code** orchestrates a full buy-side pipeline: SEC & DART filings first, every metric source-tagged, a confidence grade on every cell. From ticker to memo in minutes. **English** · [한국어](README.ko.md)
Claude Code US equities Korean equities No fabricated numbers
Mode A Mode B Mode C Mode D Mode E
Mode E preview pending — generated locally during the earnings window.


Stock Analysis Agent showcase
--- ## What's new **v2.1 (May 7, 2026)** — six shipped enhancements across the analysis stack: - **Mode E (Earnings Preview/Review)** — new mode auto-detected in the D-7 ~ D+3 window around an earnings print. Preview covers consensus, beat/miss history, key questions, options-implied move, and pre-print position. Review covers actual vs consensus, guidance delta, key-questions answered, thesis impact, and post-print action. - **Valuation Bridge (Mode C)** — a new section reconciles four anchors (DCF, Comps, Analyst Target, Our Base) into a single weighted fair value with the reconciliation logic shown. - **Auto Delta Banner (all modes)** — when a prior snapshot exists, every report (A/B/C/D) prepends a banner showing R/R, target, and weighted-fair-value deltas plus risk/catalyst additions. Toggle off with `--no-delta`. - **Mode B Macro Context** — peer comparisons now render 3–5 macro series with a per-peer narrative paragraph (light bundle, no Mode C-style sensitivity table). - **Symmetric Peer Comparison (Mode C/D)** — peers fetched via an abbreviated yfinance pipeline (8 metrics, 24h cache) so peer cells are real Portal Grade B values instead of placeholder estimates. - **Catalyst Timeline (Mode C)** — catalyst lists now render as Gantt-style horizontal bars across five categories (earnings, regulatory, product, macro, other), merged with peer catalysts where relevant. --- ## Why this exists Most stock-research chatbots happily invent P/E ratios, hallucinate revenue, and cite sources that don't say what they claim. This agent is built on the opposite assumption. > **Blank beats wrong.** If a figure cannot be verified against a primary source, it stays as `—`. No exceptions. Five principles hold the system together: | | Principle | What it means in practice | |---|---|---| | **1** | **Blank > Wrong** | Grade D values render as `—`. The model never fills a gap it cannot prove. | | **2** | **No Source, No Number** | Every numerical claim carries a `[Filing]`, `[Portal]`, `[Calc]`… tag. | | **3** | **Company-Specificity** | Variant views must fail the competitor-replacement test — generic analysis is worse than none. | | **4** | **Adaptive Data** | Enhanced (MCP) when keys are live, Standard (web) when they aren't. Both ship. | | **5** | **Mechanism Required** | Every risk has a causal chain: `event → P&L impact → stock price`. | --- ## What you get Type a ticker. Get a buy-side note — not a chatbot summary.

🇺🇸 US Stocks

SEC-grade financials

Financial Datasets API unlocks Grade A data: live price, 8-quarter statements, insider transactions, and filings — straight from the source of record.

🇰🇷 Korean Stocks

DART-grade financials

DART OpenAPI pulls regulator-filed statements directly. Naver Finance, FnGuide, and KIND layer on real-time market context.

🧠 Analysis Layer

Buy-side discipline

Scenario analysis, Variant View, precision risk, DCF + Reverse DCF (implied growth), peer comparison — every number shipped with a confidence grade and source tag.
What lands in the report: - 📊 **Scenario analysis** — Bull / Base / Bear with a probability-weighted `R/R Score` - 🎯 **Variant View** — where the market is wrong, backed by company-specific evidence - ⚠️ **Precision Risk** — event → P&L impact → stock price effect (no hand-waving) - 🔖 **Source-tagged data** — every number traces back to its origin - 🇰🇷 **Korean market overlay** — foreign ownership, value-up policies, disclosure flow --- ## Workflows Built for research, not quote lookups. One natural-language prompt routes into the right workflow: | Workflow | Use it for | Example prompt | Primary output | |----------|------------|----------------|----------------| | Single-stock analysis | default deep research on one ticker | `Analyze NVDA` | Mode C dashboard | | Quick screen | a fast first pass before deeper work | `Analyze AAPL in Mode A` | Mode A briefing | | Peer comparison | ranking 2-5 names under one framework | `NVDA vs AMD vs INTC` | Mode B comparison | | Investment memo | a formal, shareable write-up | `AAPL investment memo` | Mode D DOCX | | Earnings preview / review | the D-7 ~ D+3 window around an earnings print | `GOOGL earnings preview` / `AAPL Q1 review` | Mode E HTML | | Watchlist / delta | monitoring what changed since the last run | `Scan my watchlist` / `Compare NVDA to the last analysis` | refreshed artifacts + delta context | > Need just a quote? Use a market-data app. This repo is built for the work that comes *after* the price check. --- ## Output Modes Not sure which to pick? Start with **Mode C** — it's the default full-analysis path.
Mode Choose This When What You Get Best For Example
A — Quick Briefing
Fastest pass
You want a first screen before spending time on a full write-up. HTML verdict card
180-day catalyst timeline
3 KPI tiles
Fast triage and go / no-go decisions Open example
B — Peer Comparison
Relative ranking
You need to compare 2-5 names under one consistent framework. HTML comparison matrix
R/R ranking
best-pick call
Choosing the strongest name in a peer set Open example
C — Deep Dive Dashboard
Default mode
You want the main investment case, valuation, risks, and strategy in one view. HTML dashboard
KPIs, charts, valuation, macro, scenarios
Day-to-day deep research Open example
D — Investment Memo
Most formal
You need a shareable long-form document for review, discussion, or archive. DOCX memo
3,000+ word structured note
full thesis + appendix
Formal write-ups you can circulate Open example
E — Earnings Preview / Review
Earnings window only
You're in the D-7 ~ D+3 window around an earnings print and need a focused preview or review — not a full Mode C rerun. HTML preview or review
consensus + key questions
options-implied move (Preview)
actual vs consensus + thesis impact (Review)
Trading the print: pre-position before earnings or judge the print after Preview pending — generated locally
Mode D opens as a Google Docs preview — GitHub does not render `.docx` inline.
See the detailed structure for each mode ### 🔍 Mode A — Quick Briefing **A** as in **A**t-a-glance. A one-page HTML screen for fast triage. ~500 words, 2–3 minutes. | Section | Contents | |---------|----------| | **One-Line Thesis** | single sentence — must pass the competitor replacement test | | **Verdict Badge** | Overweight / Neutral / Underweight + R/R Score (color-coded) | | **KPI Tiles** | 3 metrics chosen by company type (e.g. Tech: P/E · Revenue Growth · FCF Yield) | | **Scenario Snapshot** | Bull / Base / Bear targets · probabilities · returns | | **Event Timeline** | 180-day catalyst calendar — earnings · product launches · regulatory events | | **Go-Deeper Prompt** | one-click upgrade to Mode C or Mode D | ### ⚖️ Mode B — Peer Comparison **B** as in **B**enchmark. 2–5 tickers evaluated under one consistent frame. 800–1,200 words. | Section | Contents | |---------|----------| | **Comparison Matrix** | valuation · growth · profitability · balance sheet — Winner column per row | | **R/R Score Ranking** | weighted score per ticker, sorted best → worst | | **Per-Ticker Variant View** | Q1 + Q2 short form — consensus disagreement + primary catalyst | | **Best Pick** | reasoned recommendation · why this peer wins on risk-adjusted basis | | **Relative Valuation** | premium / discount vs peer median with mechanism | | **Macro Lens** *(new)* | 3–5 macro series rendered with a per-peer narrative paragraph (light bundle, no Mode C-style sensitivity table) | | **Consistency Rule** | same metric set across all peers · missing → "—" (never substituted) | ### 📈 Mode C — Deep Dive Dashboard *(default)* **C** as in **C**hart. An HTML dashboard designed for fast investment decision-making. | Section | Contents | |---------|----------| | **Header** | Company name · live price · market cap · 52W range · IR / filing links | | **Scenario Cards** | 🐂 Bull / 📊 Base / 🐻 Bear price targets · probabilities | | **R/R Score Badge** | Weighted risk/reward score | | **KPI Tiles** | P/E · EV/EBITDA · FCF Yield · Revenue Growth · Operating Margin | | **Variant View** | Q1-Q3: where the market is wrong, with company-specific proof | | **Precision Risk** | 3 risks × mechanism chain × EBITDA impact × mitigation | | **Macro Environment** | macro factors · impact assessment · confidence badges | | **Valuation** | SOTP · comps · **DCF sensitivity table + Reverse DCF (implied growth)** | | **Valuation Bridge** *(new)* | 4 anchors (DCF · Comps · Analyst Target · Our Base) reconciled into a weighted fair value, with the reconciliation logic shown | | **Peer Comparison** *(symmetric, new)* | peers fetched via abbreviated yfinance pipeline (8 metrics, 24h cache) — real Portal Grade B values instead of placeholder estimates | | **Catalyst Timeline** *(new)* | Gantt-style horizontal bars across 5 categories (earnings · regulatory · product · macro · other), merged with peer catalysts | | **Analyst Targets** | consensus · high/low · rating distribution | | **Charts** | revenue trend · margin history · price vs targets | | **Quarterly Financials** | 8-quarter income statement · QoE bridge | | **Strategy** | positioning guide · key catalysts | ### 📝 Mode D — Investment Memo **D** as in **D**ocument. A Word document for full write-ups and sharing. | Section | Contents | |---------|----------| | Executive Summary | one-line thesis · verdict · R/R Score | | Business Overview | revenue mix · market share · TAM | | Financial Performance | 8-quarter tables · margin trends · FCF | | Valuation | P/E · EV/EBITDA · SOTP · **DCF fair value + sensitivity + Reverse DCF** | | **5-Question Variant View** | where the market is wrong | | Precision Risk Analysis | 3 risks × full mechanism chain + EBITDA impact | | Macro Risk Overlay | top-down factors · sector sensitivity · impact pathways | | Investment Scenarios | Bull / Base / Bear with the R/R formula | | Peer Comparison | 5 metrics vs. 3-5 peers | | Management & Governance | CEO track record · capital allocation | | Quality of Earnings | EBITDA bridge · FCF conversion · SBC haircut | | What Would Make Me Wrong | 3 assumptions · pre-mortem | | Appendix | data sources · confidence grades · exclusions | ### 📅 Mode E — Earnings Preview / Review **E** as in **E**arnings. A focused report for the D-7 ~ D+3 window around an earnings print. Auto-detected by the earnings-window-detector skill; outside the window the agent falls back to Mode C. Override with `--earnings-mode preview|review` or `--mode E`. Mode E is **not** Mode C plus a timeline — it has its own framework, sub-modes, and renderer. Outputs land at `output/reports/{TICKER}_E_{preview|review}_{lang}_{date}.html`. **Preview (D-7 ~ D-1)** — six sections: | Section | Contents | |---------|----------| | **Consensus Snapshot** | EPS · revenue consensus · key segment expectations | | **Beat / Miss History** | last 8 quarters: actual vs consensus · surprise % · 1-day reaction | | **Key Questions** | 3–5 specific questions the print needs to answer | | **Options Snapshot** | ATM straddle · IV percentile · implied move % (best-effort via yfinance) | | **Pre-Mortem** | what would invalidate the long / short going into the print | | **Pre-Print Position** | sizing, hedges, and the explicit pre-print stance | **Review (D ~ D+3)** — six sections: | Section | Contents | |---------|----------| | **Print Snapshot** | actual vs consensus on EPS, revenue, segments | | **Guidance Delta** | next-quarter / FY guidance vs prior expectation | | **Key Questions Answered** | each Preview question marked answered / partial / unanswered with evidence | | **Thesis Impact** | long & short pillars from the prior Mode C re-evaluated | | **Light Verdict Update** | forward EPS only — DCF and price targets are carried forward with `outdated=true` and a Mode C rerun banner | | **Post-Print Action** | concrete next move: add / trim / hold / flip with rationale | > **Mode E rules** > - Entry to Mode E forces `FRESH_COLLECTION` — a stale snapshot is never reused for an earnings print. > - If options data is unavailable, Section 4 renders a stub with `[Quality flag]` rather than blocking the report. > - The Review verdict is intentionally light: targets are not re-derived. The report flags itself `outdated=true` and recommends a full Mode C rerun.
> **Auto Delta Banner.** When a prior snapshot exists for the same ticker, every report (Mode A/B/C/D) prepends a banner with R/R, target, and weighted-fair-value deltas plus risk/catalyst additions. Disable with `--no-delta`. --- ## Research Pipeline ```mermaid flowchart LR Q[🗣️ User asks
e.g. Analyze NVDA] --> W[📅 Earnings window?
D-7 ~ D+3] W -->|yes| E[🎯 Mode E
Preview / Review] W -->|no| R[🧭 Market routing
US / KR] R --> C[📥 Data collection
SEC · DART · Web] C --> V[✅ Validation + grading
A / B / C / D] V --> A[🧠 Analyst layer
Variant View · DCF · Risk] A --> O[📄 Output rendering
Mode A / B / C / D] E --> O ``` Five stages, no shortcuts: 1. **Interpret** the ticker and user intent. 2. **Route** to US (SEC) or Korean (DART) data collection. 3. **Validate** every metric and assign a confidence grade. 4. **Analyze** — valuation, risk, and differentiated insight. 5. **Render** HTML dashboard or DOCX memo. --- ## Data Confidence System Confidence grades are **part of the product**, not a hidden implementation detail. A missing value is a deliberate signal, not a failure. | Grade | Tag | Meaning | Example | |-------|-----|---------|---------| | **A** | `[Filing]` | primary regulatory filing source + arithmetic consistency | SEC / DART API | | **A** | `[Macro]` | government / central bank statistics | FRED API | | **B** | `[Company]` | company IR material, earnings release, transcript | company IR / newsroom | | **B** | `[Portal]` / `[KR-Portal]` | 2+ sources cross-checked | web cross-reference | | **B/C** | `[Portal]` | yfinance fallback; Grade B when cross-confirmed, Grade C when standalone | yfinance supplement | | **B/C** | `[Options]` | options chain (Mode E Preview) — ATM straddle, IV percentile, implied move | yfinance option_chain | | **B/C** | `[History]` | earnings history (Mode E Preview/Review) — last 8Q actual vs consensus, surprise %, 1d reaction | yfinance earnings_history | | **C** | `Grade C` | single-source, unverified | one web mention | | **D** | `—` | cannot verify → shown as blank | never fabricated | ```text US example: Revenue TTM: $402.8B [Filing] P/E Ratio: 28.0x [Calc] EV/EBITDA: — Korean example: Revenue TTM: 302.2T KRW [Filing] Operating Margin: 9.2% [Calc] Consensus PER: 12.4x [KR-Portal] ``` --- ## R/R Score — one number, honest math Every analysis reduces scenario-weighted upside versus downside into a single headline number. ```text R/R Score = (Bull_return% × Bull_prob + Base_return% × Base_prob) ───────────────────────────────────────────────────── |Bear_return% × Bear_prob| ``` | Score | Signal | Typical Verdict | |-------|--------|-----------------| | **> 3.0** | 🟢 Attractive | Overweight | | **1.0 – 3.0** | 🟡 Neutral | Neutral / Watch | | **< 1.0** | 🔴 Unfavorable | Underweight | --- ## Quick Start ### Prerequisites - **Claude Code** installed locally - **Python 3.8+** for helper scripts - **`python-docx`** for Mode D DOCX output - **`yfinance`** options-chain access for Mode E Preview (best-effort — Mode E gracefully renders a stub if the chain is unavailable) ### Setup path — pick what you need | Goal | Configure | Why it matters | |------|-----------|----------------| | 🇺🇸 Best US coverage | Financial Datasets MCP | SEC-based structured financials, real-time price, insider trades | | 🔄 Middle fallback | yfinance | Stable Python fallback for price/basics — no API key, used before raw web scraping | | 📊 Macro precision (Mode C/D) | `FRED_API_KEY` | Treasury, Fed, CPI, GDP, unemployment | | 🇰🇷 Korean stocks | `DART_API_KEY` | Regulator financials and recent disclosures | ### 1. Install the basics ```bash npm install -g @anthropic-ai/claude-code pip install -r requirements.txt git clone https://github.com/kipeum86/stock-analysis-agent.git cd stock-analysis-agent cp .env.example .env ``` `requirements.txt` installs the shared helper-script dependencies, including `python-docx` and `yfinance`. `cp .env.example .env` gives you a convenient place to store optional local keys such as `FRED_API_KEY`. ### 2. Connect Grade A US data *(strongly recommended)* ```bash claude mcp add --transport http financial-datasets https://mcp.financialdatasets.ai/ \ --header "X-API-KEY: your_api_key_here" ``` Get a key at [financialdatasets.ai](https://financialdatasets.ai) Setup guide: [docs/mcp-setup-guide.md](docs/mcp-setup-guide.md) ### 3. Connect FRED API *(optional, for macro precision in Mode C/D)* Add to `.env`: ```bash FRED_API_KEY=your_key_here ``` This adds Grade A macro inputs such as the 10Y Treasury, Fed Funds Rate, CPI, GDP, and unemployment. ### 4. Connect DART API *(free and effectively required for Korean stocks)* Add to the `env` block in `.claude/settings.local.json`: ```json "env": { "DART_API_KEY": "your_key_here" } ``` Get a key at [opendart.fss.or.kr](https://opendart.fss.or.kr) If you prefer project-local secrets over shell variables, keep them together in this same `env` block. ### 5. Run ```bash claude ``` `CLAUDE.md` is loaded automatically at startup, and the session will show a state block like: ```text === Stock Analysis Agent === Data Mode (US): {Enhanced (MCP active) / Standard (yfinance + Web)} Data Mode (KR): DART API (Grade A financials) + Naver Finance (price) + yfinance fallback Date: {YYYY-MM-DD} Ready. Send a ticker or question to begin. ``` --- ## Common Prompts | Goal | Example prompt | |------|----------------| | Default deep dive | `Analyze NVDA` | | Korean single-stock analysis | `005930 심층 분석` | | Formal memo | `AAPL investment memo` / `삼성전자 투자 메모 써줘` | | Peer comparison | `NVDA vs AMD vs INTC` / `삼성전자 vs SK하이닉스 비교` | | Earnings preview (D-7 ~ D-1) | `GOOGL 프리뷰` / `earnings preview AAPL` / `Q1 preview NVDA` | | Earnings review (D ~ D+3) | `AAPL Q1 review` / `MSFT 실적 리뷰` / `earnings review TSLA` | | Force Mode E outside the auto window | append `--mode E` or `--earnings-mode preview\|review` | | Watchlist scan | `Scan my watchlist` | | Delta comparison | `Compare NVDA to the last analysis` | Price-only queries are not supported. Ask for analysis instead, such as `Analyze AAPL` or `삼성전자 분석해줘`. --- ## Generated Artifacts Each run leaves both a human-readable report and machine-readable checkpoints. That makes it easy to inspect validation, compare against the previous snapshot, or automate follow-up workflows. | Path family | What it stores | |-------------|----------------| | `output/reports/` | final HTML / DOCX deliverables | | `output/runs/{run_id}/{ticker}/` | run-local research plan, validated data, analysis result, QA report | | `output/data/{ticker}/` | reusable snapshots for delta analysis and watchlist refreshes | ---
See detailed data sources — US stocks > **Strongly recommended.** Connecting [Financial Datasets API](https://financialdatasets.ai) unlocks Grade A data collection. Structured data pulled directly from SEC filings: | Data | API Call | Confidence | |------|----------|------------| | Real-time price | `get_current_stock_price` | Grade A | | 8-quarter income statement | `get_income_statements` | Grade A | | Balance sheet (8 quarters) | `get_balance_sheets` | Grade A | | Cash flow (8 quarters) | `get_cash_flow_statements` | Grade A | | Analyst price targets | FMP MCP | Grade B | | Insider transactions | `get_insider_transactions` | Grade A | | SEC filings (10-K, 10-Q) | `get_sec_filings` | Grade A | Major fallbacks used alongside or without MCP: | Data | Source | Confidence | |------|--------|------------| | Price · Market cap · basic ratios fallback | yfinance | Grade B/C | | Price · Market cap · Ratios | Yahoo Finance, Google Finance, MarketWatch | Grade B | | Financial statements | SEC EDGAR (direct fetch) | Grade A | | Earnings results | PR Newswire, Business Wire, Seeking Alpha | Grade B | | Analyst price targets | TipRanks, MarketBeat | Grade B | | News · Qualitative context | Reuters, Bloomberg, CNBC, Financial Times | Qualitative | | Insider trading | SEC Form 4 (EDGAR), Finviz | Grade B | When Financial Datasets MCP is unavailable, Standard Mode tries yfinance first and only then falls back to direct web search / scraping.
See detailed data sources — Korean stocks Korean stocks always pull structured financial statements directly from **DART OpenAPI**. | Data | Source | Confidence | |------|--------|------------| | Consolidated financials (IS/BS/CF) | DART OpenAPI `fnlttSinglAcntAll` | Grade A | | Company metadata (corp_code, CEO) | DART OpenAPI `company` | Grade A | | Recent disclosures (90 days) | DART OpenAPI `list` | Grade A | | Price · PER · PBR · foreign ownership | Naver Finance | Grade B | | Fallback price · PER · PBR · EPS · 52W range | yfinance (`.KS` / `.KQ`) | Grade B/C | | Analyst consensus | FnGuide / web research | Grade B | Naver Finance remains the primary KR market-data source; yfinance only fills gaps if the Naver fetch fails or required fields are missing. The Korean workflow combines DART financials with Naver Finance market data, yfinance fallback coverage, and FnGuide / KIND context.
See outputs, file paths, and mode comparison All generated files live under `output/`. | File | Purpose | |------|---------| | `output/runs/{run_id}/{ticker}/research-plan.json` | run-local research plan | | `output/runs/{run_id}/{ticker}/validated-data.json` | run-local validated data | | `output/runs/{run_id}/{ticker}/analysis-result.json` | run-local structured analysis | | `output/runs/{run_id}/{ticker}/quality-report.json` | run-local QA report | | `output/reports/{ticker}_A_*.html` | Mode A quick briefing | | `output/reports/{tickers}_B_*.html` | Mode B peer comparison | | `output/reports/{ticker}_C_*.html` | Mode C dashboard | | `output/reports/{ticker}_D_*.docx` | Mode D investment memo | | `output/reports/{ticker}_E_{preview\|review}_*.html` | Mode E earnings preview / review | | `output/data/{ticker}/latest.json` | snapshot pointer for delta analysis | | `output/watchlist.json` | watchlist registry | | `output/catalyst-calendar.json` | catalyst calendar | US stocks operate in two modes depending on whether Financial Datasets API is connected: | | Enhanced Mode 🟢 | Standard Mode 🟡 | |-|-----------------|-----------------| | **Requires** | Financial Datasets API key | No API key; yfinance first, web search if needed | | **Data source** | structured SEC API | yfinance + web research | | **Price data** | real-time, Grade A | yfinance / web-sourced, Grade B/C | | **Financials** | 8 quarters, machine-readable | yfinance statements + web fallback, may vary | | **Max grade** | **Grade A** | Grade B | | **Cost** | ~$0.05-$0.28 per analysis | Free |
See the project structure ```text stock-analysis-agent/ ├── CLAUDE.md ├── README.md ├── README.ko.md ├── docs/ │ ├── assets/ │ ├── mcp-setup-guide.md │ └── mcp-setup-guide.ko.md ├── references/ ├── output/ │ ├── reports/ │ └── data/ ├── evals/ ├── tools/ └── .claude/ ├── skills/ └── agents/ ```
--- ## Disclaimer **This tool is for informational purposes only. It is not investment advice, a solicitation to buy or sell securities, or a guarantee of returns.** - All analysis is AI-generated and may contain errors. - Verify time-sensitive data with primary sources before acting. - Past performance does not predict future results. - Consult a qualified financial professional before making investment decisions. The anti-hallucination system reduces but does not eliminate data risk. Independently verify all outputs before acting on them.