<!DOCTYPE html>
<html lang="en">


<head>
<meta charset="utf-8">
<title>Advanced chord diagram with R and circlize &#8211; the R Graph Gallery</title>
<meta http-equiv="Content-Type" content="text/html; charset=utf-8" />
<meta name="generator" content="pandoc" />
<meta name="viewport" content="width=device-width, initial-scale=1, shrink-to-fit=no">
<meta name="description" content="Chord diagram is an efficient way to display flows between entities. This post shows how to build it from an edge list or from an adjacency matrix, using the circlize package.">
<meta name="keywords" content="R,ggplot2,tidyverse,Example,Data,Dataviz,Datavisualization,Plot,Chart,Graph,Learning,Caveat,Pitfall,Mistake">
<meta name="author" content="Yan Holtz">
<link rel="icon" href="img/logo/R_single_small.png">


<!-- Control appearance when shared by social media -->
<meta property="og:title" content="Advanced chord diagram with R and circlize" />
<meta property="og:image" content="https://github.com/holtzy/R-graph-gallery/raw/master/img/logo/R_single_big.png" />
<meta property="og:description" content="Chord diagram is an efficient way to display flows between entities. This post shows how to build it from an edge list or from an adjacency matrix, using the circlize package." />
<meta property='og:url' content="https://www.r-graph-gallery.com/123-circular-plot-circlize-package-2.html" />
<meta property="og:type" content="website" />

<!-- Bootstrap core CSS -->
<link href="vendor/bootstrap/css/bootstrap.min.css" rel="stylesheet">

<!-- Custom fonts for this template -->
<link href="vendor/font-awesome/css/font-awesome.min.css" rel="stylesheet" type="text/css">

<!-- Custom styles for this template -->
<link href="css/agency.css" rel="stylesheet">

<!-- JQUERY -->
<script src="vendor/jquery/jquery.min.js"></script>

</head>


<body data-spy="scroll" data-target="#myScrollspy" data-offset="1">


<!-- THIS ALLOWS TO INSERT THE MENU -->
<nav class="navbar navbar-expand-lg fixed-top" id="mainNav">
<div class="container">
  <a href="index.html">&larr; R Graph Gallery</a>
  <button class="navbar-toggler navbar-toggler-right" type="button" data-toggle="collapse" data-target="#navbarResponsive" aria-controls="navbarResponsive" aria-expanded="false" aria-label="Toggle navigation">
    Menu
    <i class="fa fa-bars"></i>
  </button>
  <div class="collapse navbar-collapse" id="navbarResponsive">
    <ul class="navbar-nav text-uppercase ml-auto">
      <li class="nav-item">
        <a class="nav-link" data-toggle="modal" href="#researchModal"><i class="fa fa-search"></i></a>
      </li>
      <li class="nav-item">
        <a class="nav-link" data-toggle="modal" href="#LogoMenu">Chart types</a>
      </li>
      <li class="nav-item dropdown">
        <a class="nav-link" href="#" id="navbarDropdown" role="button" data-toggle="dropdown" aria-haspopup="true" aria-expanded="false">
          Quick
        </a>
        <div class="dropdown-menu" aria-labelledby="navbarDropdown">
          <p class="menuTitle"><i>Basics</i></p>
          <div class="dropdown-divider"></div>
          <a class="dropdown-item" href="https://www.d3-graph-gallery.com/intro_d3js.html">Intro to d3</a>
          <a class="dropdown-item" href="https://www.d3-graph-gallery.com/graph/shape.html">Shape</a>
          <a class="dropdown-item" href="https://www.d3-graph-gallery.com/graph/basic_datamanipulation.html">Data wrangling</a>
          <p class="menuTitle"><i>Customize</i></p>
          <div class="dropdown-divider"></div>
          <a class="dropdown-item" href="https://www.d3-graph-gallery.com/graph/custom_axis.html">Axis</a>
          <a class="dropdown-item" href="https://www.d3-graph-gallery.com/graph/custom_color.html">Color</a>
          <a class="dropdown-item" href="https://www.d3-graph-gallery.com/graph/custom_theme.html">Themes</a>
          <a class="dropdown-item" href="https://www.d3-graph-gallery.com/graph/custom_legend.html">Legend</a>
          <a class="dropdown-item" href="https://www.d3-graph-gallery.com/graph/custom_responsive.html">Responsivness</a>
          <p class="menuTitle"><i>Interactivity</i></p>
          <div class="dropdown-divider"></div>
          <a class="dropdown-item" href="https://www.d3-graph-gallery.com/graph/interactivity_tooltip.html">Tooltip</a>
          <a class="dropdown-item" href="https://www.d3-graph-gallery.com/graph/interactivity_button.html">Button</a>
          <a class="dropdown-item" href="https://www.d3-graph-gallery.com/graph/interactivity_zoom.html">Zoom</a>
          <a class="dropdown-item" href="https://www.d3-graph-gallery.com/graph/interactivity_brush.html">Brushing</a>
          <a class="dropdown-item" href="https://www.d3-graph-gallery.com/interactivity.html">Transition</a>
        </div>
      </li>
      <li class="nav-item">
        <a class="nav-link" href="../all.html">ALL</a>
      </li>
      <li class="nav-item">
        <a class="nav-link" href="https://www.r-graph-gallery.com">R</a>
      </li>
      <li class="nav-item">
        <a class="nav-link" href="https://www.python-graph-gallery.com">Python</a>
      </li>
      <li class="nav-item">
        <a class="nav-link js-scroll-trigger" href="https://www.data-to-viz.com">Data to viz</a>
      </li>
      <li class="nav-item">
        <a class="nav-link js-scroll-trigger" href="https://www.yan-holtz.com">Who am I</a>
      </li>
      <li class="nav-item">
        <a class="nav-link js-scroll-trigger" href="about.html">About</a>
      </li>
    </ul>
  </div>
</div>
</nav>


<!-- Header = Title in big + social media Icon + quick description -->
<header class="masthead">
  <div class="textlanding">
      <center><h1>Advanced chord diagram with R and circlize</h1></center>
      <hr class="short_hr">
      <br>
      <ul class="list-inline social-buttons">
        <li class="list-inline-item">
          <a href="https://twitter.com/R_Graph_Gallery">
            <i class="fa fa-twitter"></i>
          </a>
        </li>
        <li class="list-inline-item social-buttons">
          <a href="https://github.com/holtzy">
            <i class="fa fa-github" style="color: white"></i>
          </a>
        </li>
        <li class="list-inline-item social-buttons">
          <a href="https://www.linkedin.com/in/yan-holtz-2477534a/">
            <i class="fa fa-linkedin"></i>
          </a>
        </li>
        <li class="list-inline-item social-buttons">
          <a href="https://www.yan-holtz.com">
            <i class="fa fa-home"></i>
          </a>
        </li>
      </ul>
      <center><p style="max-width: 600px; margin-top: 40px"><a href="chord-diagram.html">Chord diagram</a> is an efficient way to display flows between entities. This post shows how to build it from an edge list or from an adjacency matrix, using the <code>circlize</code> package.</p></center>
      <div style="text-align:center">
         <a class="btn btn-secondary btn-xl text-uppercase js-scroll-trigger" href='chord-diagram.html'>Chord section</a>
         <a class="btn btn-secondary btn-xl text-uppercase js-scroll-trigger" href='https://www.data-to-viz.com/graph/chord.html'>Data to Viz</a>
      </div>
  </div>
</header>


<!-- STYLE for chart pages but not the rest of tthe website -->
<style>
  img {
    margin-top: 20px;
  }
</style>


<div class="container">
<h1 id="chord-diagram-from-adjacency-matrix">Chord diagram from adjacency matrix</h1>
<hr />
<div class="row">
<div class="col-md-6 col-sm-12 align-self-center">
<p>The <code>chordDiagram()</code> function of the <code>circlize</code> package makes it a breeze to build chord diagrams from adjacency matrix in R.</p>
<p>The adjacency matrix displays all origins in rows, and all destinations in columns. Each cell is filled with a numeric value specifying the flow strength.</p>
<p><u>Note</u>: visit the <a href="chord-diagram.html">chord section</a> of the gallery or the circlize <a href="https://cran.r-project.org/web/packages/circlize/vignettes/circlize.pdf">vignette</a> for more chord examples.</p>
</div>
<div class="col-md-6 col-sm-12">
<p><img src="123-circular-plot-circlize-package-2_files/figure-html/thecode-1.png" width="100%" /></p>
</div>
</div>
<div class="sourceCode" id="cb1"><pre class="sourceCode r"><code class="sourceCode r"><a class="sourceLine" id="cb1-1" data-line-number="1"><span class="co"># 
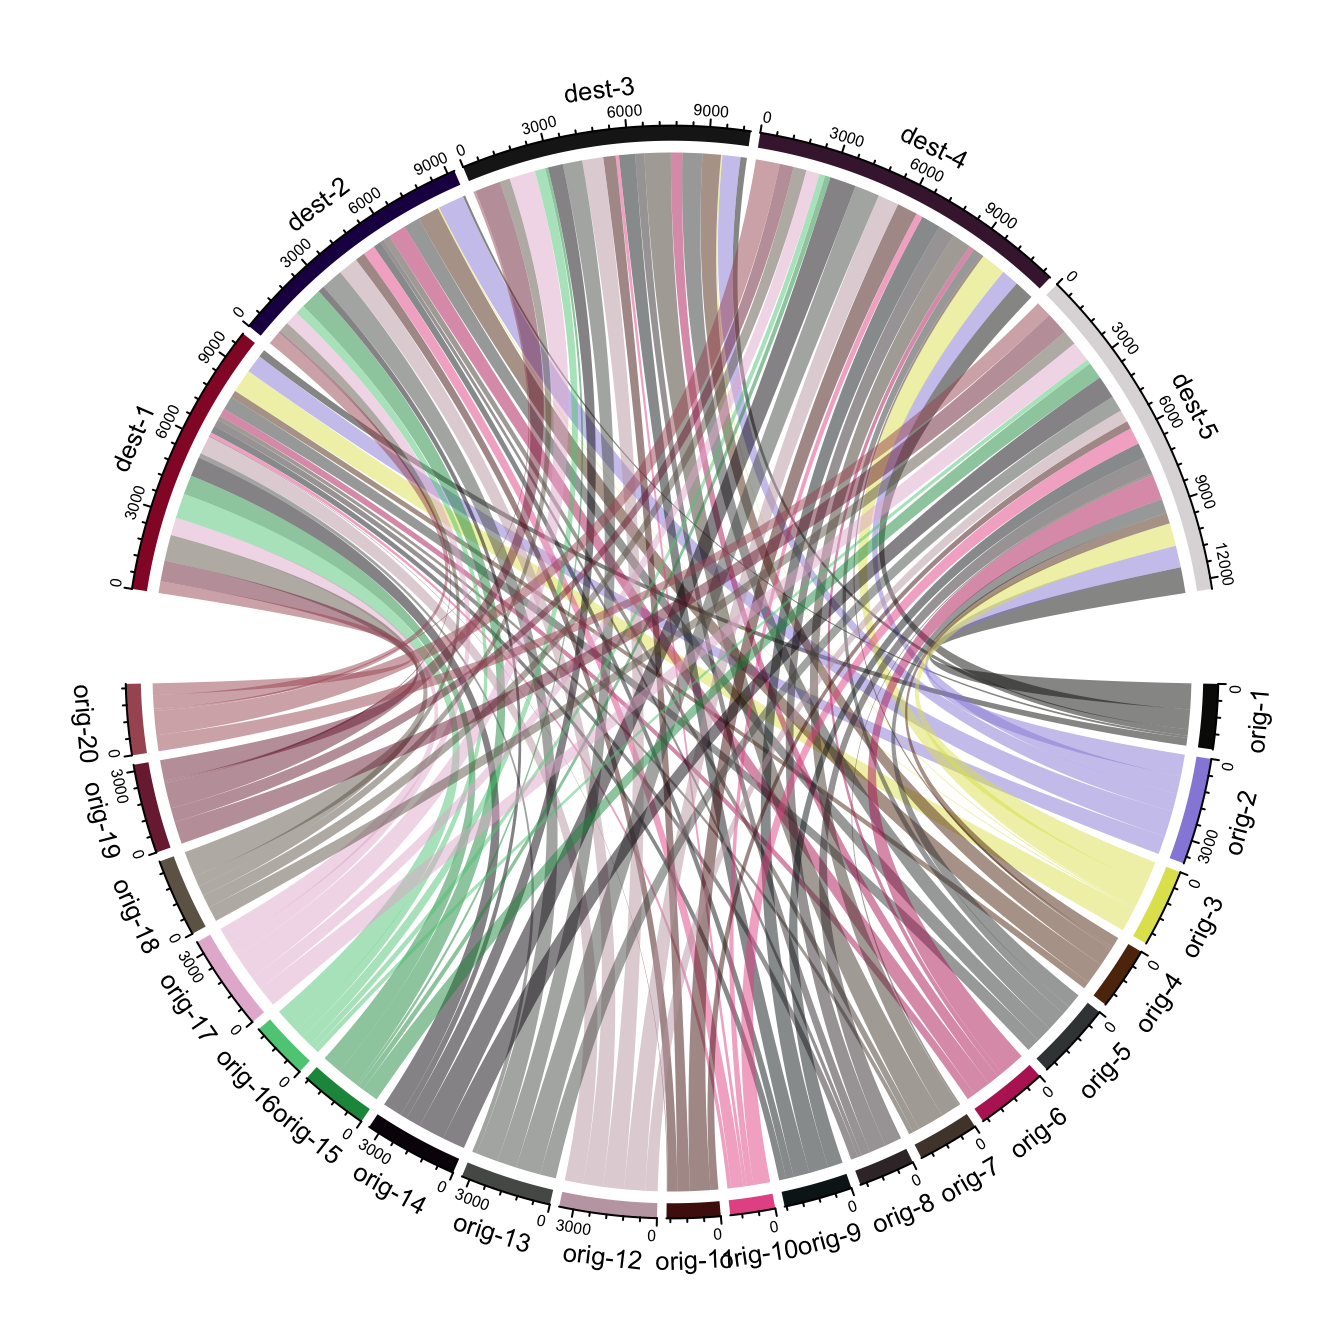
Create an adjacency matrix: </span></a>
<a class="sourceLine" id="cb1-2" data-line-number="2"><span class="co"># a list of connections between 20 origin nodes, and 5 destination nodes:</span></a>
<a class="sourceLine" id="cb1-3" data-line-number="3">numbers &lt;-<span class="st"> </span><span class="kw">sample</span>(<span class="kw">c</span>(<span class="dv">1</span><span class="op">:</span><span class="dv">1000</span>), <span class="dv">100</span>, <span class="dt">replace =</span> T)</a>
<a class="sourceLine" id="cb1-4" data-line-number="4">data &lt;-<span class="st"> </span><span class="kw">matrix</span>( numbers, <span class="dt">ncol=</span><span class="dv">5</span>)</a>
<a class="sourceLine" id="cb1-5" data-line-number="5"><span class="kw">rownames</span>(data) &lt;-<span class="st"> </span><span class="kw">paste0</span>(<span class="st">&quot;orig-&quot;</span>, <span class="kw">seq</span>(<span class="dv">1</span>,<span class="dv">20</span>))</a>
<a class="sourceLine" id="cb1-6" data-line-number="6"><span class="kw">colnames</span>(data) &lt;-<span class="st"> </span><span class="kw">paste0</span>(<span class="st">&quot;dest-&quot;</span>, <span class="kw">seq</span>(<span class="dv">1</span>,<span class="dv">5</span>))</a>
<a class="sourceLine" id="cb1-7" data-line-number="7"></a>
<a class="sourceLine" id="cb1-8" data-line-number="8"><span class="co"># Load the circlize library</span></a>
<a class="sourceLine" id="cb1-9" data-line-number="9"><span class="kw">library</span>(circlize)</a>
<a class="sourceLine" id="cb1-10" data-line-number="10"> </a>
<a class="sourceLine" id="cb1-11" data-line-number="11"><span class="co"># Make the circular plot</span></a>
<a class="sourceLine" id="cb1-12" data-line-number="12"><span class="kw">chordDiagram</span>(data, <span class="dt">transparency =</span> <span class="fl">0.5</span>)</a></code></pre></div>
<h1 id="chord-diagram-from-edge-list">Chord diagram from edge list</h1>
<hr />
<div class="row">
<div class="col-md-6 col-sm-12 align-self-center">
<p>Another common format to store flow information iis the edge list. Basically, all connections are stored one by one in a 2 columns file, listing the origin and destination of each.</p>
<p>Since the <code>chordDiagram()</code> function expects an adjacency matrix as input, it is required to use the <code>table()</code> function for reformating, as described below:</p>
</div>
<div class="col-md-6 col-sm-12">
<p><img src="123-circular-plot-circlize-package-2_files/figure-html/thecode2-1.png" width="100%" /></p>
</div>
</div>
<div class="sourceCode" id="cb2"><pre class="sourceCode r"><code class="sourceCode r"><a class="sourceLine" id="cb2-1" data-line-number="1"><span class="co"># 
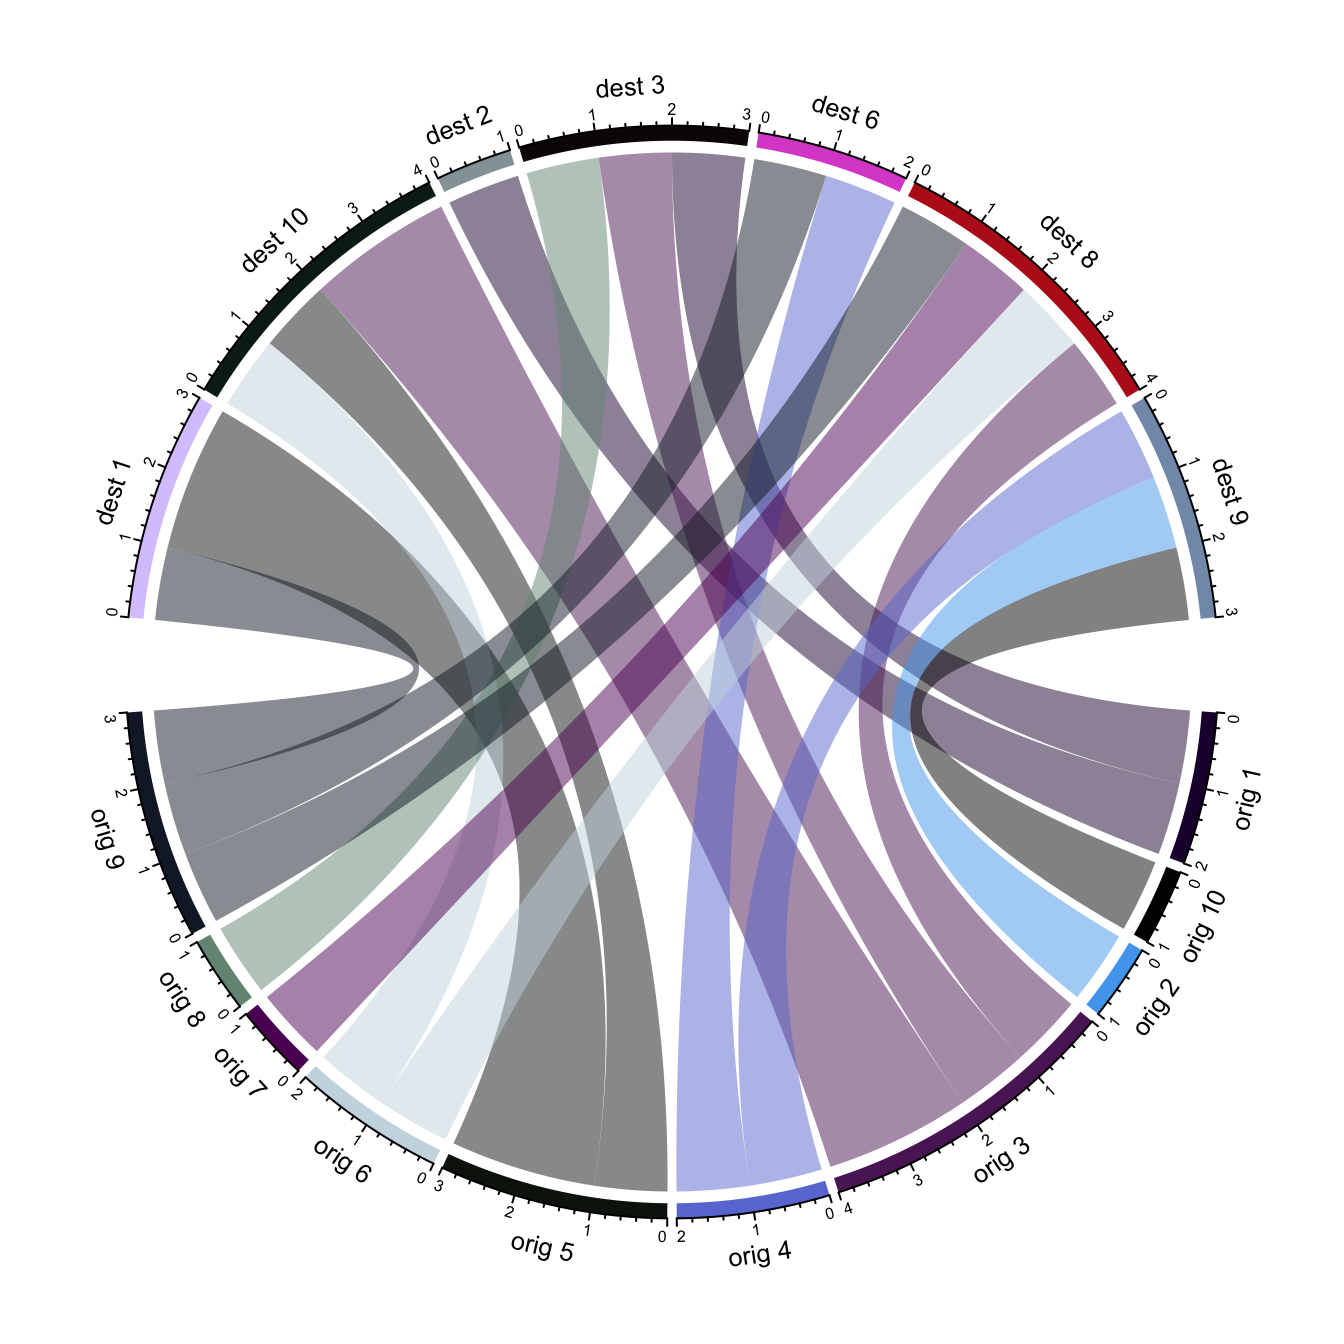
Create an edge list: a list of connections between 10 origin nodes, and 10 destination nodes:</span></a>
<a class="sourceLine" id="cb2-2" data-line-number="2">origin &lt;-<span class="st"> </span><span class="kw">paste0</span>(<span class="st">&quot;orig &quot;</span>, <span class="kw">sample</span>(<span class="kw">c</span>(<span class="dv">1</span><span class="op">:</span><span class="dv">10</span>), <span class="dv">20</span>, <span class="dt">replace =</span> T))</a>
<a class="sourceLine" id="cb2-3" data-line-number="3">destination &lt;-<span class="st"> </span><span class="kw">paste0</span>(<span class="st">&quot;dest &quot;</span>, <span class="kw">sample</span>(<span class="kw">c</span>(<span class="dv">1</span><span class="op">:</span><span class="dv">10</span>), <span class="dv">20</span>, <span class="dt">replace =</span> T))</a>
<a class="sourceLine" id="cb2-4" data-line-number="4">data &lt;-<span class="st"> </span><span class="kw">data.frame</span>(origin, destination)</a>
<a class="sourceLine" id="cb2-5" data-line-number="5"></a>
<a class="sourceLine" id="cb2-6" data-line-number="6"><span class="co"># Transform input data in a adjacency matrix</span></a>
<a class="sourceLine" id="cb2-7" data-line-number="7">adjacencyData &lt;-<span class="st"> </span><span class="kw">with</span>(data, <span class="kw">table</span>(origin, destination))</a>
<a class="sourceLine" id="cb2-8" data-line-number="8"> </a>
<a class="sourceLine" id="cb2-9" data-line-number="9"><span class="co"># Charge the circlize library</span></a>
<a class="sourceLine" id="cb2-10" data-line-number="10"><span class="kw">library</span>(circlize)</a>
<a class="sourceLine" id="cb2-11" data-line-number="11"> </a>
<a class="sourceLine" id="cb2-12" data-line-number="12"><span class="co"># Make the circular plot</span></a>
<a class="sourceLine" id="cb2-13" data-line-number="13"><span class="kw">chordDiagram</span>(adjacencyData, <span class="dt">transparency =</span> <span class="fl">0.5</span>)</a></code></pre></div>
<!-- Close container -->
</div>
<!-- ============================ RELATED SECTION ============================ -->
<section class="bg-light" id="portfolio_landing" style="padding-top: 30px; padding-bottom: 30px; margin-top: 100px;">

<div class="container">

  <p class="mySeryTitle">Related chart types</p>
  <hr>
  <div class="row">
    <div class="col-md-2 col-sm-4 portfolio-item">
      <a class="portfolio-link"  href="chord-diagram.html">
        <div class="portfolio-hover">
          <div class="portfolio-hover-content">
            <i class="fa fa-plus fa-3x"></i>
          </div>
        </div>
        <img class="img-fluid" src="img/section/Chord150.png" alt="">
      </a>
      <div class="captionPortfolio">Chord diagram</div>
    </div>
    <div class="col-md-2 col-sm-4 portfolio-item">
      <a class="portfolio-link"  href="network.html">
        <div class="portfolio-hover">
          <div class="portfolio-hover-content">
            <i class="fa fa-plus fa-3x"></i>
          </div>
        </div>
        <img class="img-fluid" src="img/section/Network150.png" alt="">
      </a>
      <div class="captionPortfolio">Network</div>
    </div>
    <div class="col-md-2 col-sm-4 portfolio-item">
      <a class="portfolio-link"  href="sankey-diagram.html">
        <div class="portfolio-hover">
          <div class="portfolio-hover-content">
            <i class="fa fa-plus fa-3x"></i>
          </div>
        </div>
        <img class="img-fluid" src="img/section/Sankey150.png" alt="">
      </a>
      <div class="captionPortfolio">Sankey</div>
    </div>
    <div class="col-md-2 col-sm-4 portfolio-item">
      <a class="portfolio-link"  href="https://www.data-to-viz.com/graph/arc.html">
        <div class="portfolio-hover">
          <div class="portfolio-hover-content">
            <i class="fa fa-plus fa-3x"></i>
          </div>
        </div>
        <img class="img-fluid" src="img/section/Arc150.png" alt="">
      </a>
      <div class="captionPortfolio">Arc diagram</div>
    </div>
    <div class="col-md-2 col-sm-4 portfolio-item">
      <a class="portfolio-link"  href="hierarchical-edge-bundling.html">
        <div class="portfolio-hover">
          <div class="portfolio-hover-content">
            <i class="fa fa-plus fa-3x"></i>
          </div>
        </div>
        <img class="img-fluid" src="img/section/Bundle150.png" alt="">
      </a>
      <div class="captionPortfolio">Edge bundling</div>
    </div>
  </div>

</div>
</section>


<!-- ============================ CONTACT SECTION ============================ -->
<section id="contact" class="bg" style="background-color: white; padding-top: 60px">
  <div class="container">
    <div class="row">
      <div class="col-lg-2 text-center"></div>
      <div class="col-lg-8 text-center">
        <br><br><br>
        <h2 class="section-heading text-uppercase" style="color: black">Contact</h2>
        <p>This document is a work by <a href="https://www.yan-holtz.com">Yan Holtz</a>. Any feedback is highly encouraged. You can fill an issue on <a href="https://github.com/holtzy/D3-graph-gallery/issues">Github</a>, drop me a message on <a href="https://twitter.com/R_Graph_Gallery">Twitter</a>, or send an email pasting <a href="">yan.holtz.data</a> with <a href="">gmail.com</a>.</p>
        <div style="text-align:center">
           <a class="btn btn-primary btn-xl text-uppercase js-scroll-trigger" href="https://github.com/holtzy">Github</a>
           <a class="btn btn-primary btn-xl text-uppercase js-scroll-trigger" href="https://twitter.com/R_Graph_Gallery">Twitter</a>
         </div>
      </div>
    </div>
  </div>
</section>


<!-- ============================ FOOTER SECTION ============================ -->
<footer class="bg-light" id="myFooter">
  <div class="container" >
    <div class="row">
      <div class="col-md-4">
        <span class="copyright">Copyright &copy; the R graph gallery 2018</span>
      </div>
      <div class="col-md-4">
        <ul class="list-inline social-buttons">
          <li class="list-inline-item">
            <a href="https://twitter.com/R_Graph_Gallery">
              <i class="fa fa-twitter"></i>
            </a>
          </li>
          <li class="list-inline-item">
            <a href="https://github.com/holtzy">
              <i class="fa fa-github"></i>
            </a>
          </li>
          <li class="list-inline-item">
            <a href="https://www.linkedin.com/in/yan-holtz-2477534a/">
              <i class="fa fa-linkedin"></i>
            </a>
          </li>
        </ul>
      </div>
      <div class="col-md-4">
        <ul class="list-inline quicklinks">
          <li class="list-inline-item">
            <a href="#">Privacy Policy</a>
          </li>
          <li class="list-inline-item">
            <a href="#">Terms of Use</a>
          </li>
        </ul>
      </div>
    </div>
  </div>
</footer>


<script>

// add bootstrap table styles to pandoc tables
function bootstrapStylePandocTables() {
  $('tr.header').parent('thead').parent('table').addClass('table table-condensed');
}
$(document).ready(function () {
  bootstrapStylePandocTables();
});


</script>


<!-- ============================ JAVASCRIPT SECTION ============================ -->

<!-- Bootstrap core JavaScript -->
<script src="vendor/bootstrap/js/bootstrap.bundle.min.js"></script>

<!-- Custom scripts for this template -->
<script src="js/agency.min.js"></script>

</body>
</html>