Most basic with wordcloud2()
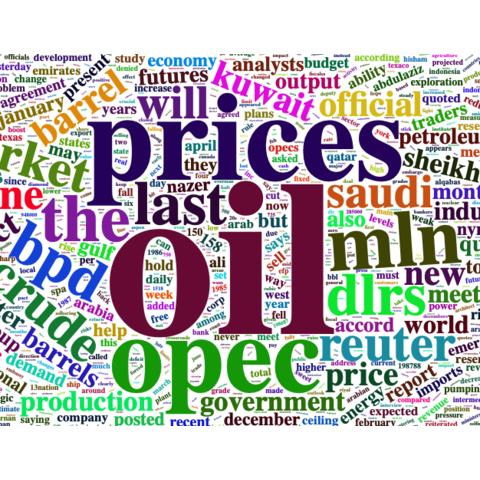
This is the most basic barplot you can build with the wordcloud2 library, using its wordcloud2() function. Note:
datais a data frame including word and freq in each columnsizeis the font size, default is 1.
# library
library(wordcloud2)

# have a look to the example dataset
# head(demoFreq)

# Basic plot
wordcloud2(data=demoFreq, size=1.6)
Color & Background color
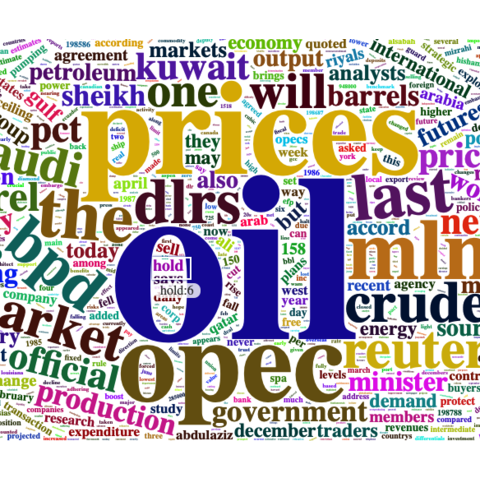
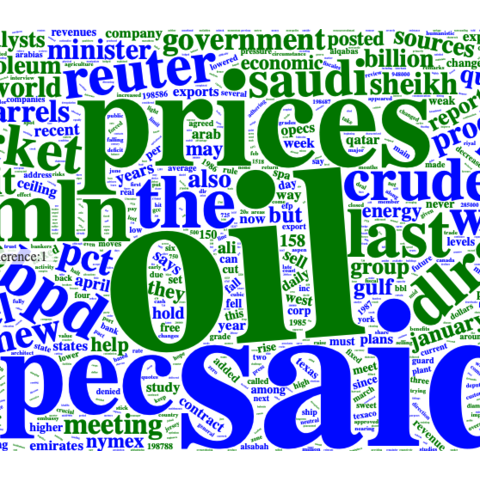
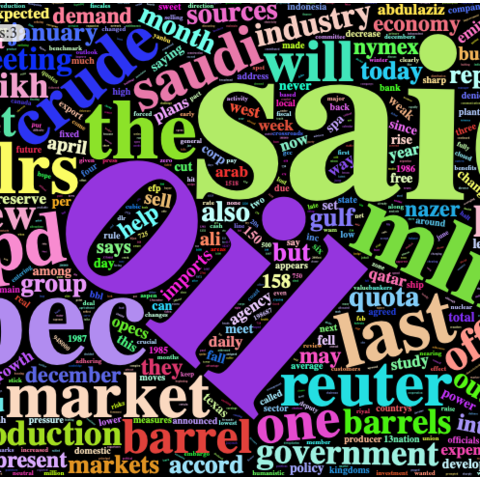
It is possible to change the word color using the color argument. You can provide a vector of color, or use random-dark or random-light. You can also customize the background color with backgroundColor.
# library
library(wordcloud2)

# Gives a proposed palette
wordcloud2(demoFreq, size=1.6, color='random-dark')

# or a vector of colors. vector must be same length than input data
wordcloud2(demoFreq, size=1.6, color=rep_len( c("green","blue"), nrow(demoFreq) ) )

# Change the background color
wordcloud2(demoFreq, size=1.6, color='random-light', backgroundColor="black")
Shape
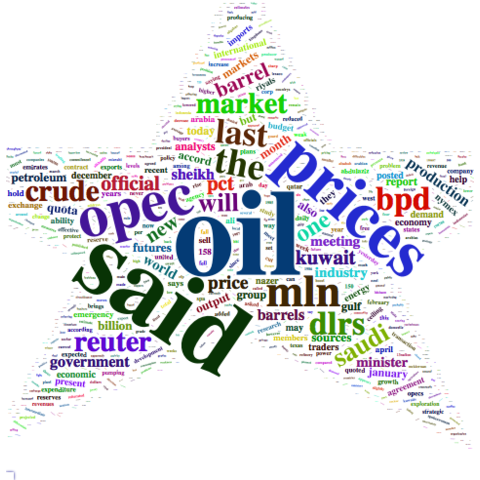
You can custom the wordcloud shape using the shape argument. Available shapes are:
circlecardioiddiamondtriangle-forwardtrianglepentagonstar
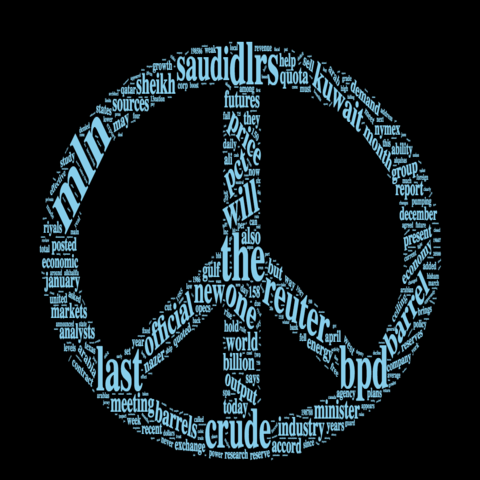
You can also use an image like this one as a mask.
# library
library(wordcloud2)

# Change the shape:
wordcloud2(demoFreq, size = 0.7, shape = 'star')

# Change the shape using your image
wordcloud2(demoFreq, figPath = "~/Desktop/R-graph-gallery/img/other/peaceAndLove.jpg", size = 1.5, color = "skyblue", backgroundColor="black")
Word orientation
Rotate words with 3 arguments: minRotation, maxRotation and rotateRatio.
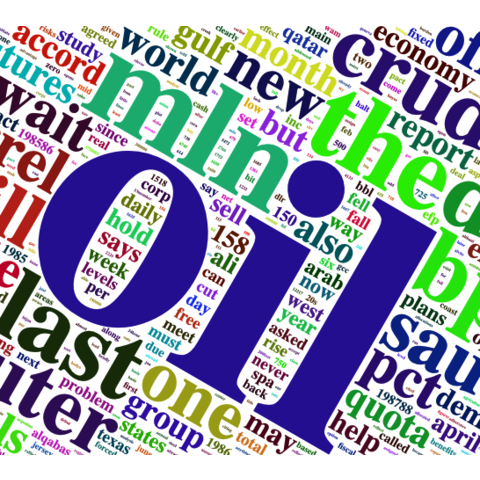
# library
library(wordcloud2)

# wordcloud
wordcloud2(demoFreq, size = 2.3, minRotation = -pi/6, maxRotation = -pi/6, rotateRatio = 1)
Chinese version
Chinese version. Comes from the doc.
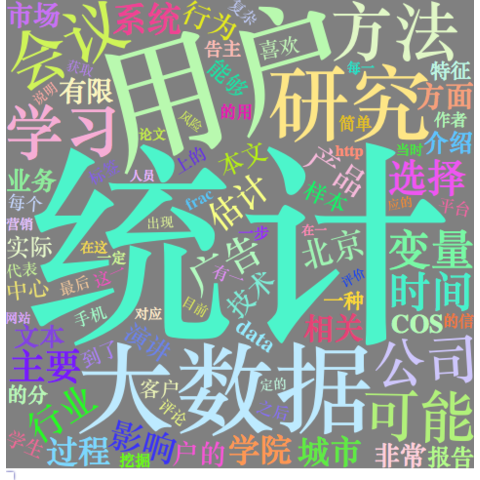
# library
library(wordcloud2)

# wordcloud
wordcloud2(demoFreqC, size = 2, fontFamily = "????????????", color = "random-light", backgroundColor = "grey")
Use letter or text as shape
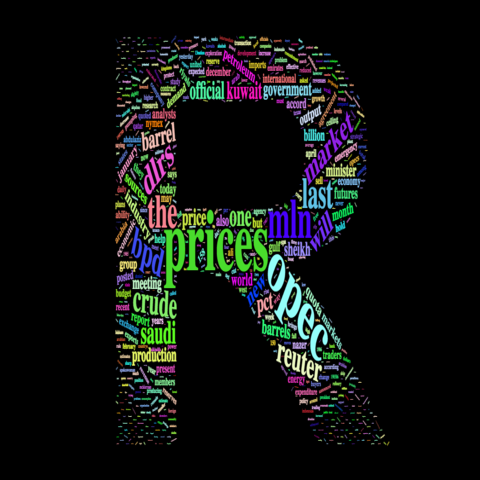

The letterCloud function allows to use a letter or a word as a mask for the wordcloud:
# library
library(wordcloud2)

letterCloud( demoFreq, word = "R", color='random-light' , backgroundColor="black")
letterCloud( demoFreq, word = "PEACE", color="white", backgroundColor="pink")
Export the wordcloud
Wordcloud2 is a html widget. It means your wordcloud will be output in a HTML format.
You can export it as a png image using rstudio, or using the webshot library as follow:
# load wordcloud2
library(wordcloud2)

# install webshot
library(webshot)
webshot::install_phantomjs()

# Make the graph
my_graph <- wordcloud2(demoFreq, size=1.5)

# save it in html
library("htmlwidgets")
saveWidget(my_graph,"tmp.html",selfcontained = F)

# and in png or pdf
webshot("tmp.html","fig_1.pdf", delay =5, vwidth = 480, vheight=480)


