Start basic: the barplot() function
This is the most basic barplot you can build with R and the barplot() funtion. It was described in graph #208.
This post describes how to custom this basic barplot.

# create dummy data
data <- data.frame(
  name=letters[1:5],
  value=sample(seq(4,15),5)
)

# The most basic barplot you can do:
barplot(height=data$value, names=data$name)
Custom color

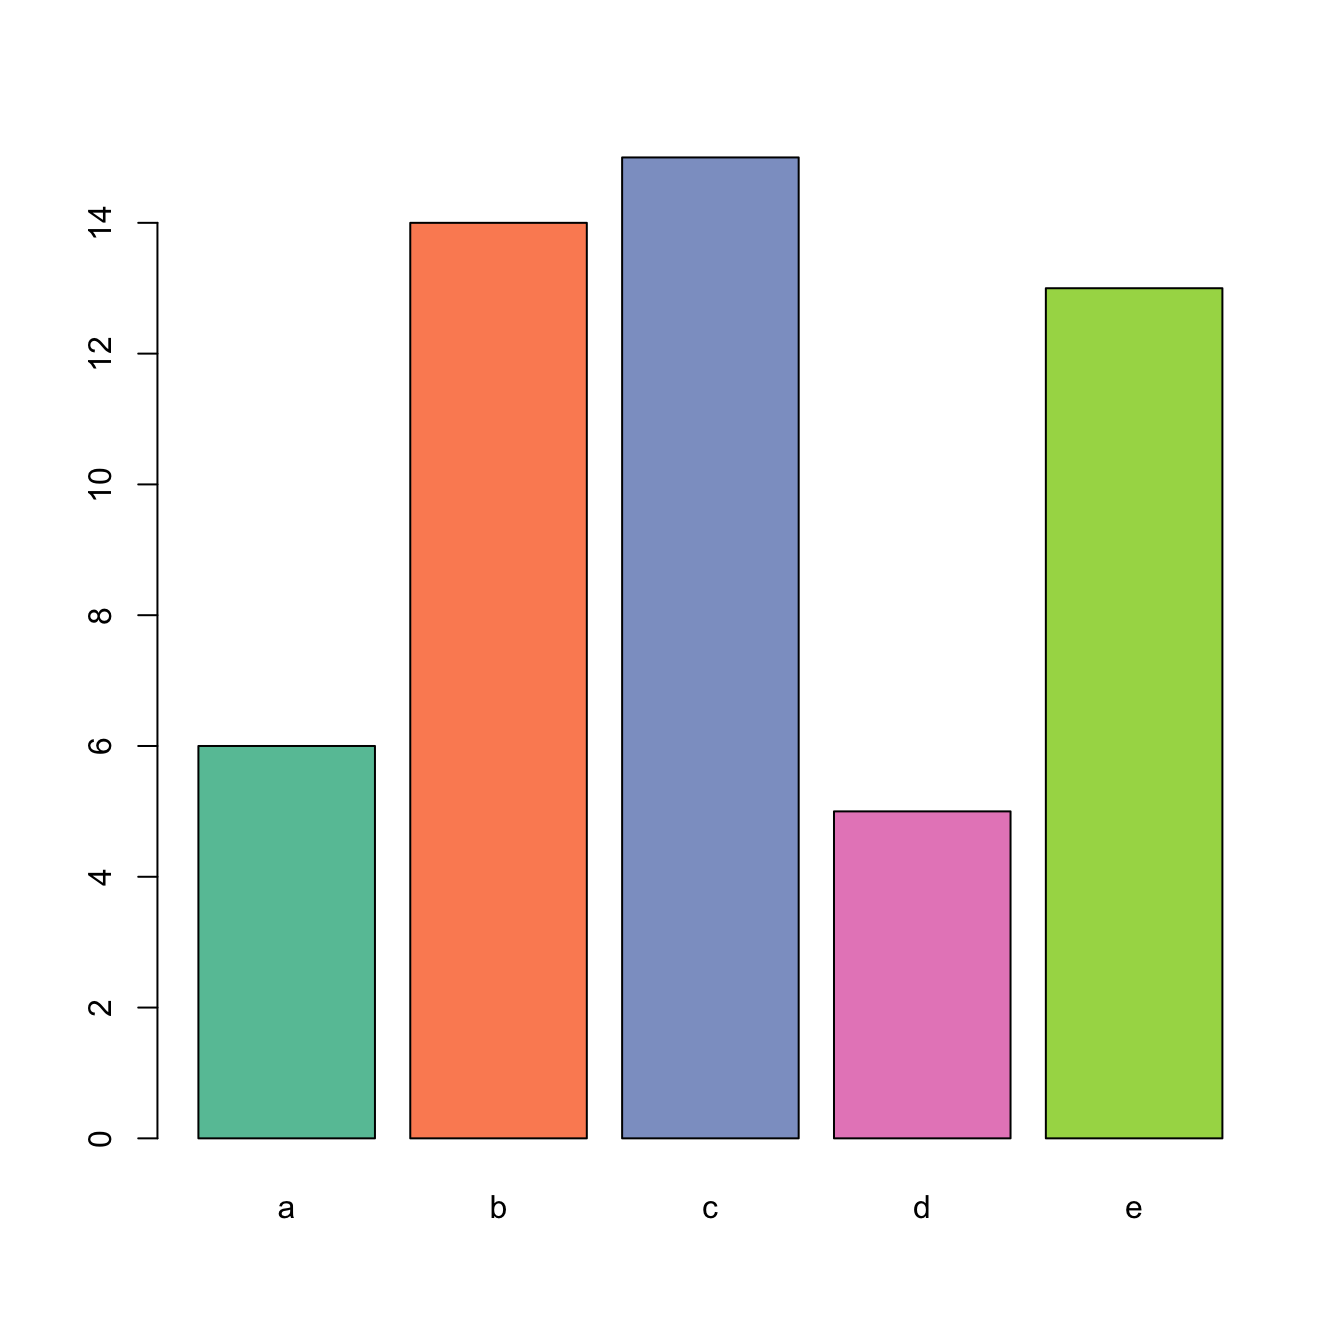
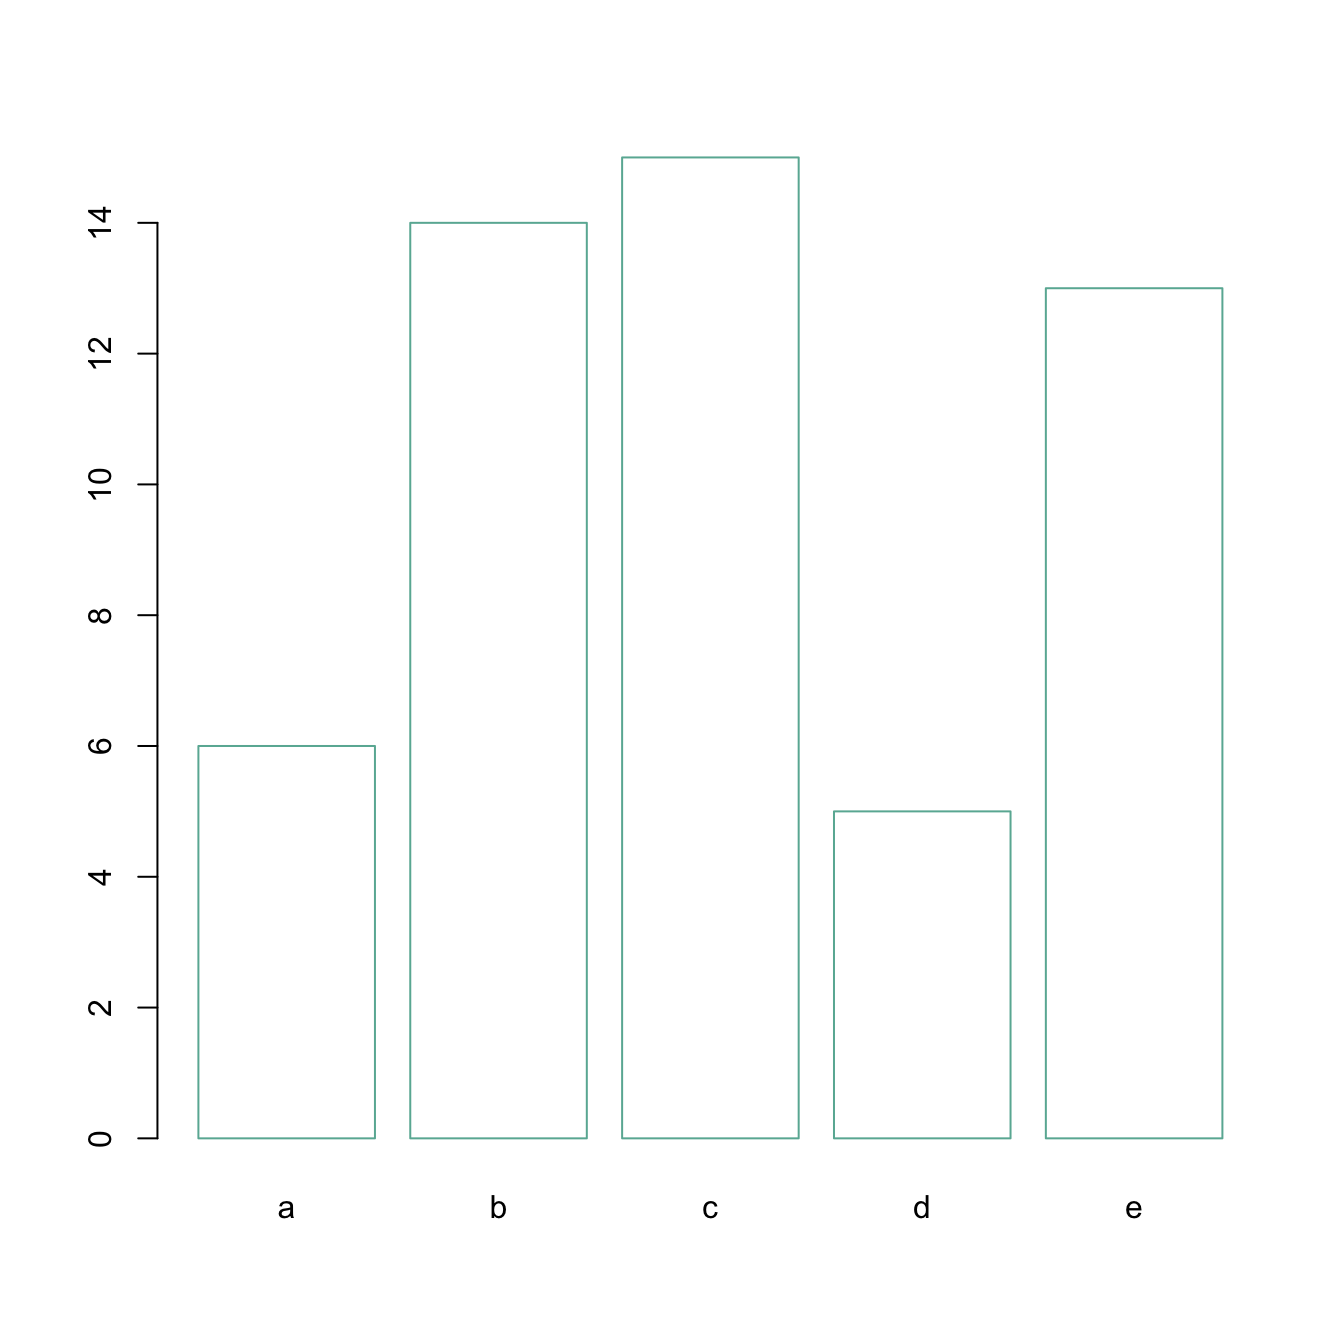 Here are 2 examples showing how to custom the barplot color:
- uniform color with
col, asking one color only - using a palette coming from
RColorBrewer - change border color with the
borderargument
# create dummy data
data <- data.frame(
  name=letters[1:5],
  value=sample(seq(4,15),5)
)

# Uniform color
barplot(height=data$value, names=data$name, col=rgb(0.2,0.4,0.6,0.6) )

# Specific color for each bar? Use a well known palette
library(RColorBrewer)
coul <- brewer.pal(5, "Set2")
barplot(height=data$value, names=data$name, col=coul )

# Change border color
barplot(height=data$value, names=data$name, border="#69b3a2", col="white" )
Title, Axis label, Custom limits
Usual customizations with xlab, ylab, main and ylim.

# create dummy data
data <- data.frame(
  name=letters[1:5],
  value=sample(seq(4,15),5)
)

# Uniform color
barplot(height=data$value, names=data$name,
        col=rgb(0.8,0.1,0.1,0.6),
        xlab="categories",
        ylab="values",
        main="My title",
        ylim=c(0,40)
        )
Horizontal barplot
Usual customizations with xlab, ylab, main and ylim.

# create dummy data
data <- data.frame(
  name=letters[1:5],
  value=sample(seq(4,15),5)
)

# Uniform color
barplot(height=data$value, names=data$name,
        col="#69b3a2",
        horiz=T, las=1
        )
Bar width & space between bars
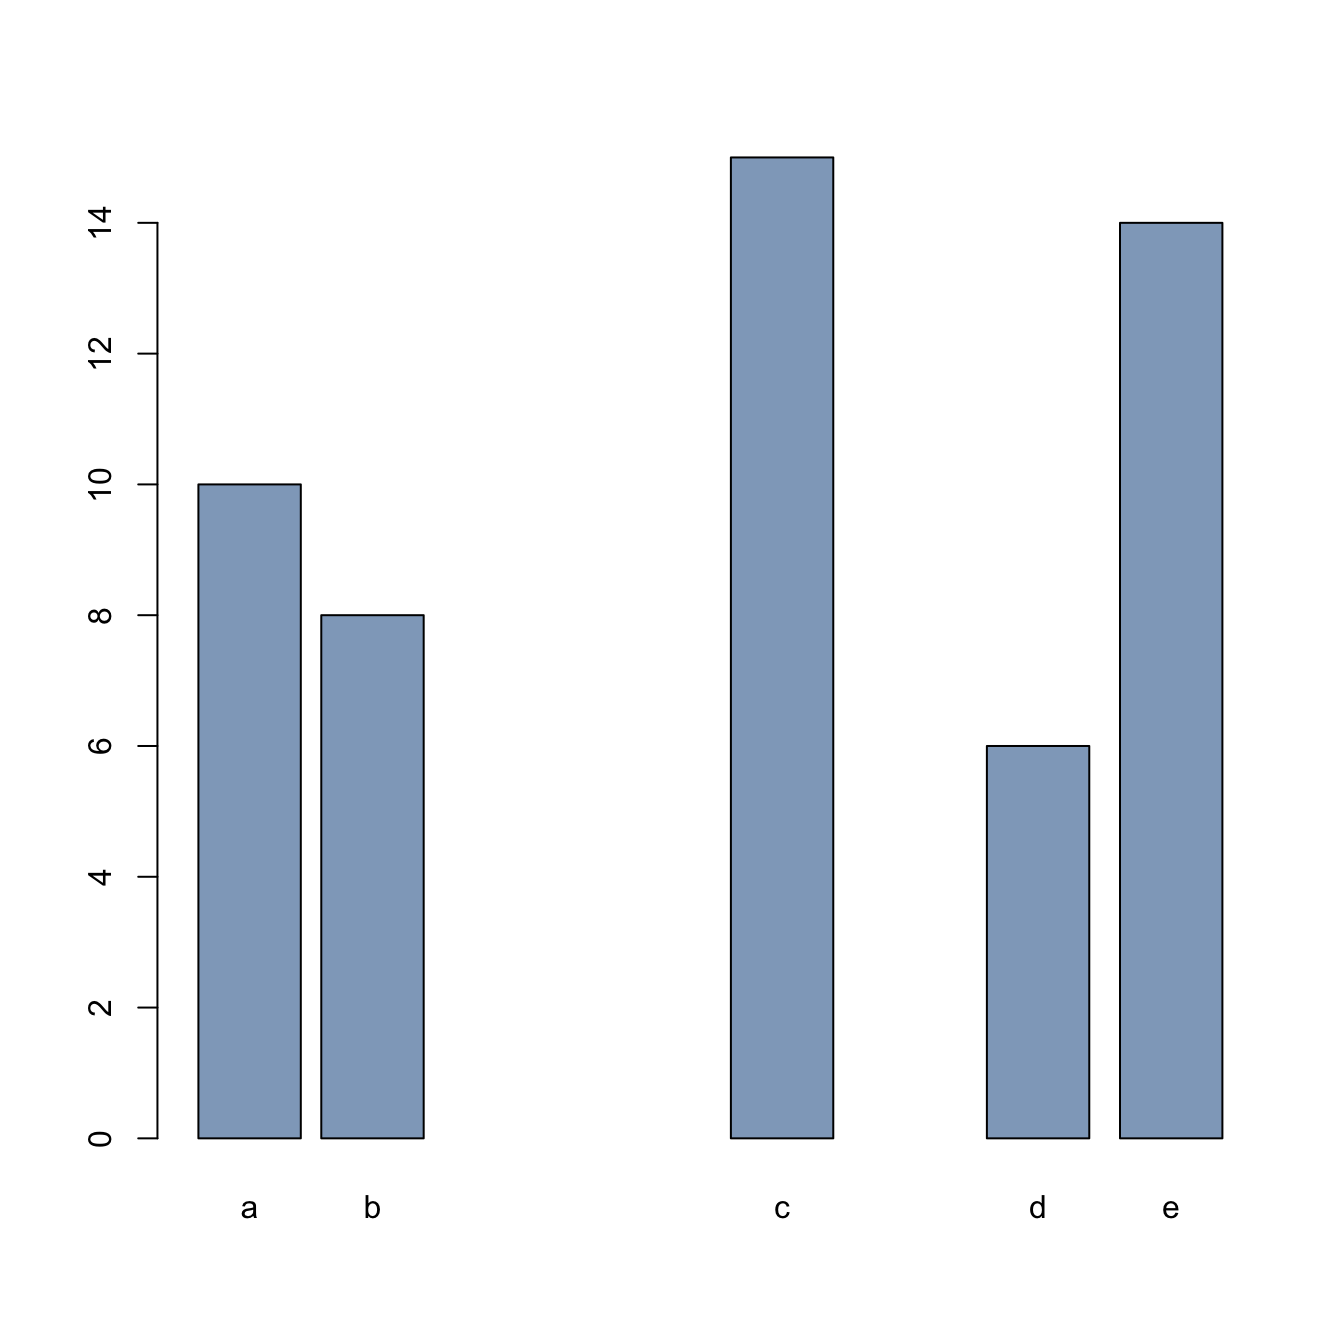
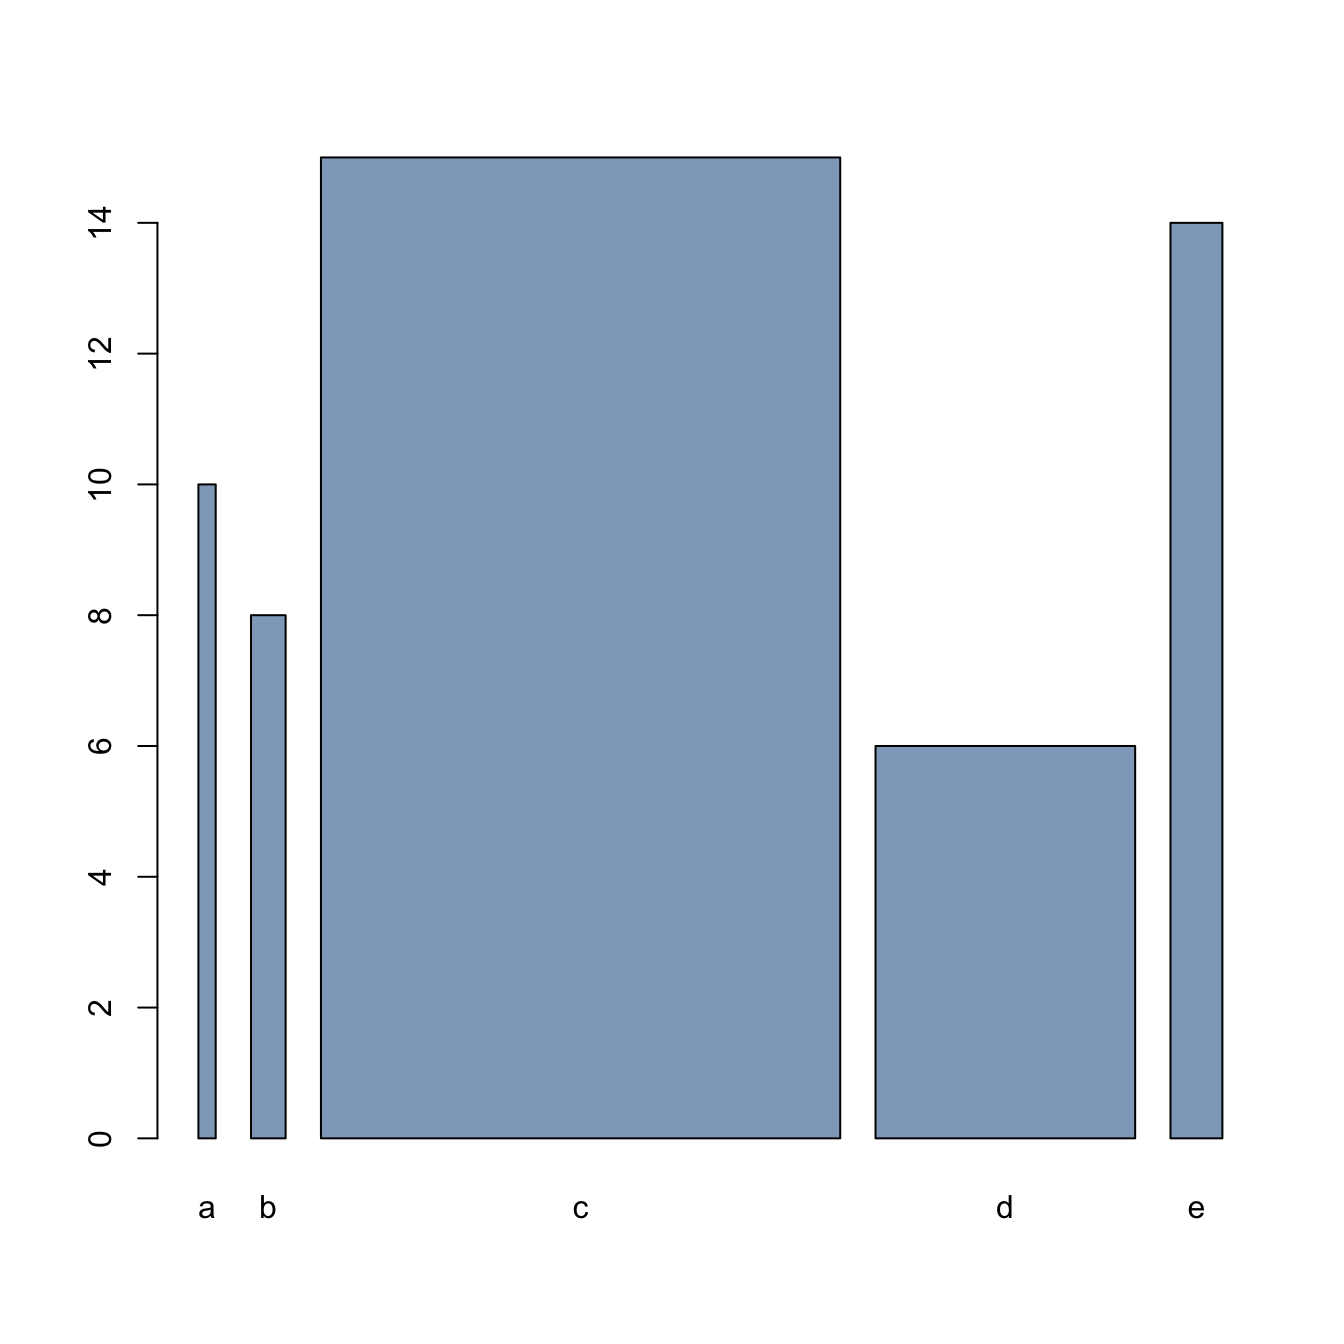
It is possible to control the space between bars and the width of the bars using space and width.
Can be usefull to represent the number of value behind each bar.
# create dummy data
data <- data.frame(
  name=letters[1:5],
  value=sample(seq(4,15),5)
)

# Control space:
barplot(height=data$value, names=data$name, col=rgb(0.2,0.4,0.6,0.6), space=c(0.1,0.2,3,1.5,0.3) )

# Control width:
barplot(height=data$value, names=data$name, col=rgb(0.2,0.4,0.6,0.6), width=c(0.1,0.2,3,1.5,0.3) )
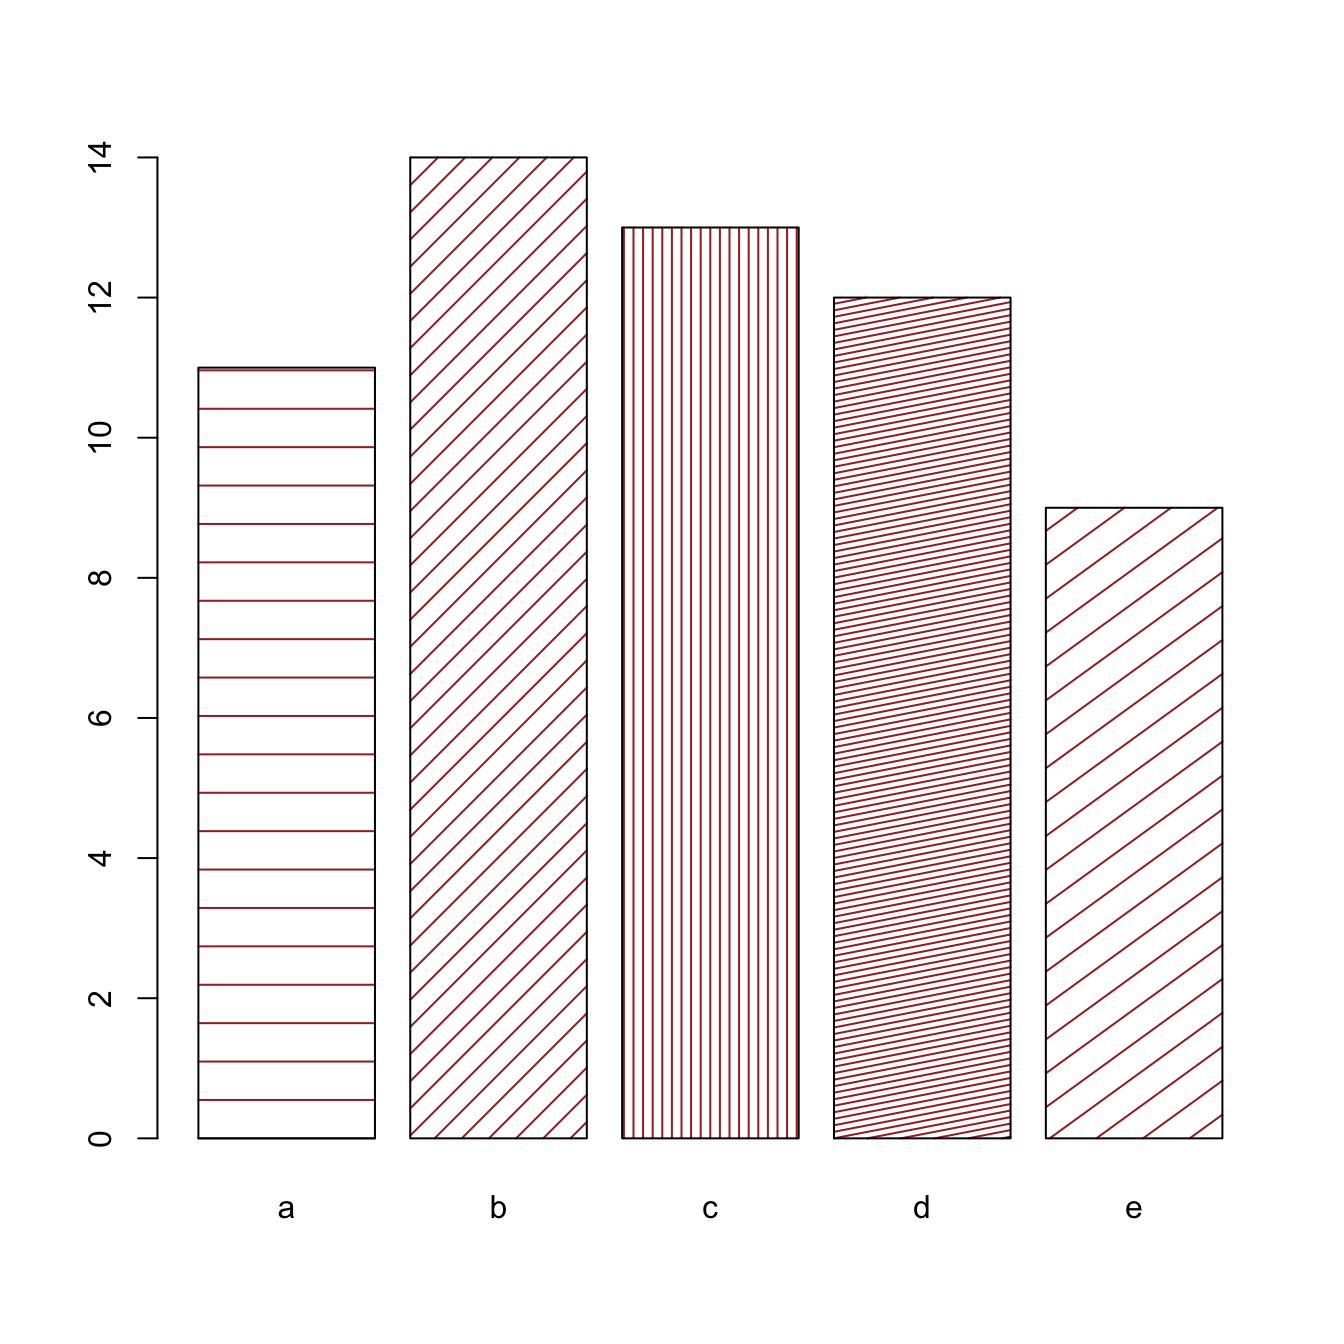
Barplot texture
Change bar texture with the density and angle arguments.
# create dummy data
data <- data.frame(
  name=letters[1:5],
  value=sample(seq(4,15),5)
)

# barplot
barplot( height=data$value, names=data$name , density=c(5,10,20,30,7) , angle=c(0,45,90,11,36) , col="brown"   )


