<!DOCTYPE html> <html lang="en"> <head> <meta charset="utf-8"> <title>Introduction to the circlize package – the R Graph Gallery</title> <meta http-equiv="Content-Type" content="text/html; charset=utf-8" /> <meta name="generator" content="pandoc" /> <meta name="viewport" content="width=device-width, initial-scale=1, shrink-to-fit=no"> <meta name="description" content="This post is an introductioni to the circlize package: the ultimate way to build circular charts with R. It shows how to initialize a circular section and fill it with a scatterplot."> <meta name="keywords" content="R,ggplot2,tidyverse,Example,Data,Dataviz,Datavisualization,Plot,Chart,Graph,Learning,Caveat,Pitfall,Mistake"> <meta name="author" content="Yan Holtz"> <link rel="icon" href="img/logo/R_single_small.png"> <!-- Control appearance when shared by social media --> <meta property="og:title" content="Introduction to the circlize package" /> <meta property="og:image" content="https://github.com/holtzy/R-graph-gallery/raw/master/img/logo/R_single_big.png" /> <meta property="og:description" content="This post is an introductioni to the circlize package: the ultimate way to build circular charts with R. It shows how to initialize a circular section and fill it with a scatterplot." /> <meta property='og:url' content="https://www.r-graph-gallery.com/224-basic-circular-plot.html" /> <meta property="og:type" content="website" /> <!-- Bootstrap core CSS --> <link href="vendor/bootstrap/css/bootstrap.min.css" rel="stylesheet"> <!-- Custom fonts for this template --> <link href="vendor/font-awesome/css/font-awesome.min.css" rel="stylesheet" type="text/css"> <!-- Custom styles for this template --> <link href="css/agency.css" rel="stylesheet"> <!-- JQUERY --> <script src="vendor/jquery/jquery.min.js"></script> </head> <body data-spy="scroll" data-target="#myScrollspy" data-offset="1"> <!-- THIS ALLOWS TO INSERT THE MENU --> <nav class="navbar navbar-expand-lg fixed-top" id="mainNav"> <div class="container"> <a href="index.html">← R Graph Gallery</a> <button class="navbar-toggler navbar-toggler-right" type="button" data-toggle="collapse" data-target="#navbarResponsive" aria-controls="navbarResponsive" aria-expanded="false" aria-label="Toggle navigation"> Menu <i class="fa fa-bars"></i> </button> <div class="collapse navbar-collapse" id="navbarResponsive"> <ul class="navbar-nav text-uppercase ml-auto"> <li class="nav-item"> <a class="nav-link" data-toggle="modal" href="#researchModal"><i class="fa fa-search"></i></a> </li> <li class="nav-item"> <a class="nav-link" data-toggle="modal" href="#LogoMenu">Chart types</a> </li> <li class="nav-item dropdown"> <a class="nav-link" href="#" id="navbarDropdown" role="button" data-toggle="dropdown" aria-haspopup="true" aria-expanded="false"> Quick </a> <div class="dropdown-menu" aria-labelledby="navbarDropdown"> <p class="menuTitle"><i>Basics</i></p> <div class="dropdown-divider"></div> <a class="dropdown-item" href="https://www.d3-graph-gallery.com/intro_d3js.html">Intro to d3</a> <a class="dropdown-item" href="https://www.d3-graph-gallery.com/graph/shape.html">Shape</a> <a class="dropdown-item" href="https://www.d3-graph-gallery.com/graph/basic_datamanipulation.html">Data wrangling</a> <p class="menuTitle"><i>Customize</i></p> <div class="dropdown-divider"></div> <a class="dropdown-item" href="https://www.d3-graph-gallery.com/graph/custom_axis.html">Axis</a> <a class="dropdown-item" href="https://www.d3-graph-gallery.com/graph/custom_color.html">Color</a> <a class="dropdown-item" href="https://www.d3-graph-gallery.com/graph/custom_theme.html">Themes</a> <a class="dropdown-item" href="https://www.d3-graph-gallery.com/graph/custom_legend.html">Legend</a> <a class="dropdown-item" href="https://www.d3-graph-gallery.com/graph/custom_responsive.html">Responsivness</a> <p class="menuTitle"><i>Interactivity</i></p> <div class="dropdown-divider"></div> <a class="dropdown-item" href="https://www.d3-graph-gallery.com/graph/interactivity_tooltip.html">Tooltip</a> <a class="dropdown-item" href="https://www.d3-graph-gallery.com/graph/interactivity_button.html">Button</a> <a class="dropdown-item" href="https://www.d3-graph-gallery.com/graph/interactivity_zoom.html">Zoom</a> <a class="dropdown-item" href="https://www.d3-graph-gallery.com/graph/interactivity_brush.html">Brushing</a> <a class="dropdown-item" href="https://www.d3-graph-gallery.com/interactivity.html">Transition</a> </div> </li> <li class="nav-item"> <a class="nav-link" href="../all.html">ALL</a> </li> <li class="nav-item"> <a class="nav-link" href="https://www.r-graph-gallery.com">R</a> </li> <li class="nav-item"> <a class="nav-link" href="https://www.python-graph-gallery.com">Python</a> </li> <li class="nav-item"> <a class="nav-link js-scroll-trigger" href="https://www.data-to-viz.com">Data to viz</a> </li> <li class="nav-item"> <a class="nav-link js-scroll-trigger" href="https://www.yan-holtz.com">Who am I</a> </li> <li class="nav-item"> <a class="nav-link js-scroll-trigger" href="about.html">About</a> </li> </ul> </div> </div> </nav> <!-- Header = Title in big + social media Icon + quick description --> <header class="masthead"> <div class="textlanding"> <center><h1>Introduction to the circlize package</h1></center> <hr class="short_hr"> <br> <ul class="list-inline social-buttons"> <li class="list-inline-item"> <a href="https://twitter.com/R_Graph_Gallery"> <i class="fa fa-twitter"></i> </a> </li> <li class="list-inline-item social-buttons"> <a href="https://github.com/holtzy"> <i class="fa fa-github" style="color: white"></i> </a> </li> <li class="list-inline-item social-buttons"> <a href="https://www.linkedin.com/in/yan-holtz-2477534a/"> <i class="fa fa-linkedin"></i> </a> </li> <li class="list-inline-item social-buttons"> <a href="https://www.yan-holtz.com"> <i class="fa fa-home"></i> </a> </li> </ul> <center><p style="max-width: 600px; margin-top: 40px">This post is an introductioni to the <code>circlize</code> package: the ultimate way to build <a href="chord-diagram.html">circular charts</a> with R. It shows how to initialize a circular section and fill it with a <a href="scatterplot.html">scatterplot</a>.</p></center> <div style="text-align:center"> <a class="btn btn-secondary btn-xl text-uppercase js-scroll-trigger" href='chord-diagram.html'>Chord section</a> <a class="btn btn-secondary btn-xl text-uppercase js-scroll-trigger" href='https://www.data-to-viz.com/graph/chord.html'>Data to Viz</a> </div> </div> </header> <!-- STYLE for chart pages but not the rest of tthe website --> <style> img { margin-top: 20px; } </style> <div class="container" style="padding-top: 80px"> <p>
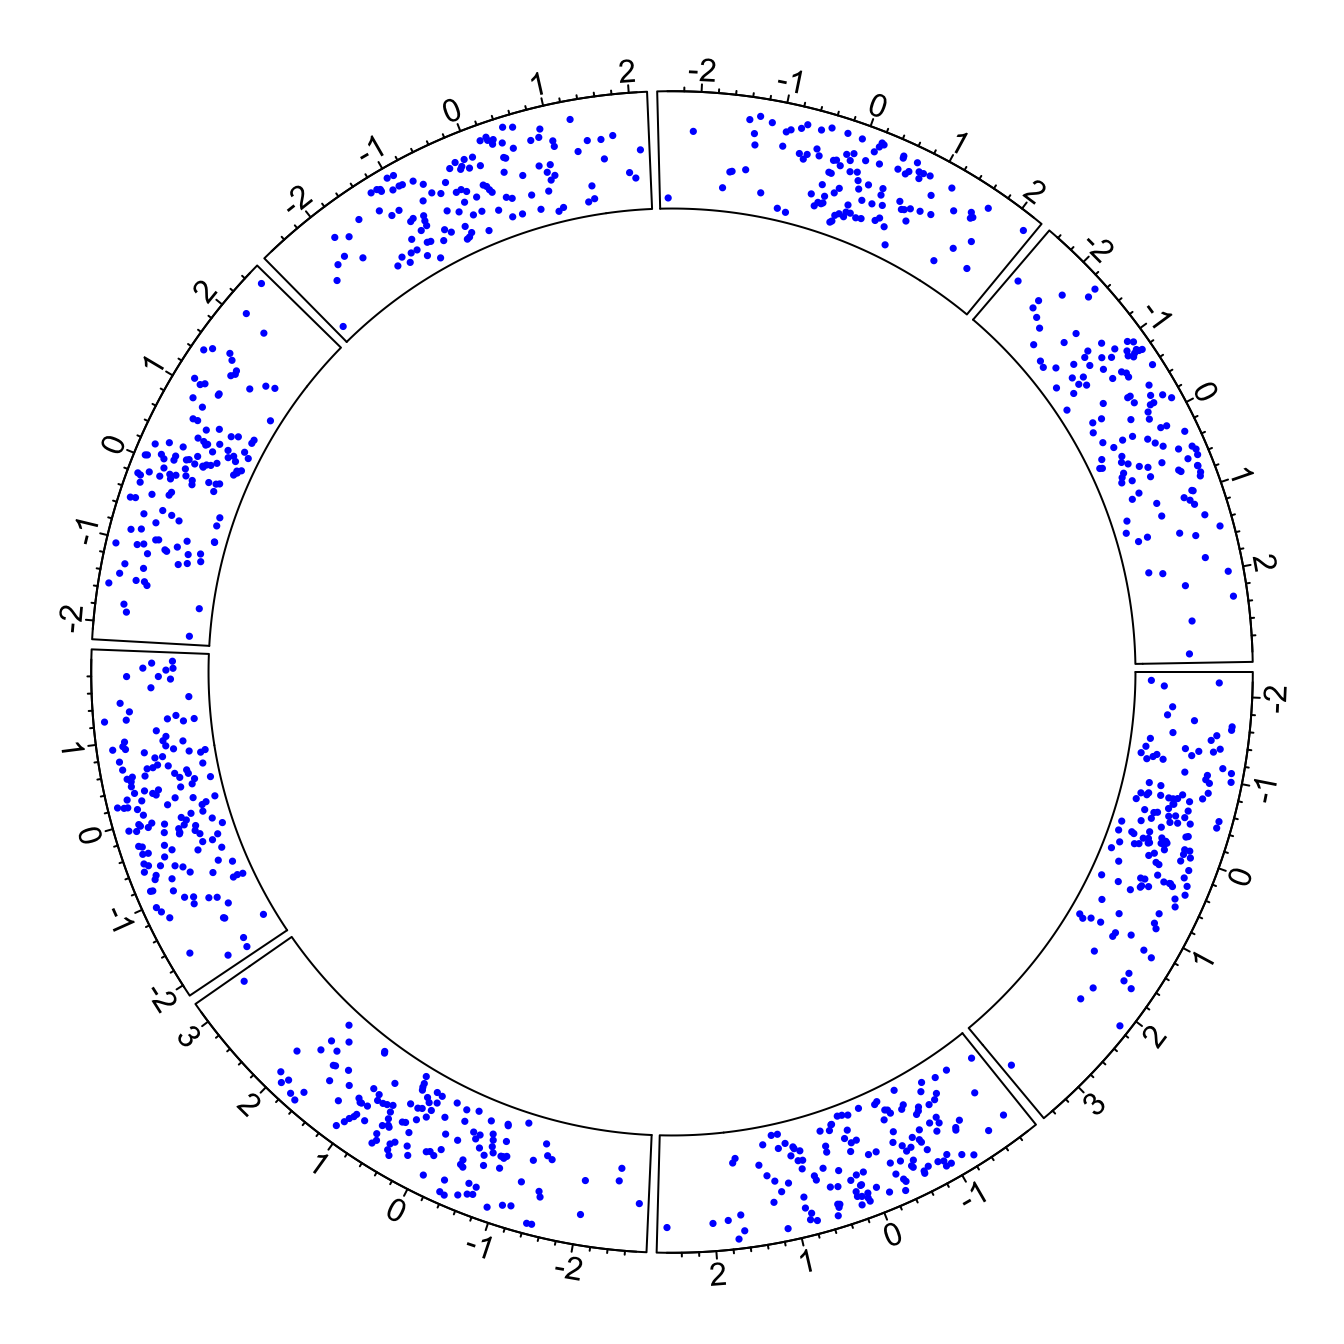
In R, circular plots are made using the <code>circlize</code> package. Circular plots are composed by several regions (8 here), each representing a level of a factor. Three steps are required to build a circular plot:</p> <div class="row"> <div class="col-md-6 col-sm-12 align-self-center"> <ul> <li><p><em>Step 1</em>: Initialize the chart with <code>circos.initialize()</code>. Provide the factor vector, and the numeric values to use for the X axis. The circle will be split in as many zone as the number of levels present in your factor. Each region will be as long as the coresponding x axis.</p></li> <li><p><em>Step2</em>: Build the regions with <code>circos.trackPlotRegion()</code>. You have to specify the factors once again, and tell what to use for the Y axis if needed.</p></li> <li><p><em>Step3</em>: Add a chart in each region. Here <code>circos.trackPoints()</code> is used to build a scatterplot. See <a href="226-plot-types-for-circular-plot.html">chart #226</a> for other chart types.</p></li> </ul> </div> <div class="col-md-6 col-sm-12"> <p><img src="224-basic-circular-plot_files/figure-html/thecode-1.png" width="100%" /></p> </div> </div> <div class="sourceCode" id="cb1"><pre class="sourceCode r"><code class="sourceCode r"><a class="sourceLine" id="cb1-1" data-line-number="1"><span class="co"># Upload library</span></a> <a class="sourceLine" id="cb1-2" data-line-number="2"><span class="kw">library</span>(circlize)</a> <a class="sourceLine" id="cb1-3" data-line-number="3"> </a> <a class="sourceLine" id="cb1-4" data-line-number="4"><span class="co"># Create data</span></a> <a class="sourceLine" id="cb1-5" data-line-number="5">data =<span class="st"> </span><span class="kw">data.frame</span>(</a> <a class="sourceLine" id="cb1-6" data-line-number="6"> <span class="dt">factor =</span> <span class="kw">sample</span>(letters[<span class="dv">1</span><span class="op">:</span><span class="dv">8</span>], <span class="dv">1000</span>, <span class="dt">replace =</span> <span class="ot">TRUE</span>),</a> <a class="sourceLine" id="cb1-7" data-line-number="7"> <span class="dt">x =</span> <span class="kw">rnorm</span>(<span class="dv">1000</span>), </a> <a class="sourceLine" id="cb1-8" data-line-number="8"> <span class="dt">y =</span> <span class="kw">runif</span>(<span class="dv">1000</span>)</a> <a class="sourceLine" id="cb1-9" data-line-number="9"> )</a> <a class="sourceLine" id="cb1-10" data-line-number="10"> </a> <a class="sourceLine" id="cb1-11" data-line-number="11"><span class="co"># Step1: Initialise the chart giving factor and x-axis.</span></a> <a class="sourceLine" id="cb1-12" data-line-number="12"><span class="kw">circos.initialize</span>( <span class="dt">factors=</span>data<span class="op">$</span>factor, <span class="dt">x=</span>data<span class="op">$</span>x )</a> <a class="sourceLine" id="cb1-13" data-line-number="13"> </a> <a class="sourceLine" id="cb1-14" data-line-number="14"><span class="co"># Step 2: Build the regions. </span></a> <a class="sourceLine" id="cb1-15" data-line-number="15"><span class="kw">circos.trackPlotRegion</span>(<span class="dt">factors =</span> data<span class="op">$</span>factor, <span class="dt">y =</span> data<span class="op">$</span>y, <span class="dt">panel.fun =</span> <span class="cf">function</span>(x, y) {</a> <a class="sourceLine" id="cb1-16" data-line-number="16"> <span class="kw">circos.axis</span>()</a> <a class="sourceLine" id="cb1-17" data-line-number="17"> })</a> <a class="sourceLine" id="cb1-18" data-line-number="18"> </a> <a class="sourceLine" id="cb1-19" data-line-number="19"><span class="co"># Step 3: Add points</span></a> <a class="sourceLine" id="cb1-20" data-line-number="20"><span class="kw">circos.trackPoints</span>(data<span class="op">$</span>factor, data<span class="op">$</span>x, data<span class="op">$</span>y, <span class="dt">col =</span> <span class="st">"blue"</span>, <span class="dt">pch =</span> <span class="dv">16</span>, <span class="dt">cex =</span> <span class="fl">0.5</span>) </a></code></pre></div> <!-- Close container --> </div> <!-- ============================ RELATED SECTION ============================ --> <section class="bg-light" id="portfolio_landing" style="padding-top: 30px; padding-bottom: 30px; margin-top: 100px;"> <div class="container"> <p class="mySeryTitle">Related chart types</p> <hr> <div class="row"> <div class="col-md-2 col-sm-4 portfolio-item"> <a class="portfolio-link" href="chord-diagram.html"> <div class="portfolio-hover"> <div class="portfolio-hover-content"> <i class="fa fa-plus fa-3x"></i> </div> </div> <img class="img-fluid" src="img/section/Chord150.png" alt=""> </a> <div class="captionPortfolio">Chord diagram</div> </div> <div class="col-md-2 col-sm-4 portfolio-item"> <a class="portfolio-link" href="network.html"> <div class="portfolio-hover"> <div class="portfolio-hover-content"> <i class="fa fa-plus fa-3x"></i> </div> </div> <img class="img-fluid" src="img/section/Network150.png" alt=""> </a> <div class="captionPortfolio">Network</div> </div> <div class="col-md-2 col-sm-4 portfolio-item"> <a class="portfolio-link" href="sankey-diagram.html"> <div class="portfolio-hover"> <div class="portfolio-hover-content"> <i class="fa fa-plus fa-3x"></i> </div> </div> <img class="img-fluid" src="img/section/Sankey150.png" alt=""> </a> <div class="captionPortfolio">Sankey</div> </div> <div class="col-md-2 col-sm-4 portfolio-item"> <a class="portfolio-link" href="https://www.data-to-viz.com/graph/arc.html"> <div class="portfolio-hover"> <div class="portfolio-hover-content"> <i class="fa fa-plus fa-3x"></i> </div> </div> <img class="img-fluid" src="img/section/Arc150.png" alt=""> </a> <div class="captionPortfolio">Arc diagram</div> </div> <div class="col-md-2 col-sm-4 portfolio-item"> <a class="portfolio-link" href="hierarchical-edge-bundling.html"> <div class="portfolio-hover"> <div class="portfolio-hover-content"> <i class="fa fa-plus fa-3x"></i> </div> </div> <img class="img-fluid" src="img/section/Bundle150.png" alt=""> </a> <div class="captionPortfolio">Edge bundling</div> </div> </div> </div> </section> <!-- ============================ CONTACT SECTION ============================ --> <section id="contact" class="bg" style="background-color: white; padding-top: 60px"> <div class="container"> <div class="row"> <div class="col-lg-2 text-center"></div> <div class="col-lg-8 text-center"> <br><br><br> <h2 class="section-heading text-uppercase" style="color: black">Contact</h2> <p>This document is a work by <a href="https://www.yan-holtz.com">Yan Holtz</a>. Any feedback is highly encouraged. You can fill an issue on <a href="https://github.com/holtzy/D3-graph-gallery/issues">Github</a>, drop me a message on <a href="https://twitter.com/R_Graph_Gallery">Twitter</a>, or send an email pasting <a href="">yan.holtz.data</a> with <a href="">gmail.com</a>.</p> <div style="text-align:center"> <a class="btn btn-primary btn-xl text-uppercase js-scroll-trigger" href="https://github.com/holtzy">Github</a> <a class="btn btn-primary btn-xl text-uppercase js-scroll-trigger" href="https://twitter.com/R_Graph_Gallery">Twitter</a> </div> </div> </div> </div> </section> <!-- ============================ FOOTER SECTION ============================ --> <footer class="bg-light" id="myFooter"> <div class="container" > <div class="row"> <div class="col-md-4"> <span class="copyright">Copyright © the R graph gallery 2018</span> </div> <div class="col-md-4"> <ul class="list-inline social-buttons"> <li class="list-inline-item"> <a href="https://twitter.com/R_Graph_Gallery"> <i class="fa fa-twitter"></i> </a> </li> <li class="list-inline-item"> <a href="https://github.com/holtzy"> <i class="fa fa-github"></i> </a> </li> <li class="list-inline-item"> <a href="https://www.linkedin.com/in/yan-holtz-2477534a/"> <i class="fa fa-linkedin"></i> </a> </li> </ul> </div> <div class="col-md-4"> <ul class="list-inline quicklinks"> <li class="list-inline-item"> <a href="#">Privacy Policy</a> </li> <li class="list-inline-item"> <a href="#">Terms of Use</a> </li> </ul> </div> </div> </div> </footer> <script> // add bootstrap table styles to pandoc tables function bootstrapStylePandocTables() { $('tr.header').parent('thead').parent('table').addClass('table table-condensed'); } $(document).ready(function () { bootstrapStylePandocTables(); }); </script> <!-- ============================ JAVASCRIPT SECTION ============================ --> <!-- Bootstrap core JavaScript --> <script src="vendor/bootstrap/js/bootstrap.bundle.min.js"></script> <!-- Custom scripts for this template --> <script src="js/agency.min.js"></script> </body> </html>