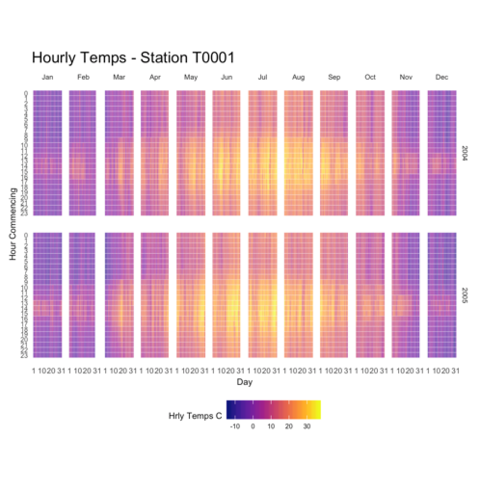
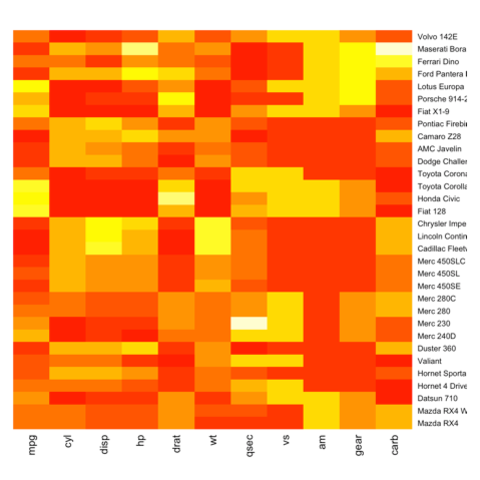
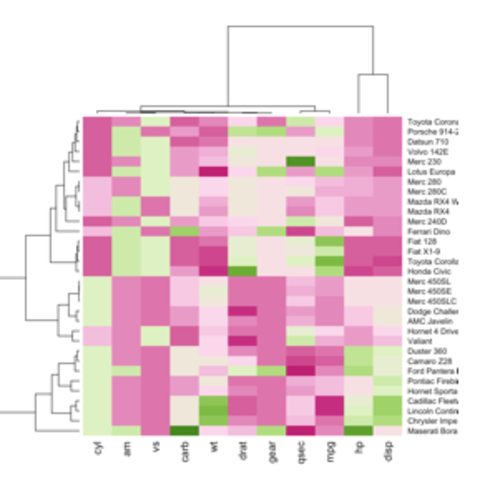
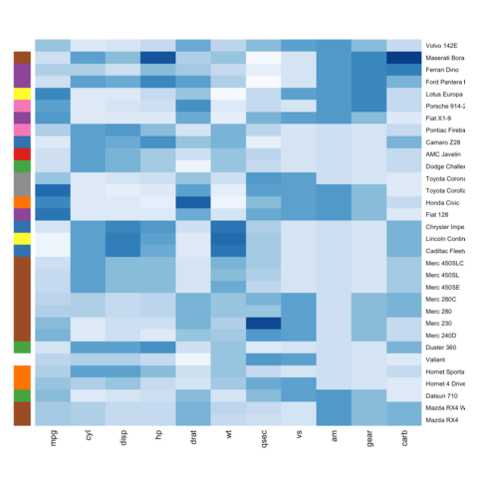
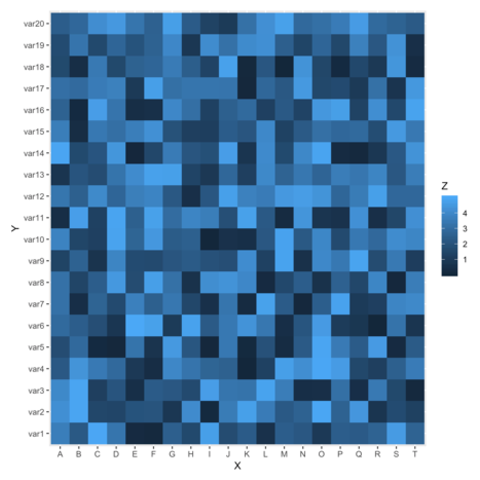
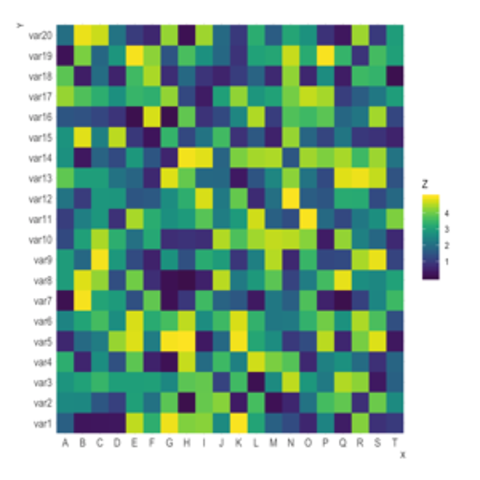
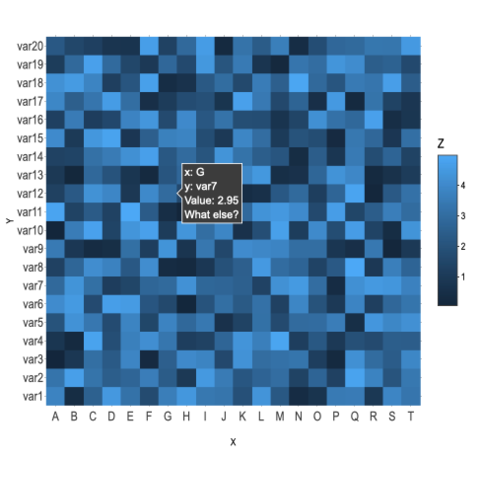
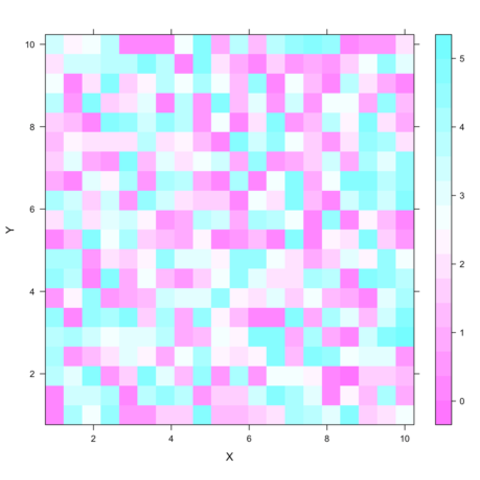
<!DOCTYPE html> <html lang="en"> <head> <!-- Global site tag (gtag.js) - Google Analytics --> <script async src="https://www.googletagmanager.com/gtag/js?id=UA-79254642-6"></script> <script> window.dataLayer = window.dataLayer || []; function gtag(){dataLayer.push(arguments);} gtag('js', new Date()); gtag('config', 'UA-79254642-6'); </script> <meta charset="utf-8"> <title>Heatmap | the R Graph Gallery</title> <meta name="viewport" content="width=device-width, initial-scale=1, shrink-to-fit=no"> <meta name="description" content="A heatmap is a graphical representation of data where the individual values contained in a matrix are represented as colors. This page displays many examples built with R, both static and interactive"> <meta name="keywords" content="Data,Dataviz,Datavisualization,Javascript,D3,D3.js,heatmap"> <meta name="author" content="Yan Holtz"> <link rel="icon" href="img/logo/R_single_small.png"> <meta property="og:title" content="Heatmap | the R Graph Gallery"> <meta property="og:image" content="img/overview_RGG.png"> <meta property="og:description" content="A heatmap is a graphical representation of data where the individual values contained in a matrix are represented as colors. This page displays many examples built with R, both static and interactive"> <!-- Bootstrap core CSS --> <link href="vendor/bootstrap/css/bootstrap.min.css" rel="stylesheet"> <!-- Custom fonts for this template --> <link href="vendor/font-awesome/css/font-awesome.min.css" rel="stylesheet" type="text/css"> <link href="https://fonts.googleapis.com/css?family=Montserrat:400,700" rel="stylesheet" type="text/css"> <link href='https://fonts.googleapis.com/css?family=Kaushan+Script' rel='stylesheet' type='text/css'> <link href='https://fonts.googleapis.com/css?family=Droid+Serif:400,700,400italic,700italic' rel='stylesheet' type='text/css'> <link href='https://fonts.googleapis.com/css?family=Roboto+Slab:400,100,300,700' rel='stylesheet' type='text/css'> <!-- Custom styles for this template --> <link href="css/agency.css" rel="stylesheet"> <!-- JQUERY --> <script src="vendor/jquery/jquery.min.js"></script> </head> <body id="page-top"> <!-- THIS ALLOWS TO INSERT THE MENU THAT IS STORED IN A MENU.HTML FILE--> <nav class="navbar navbar-expand-lg fixed-top" id="mainNav"></nav> <script> $(function(){ $("#mainNav").load("html_chunk/menu.html"); }); </script> <!-- THIS ALLOWS TO INSERT THE MODAL OF THE MENU THAT IS STORED IN A MENU_MODAL.HTML FILE--> <div id="modal_menu_insertion"> </div> <script> $(function(){ $("#modal_menu_insertion").load("html_chunk/menu_modal.html"); }); </script> <!-- Header --> <header class="masthead" style="padding-top: 150px; padding-bottom: 80px"> <div class="textlanding"> <h1>Heatmap</h1> <hr class="short_hr"> <br> <ul class="list-inline social-buttons"> <li class="list-inline-item"> <a href="https://twitter.com/R_Graph_Gallery"> <i class="fa fa-twitter"></i> </a> </li> <li class="list-inline-item social-buttons"> <a href="https://github.com/holtzy"> <i class="fa fa-github" style="color: white"></i> </a> </li> <li class="list-inline-item social-buttons"> <a href="https://www.linkedin.com/in/yan-holtz-2477534a/"> <i class="fa fa-linkedin"></i> </a> </li> <li class="list-inline-item social-buttons"> <a href="https://www.yan-holtz.com"> <i class="fa fa-home"></i> </a> </li> </ul> <br><br> <p style="max-width: 700px; margin: auto">A <a href="https://www.data-to-viz.com/graph/heatmap.html">heatmap</a> is a graphical representation of data where the individual values contained in a matrix are represented as colors. This page displays many examples built with R, both static and interactive.</p> </div> </header> <!-- THIS ALLOWS TO INSERT THE ADVERTISEMENT BANNER THAT IS STORED IN A BANNER.HTML FILE--> <div id="position_for_images"> </div> <script> $(function(){ $("#position_for_images").load("html_chunk/images.html"); }); </script> <!-- ======================== PORTFOLIO SECTION ============================ --> <!-- Images must be 480 x 480, resize them with ./script_reformat_img.sh output_name.png --> <section class="bg" id="portfolio" style="padding-top: 10px"> <div class="container"> <div class="mySeryTitle">Using the <code>heatmap()</code> function</div> <hr> <p>The <code>heatmap()</code> function is natively provided in R. It produces high quality matrix and offers statistical tools to normalize input data, run clustering algorithm and visualize the result with dendrograms. It is one of the very rare case where I prefer base R to <code>ggplot2</code>. <div id="portfolio-items" class="row"> <div class="col-md-4 col-sm-6 portfolio-item"> <a class="portfolio-link" href="215-the-heatmap-function.html"> <div class="portfolio-hover"> <div class="portfolio-hover-content"> <p>Most basic heatmap</p> <hr> <p class="explanation_portfolio">The most basic heatmap you can build with R, using the heatmap() function.</p> </div> </div> <img class="img-fluid imgOfPortfolio" src="img/graph/215-the-heatmap-function1.png" alt=""> </a> </div> <div class="col-md-4 col-sm-6 portfolio-item"> <a class="portfolio-link" href="215-the-heatmap-function.html"> <div class="portfolio-hover"> <div class="portfolio-hover-content"> <p>Control color</p> <hr> <p class="explanation_portfolio">Control the color palette used in the heatmap. Several methods shown.</p> </div> </div> <img class="img-fluid imgOfPortfolio" src="img/graph/215-the-heatmap-function2.png" alt=""> </a> </div> <div class="col-md-4 col-sm-6 portfolio-item"> <a class="portfolio-link" href="215-the-heatmap-function.html"> <div class="portfolio-hover"> <div class="portfolio-hover-content"> <p>Color scheme on the side</p> <hr> <p class="explanation_portfolio">Add color beside the heatmap to compare actual structure with the expected one.</p> </div> </div> <img class="img-fluid imgOfPortfolio" src="img/graph/215-the-heatmap-function3.png" alt=""> </a> </div> </div> <br><br><br><br> <div class="mySeryTitle">Using <code>geom_tile()</code> from <code>ggplot2</code></div> <hr> <p><code>ggplot2</code> also allows to build heatmaps thanks to <code>geom_tile()</code>. However, I personally prefer the <code>heatmap()</code> function above since only it offers option for normalization, clustering and Dendrogram.</p> <div id="portfolio-items" class="row"> <div class="col-md-4 col-sm-6 portfolio-item"> <a class="portfolio-link" href="79-levelplot-with-ggplot2.html"> <div class="portfolio-hover"> <div class="portfolio-hover-content"> <p>Most basic</p> <hr> <p class="explanation_portfolio">Most basic usage of geom_tile to build heatmap</p> </div> </div> <img class="img-fluid imgOfPortfolio" src="img/graph/79-levelplot-with-ggplot2.png" alt=""> </a> </div> <div class="col-md-4 col-sm-6 portfolio-item"> <a class="portfolio-link" href="79-levelplot-with-ggplot2.html"> <div class="portfolio-hover"> <div class="portfolio-hover-content"> <p>Control color</p> <hr> <p class="explanation_portfolio">Control the color palette used in the heatmap. Several methods shown.</p> </div> </div> <img class="img-fluid imgOfPortfolio" src="img/graph/79-levelplot-with-ggplot22.png" alt=""> </a> </div> <div class="col-md-4 col-sm-6 portfolio-item"> <a class="portfolio-link" href="79-levelplot-with-ggplot2.html"> <div class="portfolio-hover"> <div class="portfolio-hover-content"> <p>Interactive version</p> <hr> <p class="explanation_portfolio">It's very easy to turn your heatmap interactive with ggplotly, check it out!</p> </div> </div> <img class="img-fluid imgOfPortfolio" src="img/graph/79-levelplot-with-ggplot23.png" alt=""> </a> </div> </div> <br><br><br><br> <div class="mySeryTitle">Heatmap for time series</div> <hr> <p>Heatmaps can be a very good alternative to visualize <a href="time-series.html">time series</a>, especially when the time frame you study is repeating, like weeks. Here is a customized example, but visit the <a href="time-series.html">time series section</a> for more.</p> <a class="btn btn-secondary" href="283-the-hourly-heatmap.html">Code</a> <a class="btn btn-secondary" href="time-series.html">Time series section</a> <br> <center><a href="283-the-hourly-heatmap.html"><img width="80%" style="max-width: 600px" src="img/graph/283-the-hourly-heatmap.png" alt="heatmap for time series in R"></img></a></center> <br><br><br><br> <div class="mySeryTitle">Using the <code>levelplot()</code> function of <code>lattice</code></div> <hr> <div id="portfolio-items" class="row"> <div class="col-md-4 col-sm-6 portfolio-item"> <a class="portfolio-link" href="27-levelplot-with-lattice.html"> <div class="portfolio-hover"> <div class="portfolio-hover-content"> <p>Most basic</p> <hr> <p class="explanation_portfolio">Most basic use of the levelplot() function of the lattice package.</p> </div> </div> <img class="img-fluid imgOfPortfolio" src="img/graph/27-levelplot-with-lattice1.png" alt=""> </a> </div> <div class="col-md-4 col-sm-6 portfolio-item"> <a class="portfolio-link" href="27-levelplot-with-lattice.html"> <div class="portfolio-hover"> <div class="portfolio-hover-content"> <p>Reorder and swap X and Y axis</p> <hr> <p class="explanation_portfolio">How to control row and column order on your heatmap.</p> </div> </div> <img class="img-fluid imgOfPortfolio" src="img/graph/27-levelplot-with-lattice2.png" alt=""> </a> </div> <div class="col-md-4 col-sm-6 portfolio-item"> <a class="portfolio-link" href="27-levelplot-with-lattice.html"> <div class="portfolio-hover"> <div class="portfolio-hover-content"> <p>Color palettes</p> <hr> <p class="explanation_portfolio">How to use common color palette: R natives, R Color Brewer and Viridis.</p> </div> </div> <img class="img-fluid imgOfPortfolio" src="img/graph/27-levelplot-with-lattice3.png" alt=""> </a> </div> <div class="col-md-4 col-sm-6 portfolio-item"> <a class="portfolio-link" href="201-levelplot-with-latticeextra.html"> <div class="portfolio-hover"> <div class="portfolio-hover-content"> <p>Heatmap with smoothing</p> <hr> <p class="explanation_portfolio">The latticeExtra allows to add a layer of heatmap with smoothing.</p> </div> </div> <img class="img-fluid imgOfPortfolio" src="img/graph/201-levelplot-with-latticeextra.png" alt=""> </a> </div> </div> </div> </section> <!-- ======================================================================= --> <!-- ============================ RELATED SECTION ============================ --> <section class="bg-light" id="portfolio_landing" style="padding-top: 30px; padding-bottom: 30px"> <div class="container"> <p class="mySeryTitle">Related chart types</p> <hr> <div class="row"> <div class="col-md-2 col-sm-4 portfolio-item "> <a class="portfolio-link" href="scatterplot.html"> <div class="portfolio-hover"> <div class="portfolio-hover-content"> <i class="fa fa-plus fa-3x"></i> </div> </div> <img class="img-fluid" src="img/section/ScatterPlot150.png" alt=""> </a> <div class="captionPortfolio">Scatter</div> </div> <div class="col-md-2 col-sm-4 portfolio-item"> <a class="portfolio-link" href="#heatmap"> <div class="portfolio-hover"> <div class="portfolio-hover-content"> <i class="fa fa-plus fa-3x"></i> </div> </div> <img class="img-fluid" src="img/section/Heatmap150.png" alt=""> </a> <div class="captionPortfolio">Heatmap</div> </div> <div class="col-md-2 col-sm-4 portfolio-item"> <a class="portfolio-link" href="correlogram.html"> <div class="portfolio-hover"> <div class="portfolio-hover-content"> <i class="fa fa-plus fa-3x"></i> </div> </div> <img class="img-fluid" src="img/section/Correlogram150.png" alt=""> </a> <div class="captionPortfolio">Correlogram</div> </div> <div class="col-md-2 col-sm-4 portfolio-item"> <a class="portfolio-link" href="bubble.html"> <div class="portfolio-hover"> <div class="portfolio-hover-content"> <i class="fa fa-plus fa-3x"></i> </div> </div> <img class="img-fluid" src="img/section/BubblePlot150.png" alt=""> </a> <div class="captionPortfolio">Bubble</div> </div> <div class="col-md-2 col-sm-4 portfolio-item "> <a class="portfolio-link" href="connected-scatterplot.html"> <div class="portfolio-hover"> <div class="portfolio-hover-content"> <i class="fa fa-plus fa-3x"></i> </div> </div> <img class="img-fluid" src="img/section/ScatterConnected150.png" alt=""> </a> <div class="captionPortfolio">Connected scatter</div> </div> <div class="col-md-2 col-sm-4 portfolio-item show column correlation numonly bigdata"> <a class="portfolio-link" href="density2d.html"> <div class="portfolio-hover"> <div class="portfolio-hover-content"> <i class="fa fa-plus fa-3x"></i> </div> </div> <img class="img-fluid" src="img/section/2dDensity150.png" alt=""> </a> <div class="captionPortfolio">Density 2d</div> </div> </div> </div> </section> <!-- ============================ CONTACT SECTION ============================ --> <!-- ANCHOR --> <a name="contactanchor"></a> <section id="contact" class="bg" style="background-color: white"></section> <!-- THIS ALLOWS TO INSERT THE CONTACT CHUNK THAT IS STORED IN A CONTACT.HTML FILE--> <script> $(function(){ $("#contact").load("html_chunk/contact.html"); }); </script> <!-- ============================ FOOTER SECTION ============================ --> <footer class="bg-light" id="myFooter"></footer> <!-- THIS ALLOWS TO INSERT THE FOOTER THAT IS STORED IN A FOOTER.HTML FILE--> <script> $(function(){ $("#myFooter").load("html_chunk/footer.html"); }); </script> <!-- ============================ --> <!-- =============== JAVASCRIPT SECTION =============== --> <!-- Bootstrap core JavaScript --> <script src="vendor/bootstrap/js/bootstrap.bundle.min.js"></script> <!-- Plugin JavaScript --> <script src="vendor/jquery-easing/jquery.easing.min.js"></script> <!-- Contact form JavaScript --> <script src="js/jqBootstrapValidation.js"></script> <script src="js/contact_me.js"></script> <!-- Custom scripts for this template --> <script src="js/agency.min.js"></script> <!-- Activate the bootstrap tooltip, must be after jQuery load --> <script> $(function () { $('[data-toggle="tooltip"]').tooltip() }) </script> <!--============================== --> </body> </html>