# Bytehound - a memory profiler for Linux
## Features
* Can be used to analyze memory leaks, see where exactly the memory is being
consumed, identify temporary allocations and investigate excessive memory fragmentation
* Gathers every allocation and deallocation, along with full stack traces
* Can dynamically cull temporary allocations allowing you to profile over a long
period of time
* Uses a custom, tailor-made stack unwinding implementation which makes it
a lot cheaper than other similar tools, potentially up to orders of magnitude
faster in some cases
* Can export the data it gathered into various different formats; it can
export the data as JSON (so you can analyze it yourself if you want), as
Heaptrack (so you can use the excellent [Heaptrack GUI] for analysis)
and as a flamegraph
* Has its own Web-based GUI which can be used for analysis
* Can dynamically stream the profiling data to another machine instead
of saving it locally, which is useful for profiling on memory-constrained systems
* Supports AMD64, ARM, AArch64 and MIPS64 architectures (where MIPS64 requires a tiny out-of-tree kernel patch for `perf_event_open`)
* Supports profiling of applications which use jemalloc as their allocator (only works on AMD64 with the `jemallocator` crate)
* Supports an embedded DSL based on [Rhai](https://rhai.rs) to allow for programmatic
and/or automated data analysis
[Heaptrack GUI]: https://github.com/KDE/heaptrack
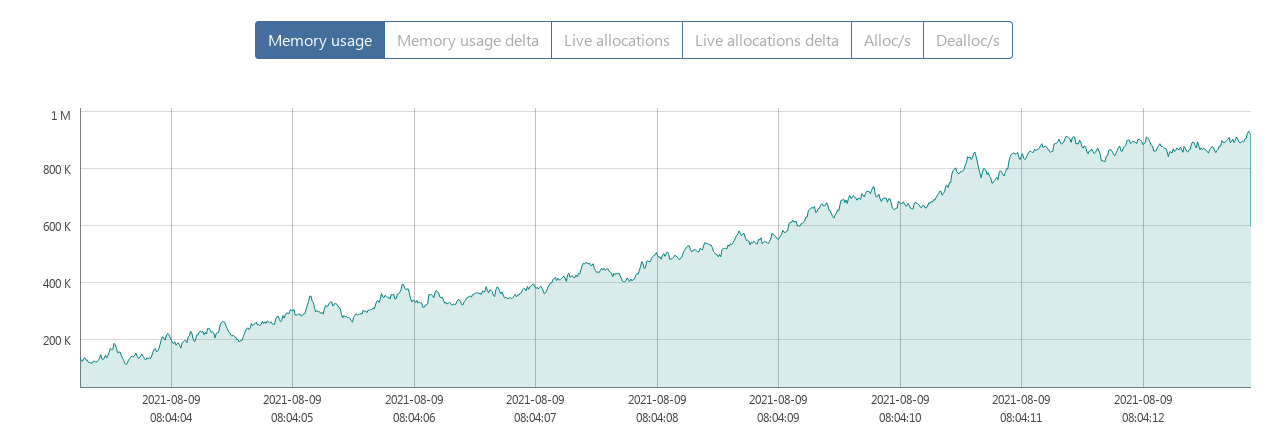
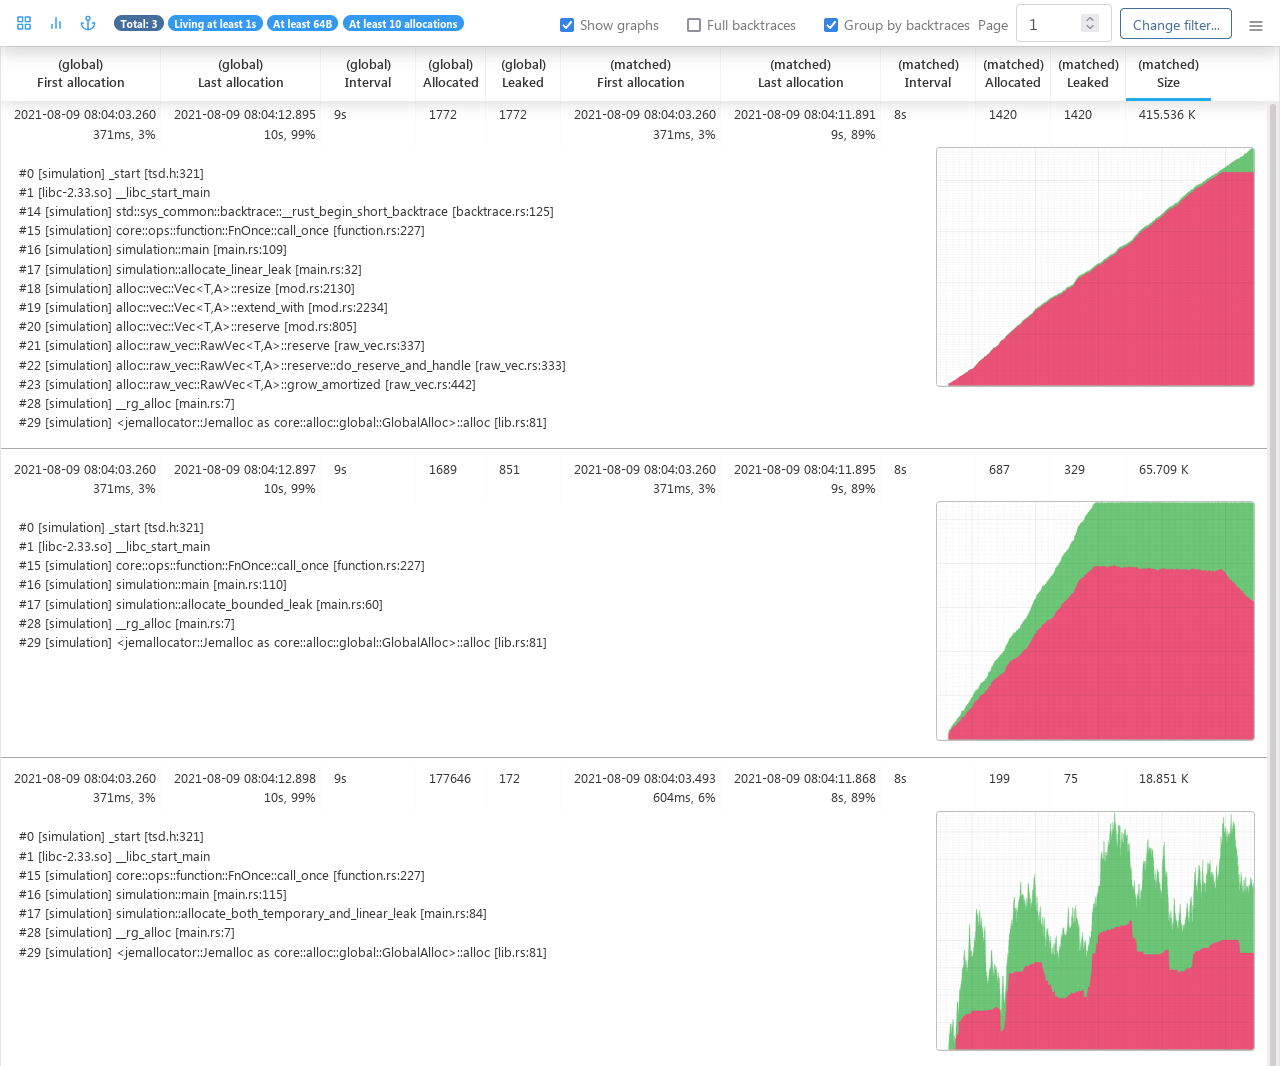
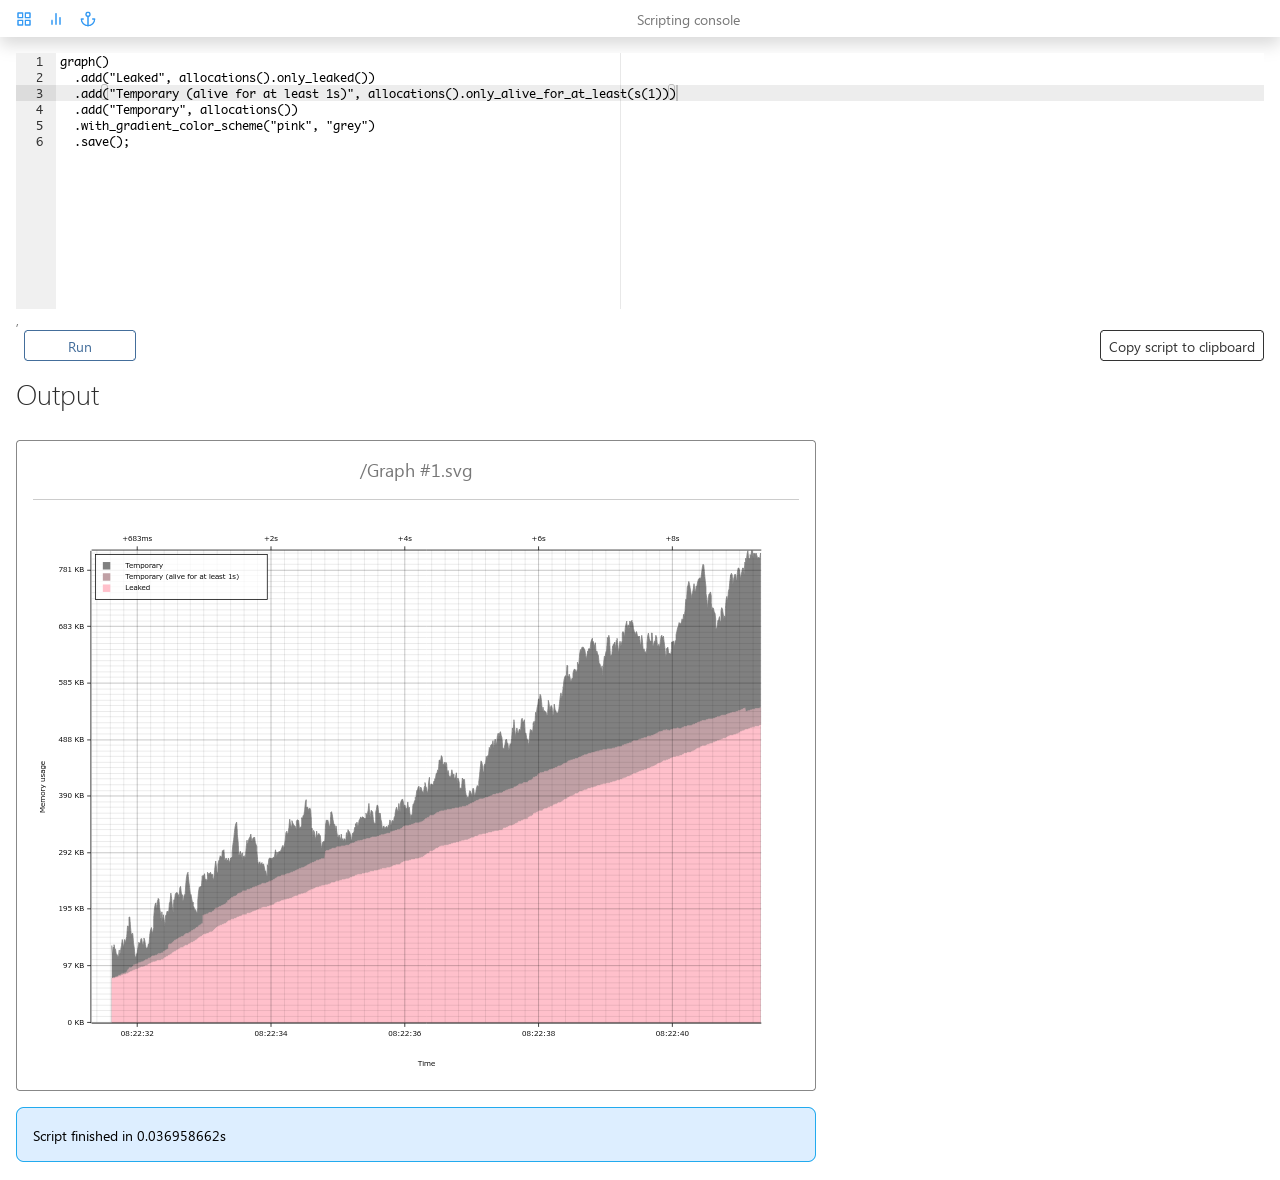
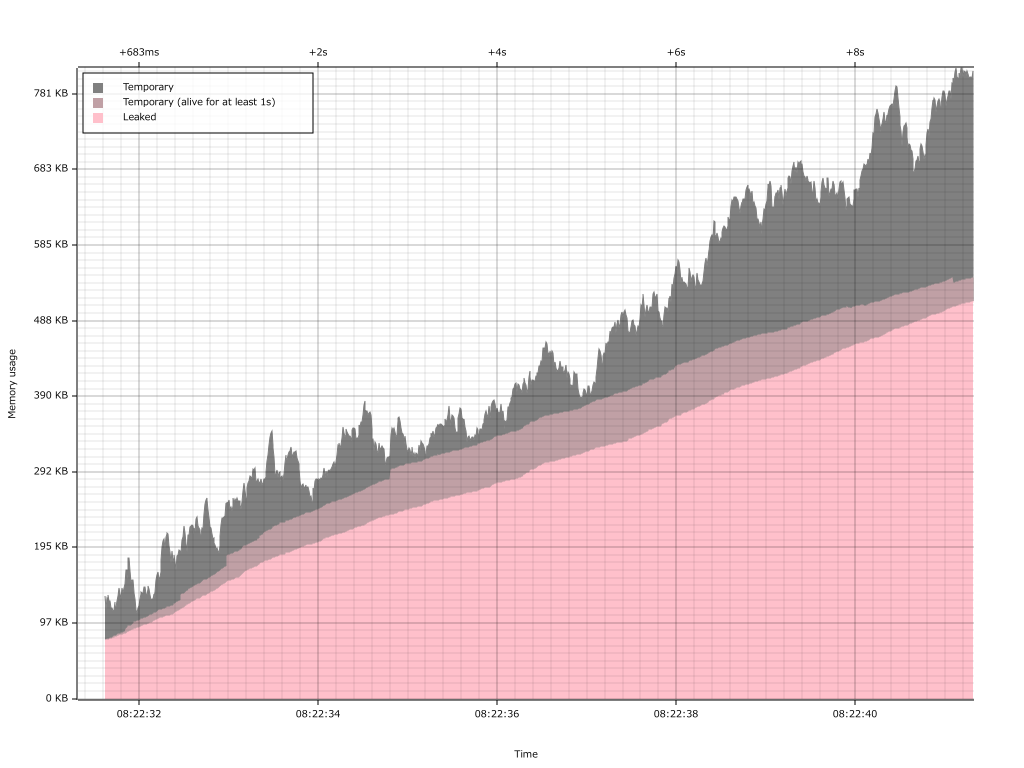
## Screenshots
## Building
1. Install GCC, Rust nightly (**only 1.62 or newer is supported**) and the Yarn package manager (for building the GUI)
2. Build it:
$ cargo build --release -p bytehound-preload
$ cargo build --release -p bytehound-cli
3. Grab the binaries from `target/release/libbytehound.so` and `target/release/bytehound`
## Usage
### Basic usage
$ export MEMORY_PROFILER_LOG=warn
$ LD_PRELOAD=./libbytehound.so ./your_application
$ ./bytehound server memory-profiling_*.dat
Then open your Web browser and point it at `http://localhost:8080` to access the GUI.
## Documentation
You can find the full documentation for the profiler in our [Memory profiling for fun and profit](https://koute.github.io/bytehound/) book.
## Enabling full debug logs
By default the profiler is compiled with most of its debug logs disabled for performance reasons.
To reenable them be sure to recompile it with the `debug-logs` feature, e.g. like this:
$ cd preload
$ cargo build --release --features debug-logs
## License
Licensed under either of
* Apache License, Version 2.0, ([LICENSE-APACHE](LICENSE-APACHE) or http://www.apache.org/licenses/LICENSE-2.0)
* MIT license ([LICENSE-MIT](LICENSE-MIT) or http://opensource.org/licenses/MIT)
at your option.
### Contribution
Unless you explicitly state otherwise, any contribution intentionally submitted
for inclusion in the work by you, as defined in the Apache-2.0 license, shall be
dual licensed as above, without any additional terms or conditions.