Infographic: Wei-Yin Chen
Background
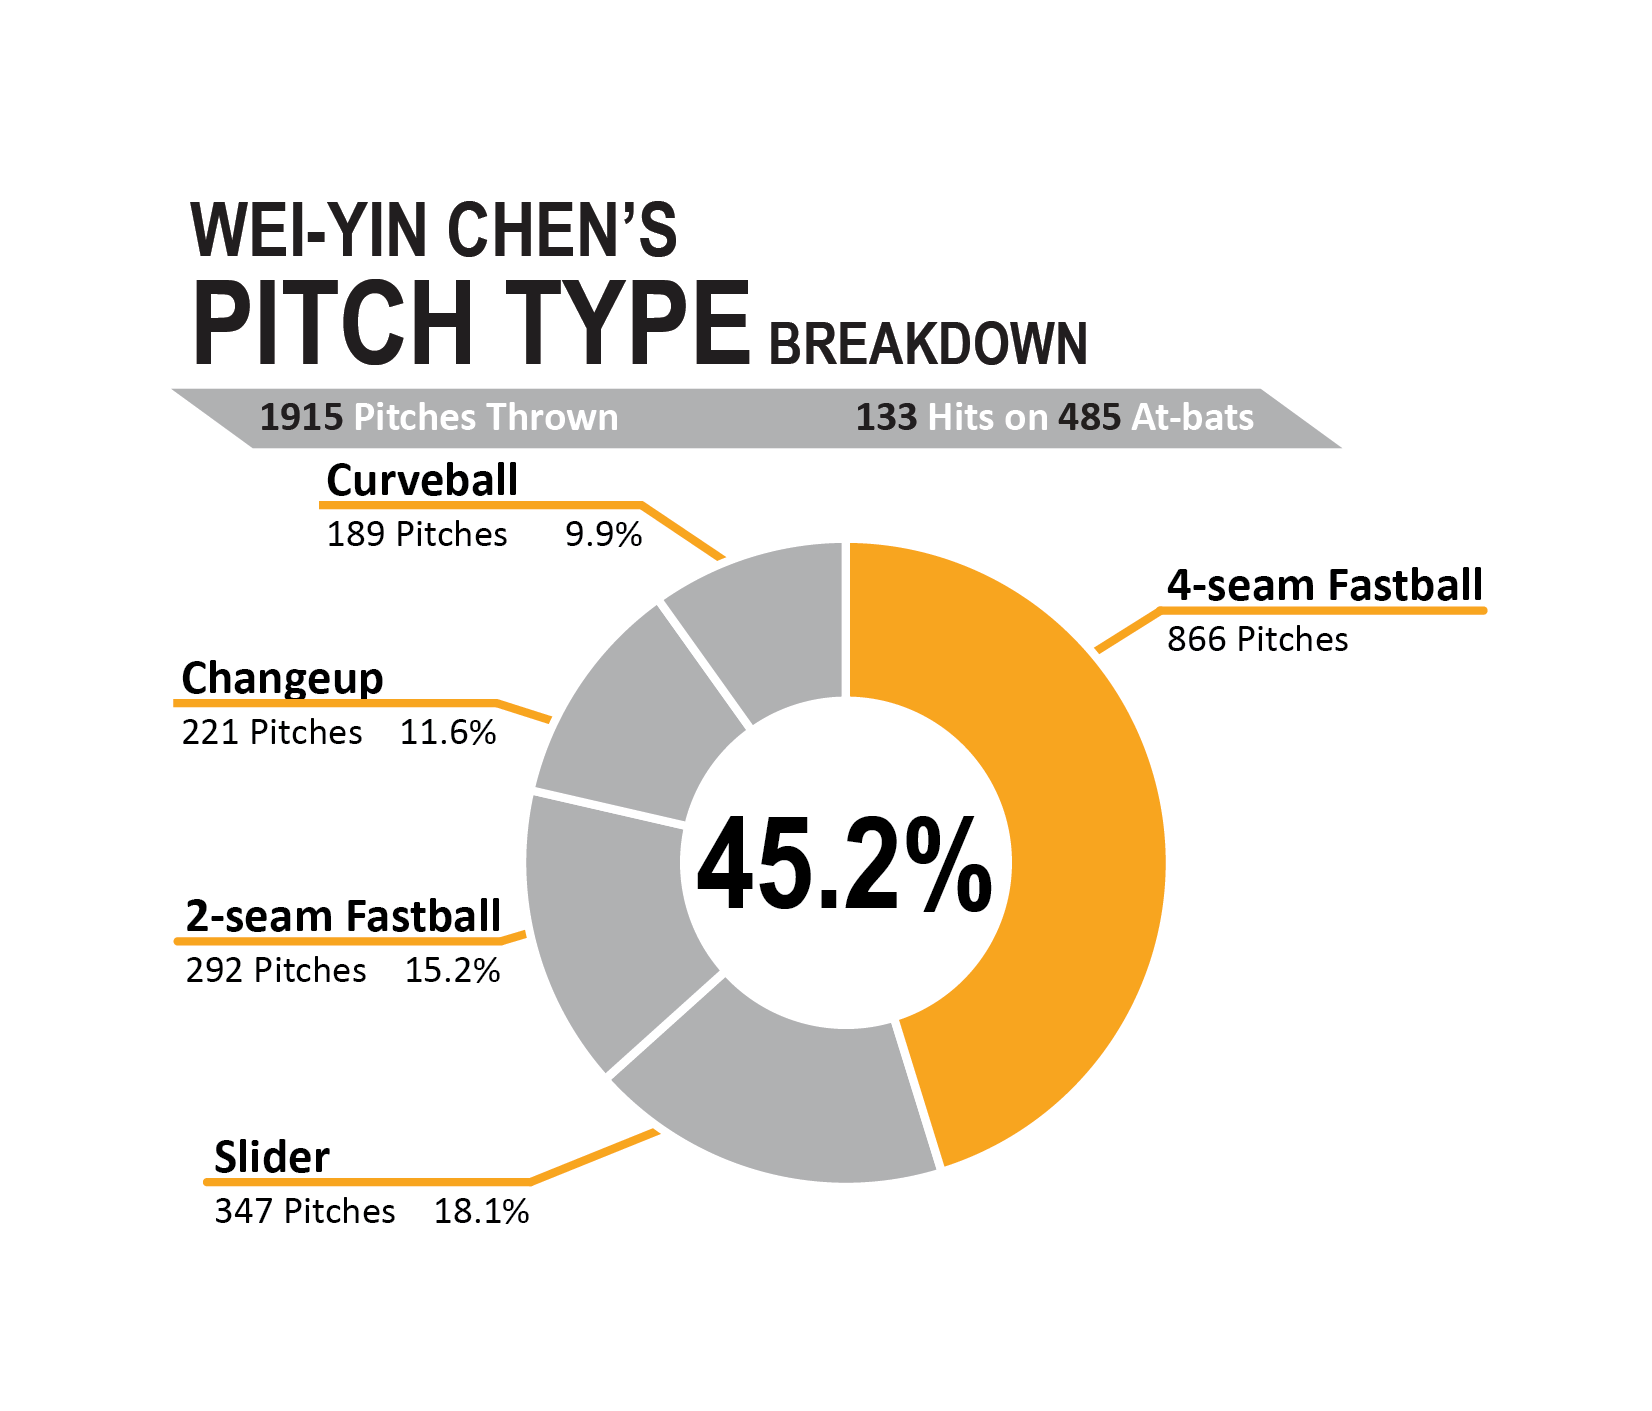
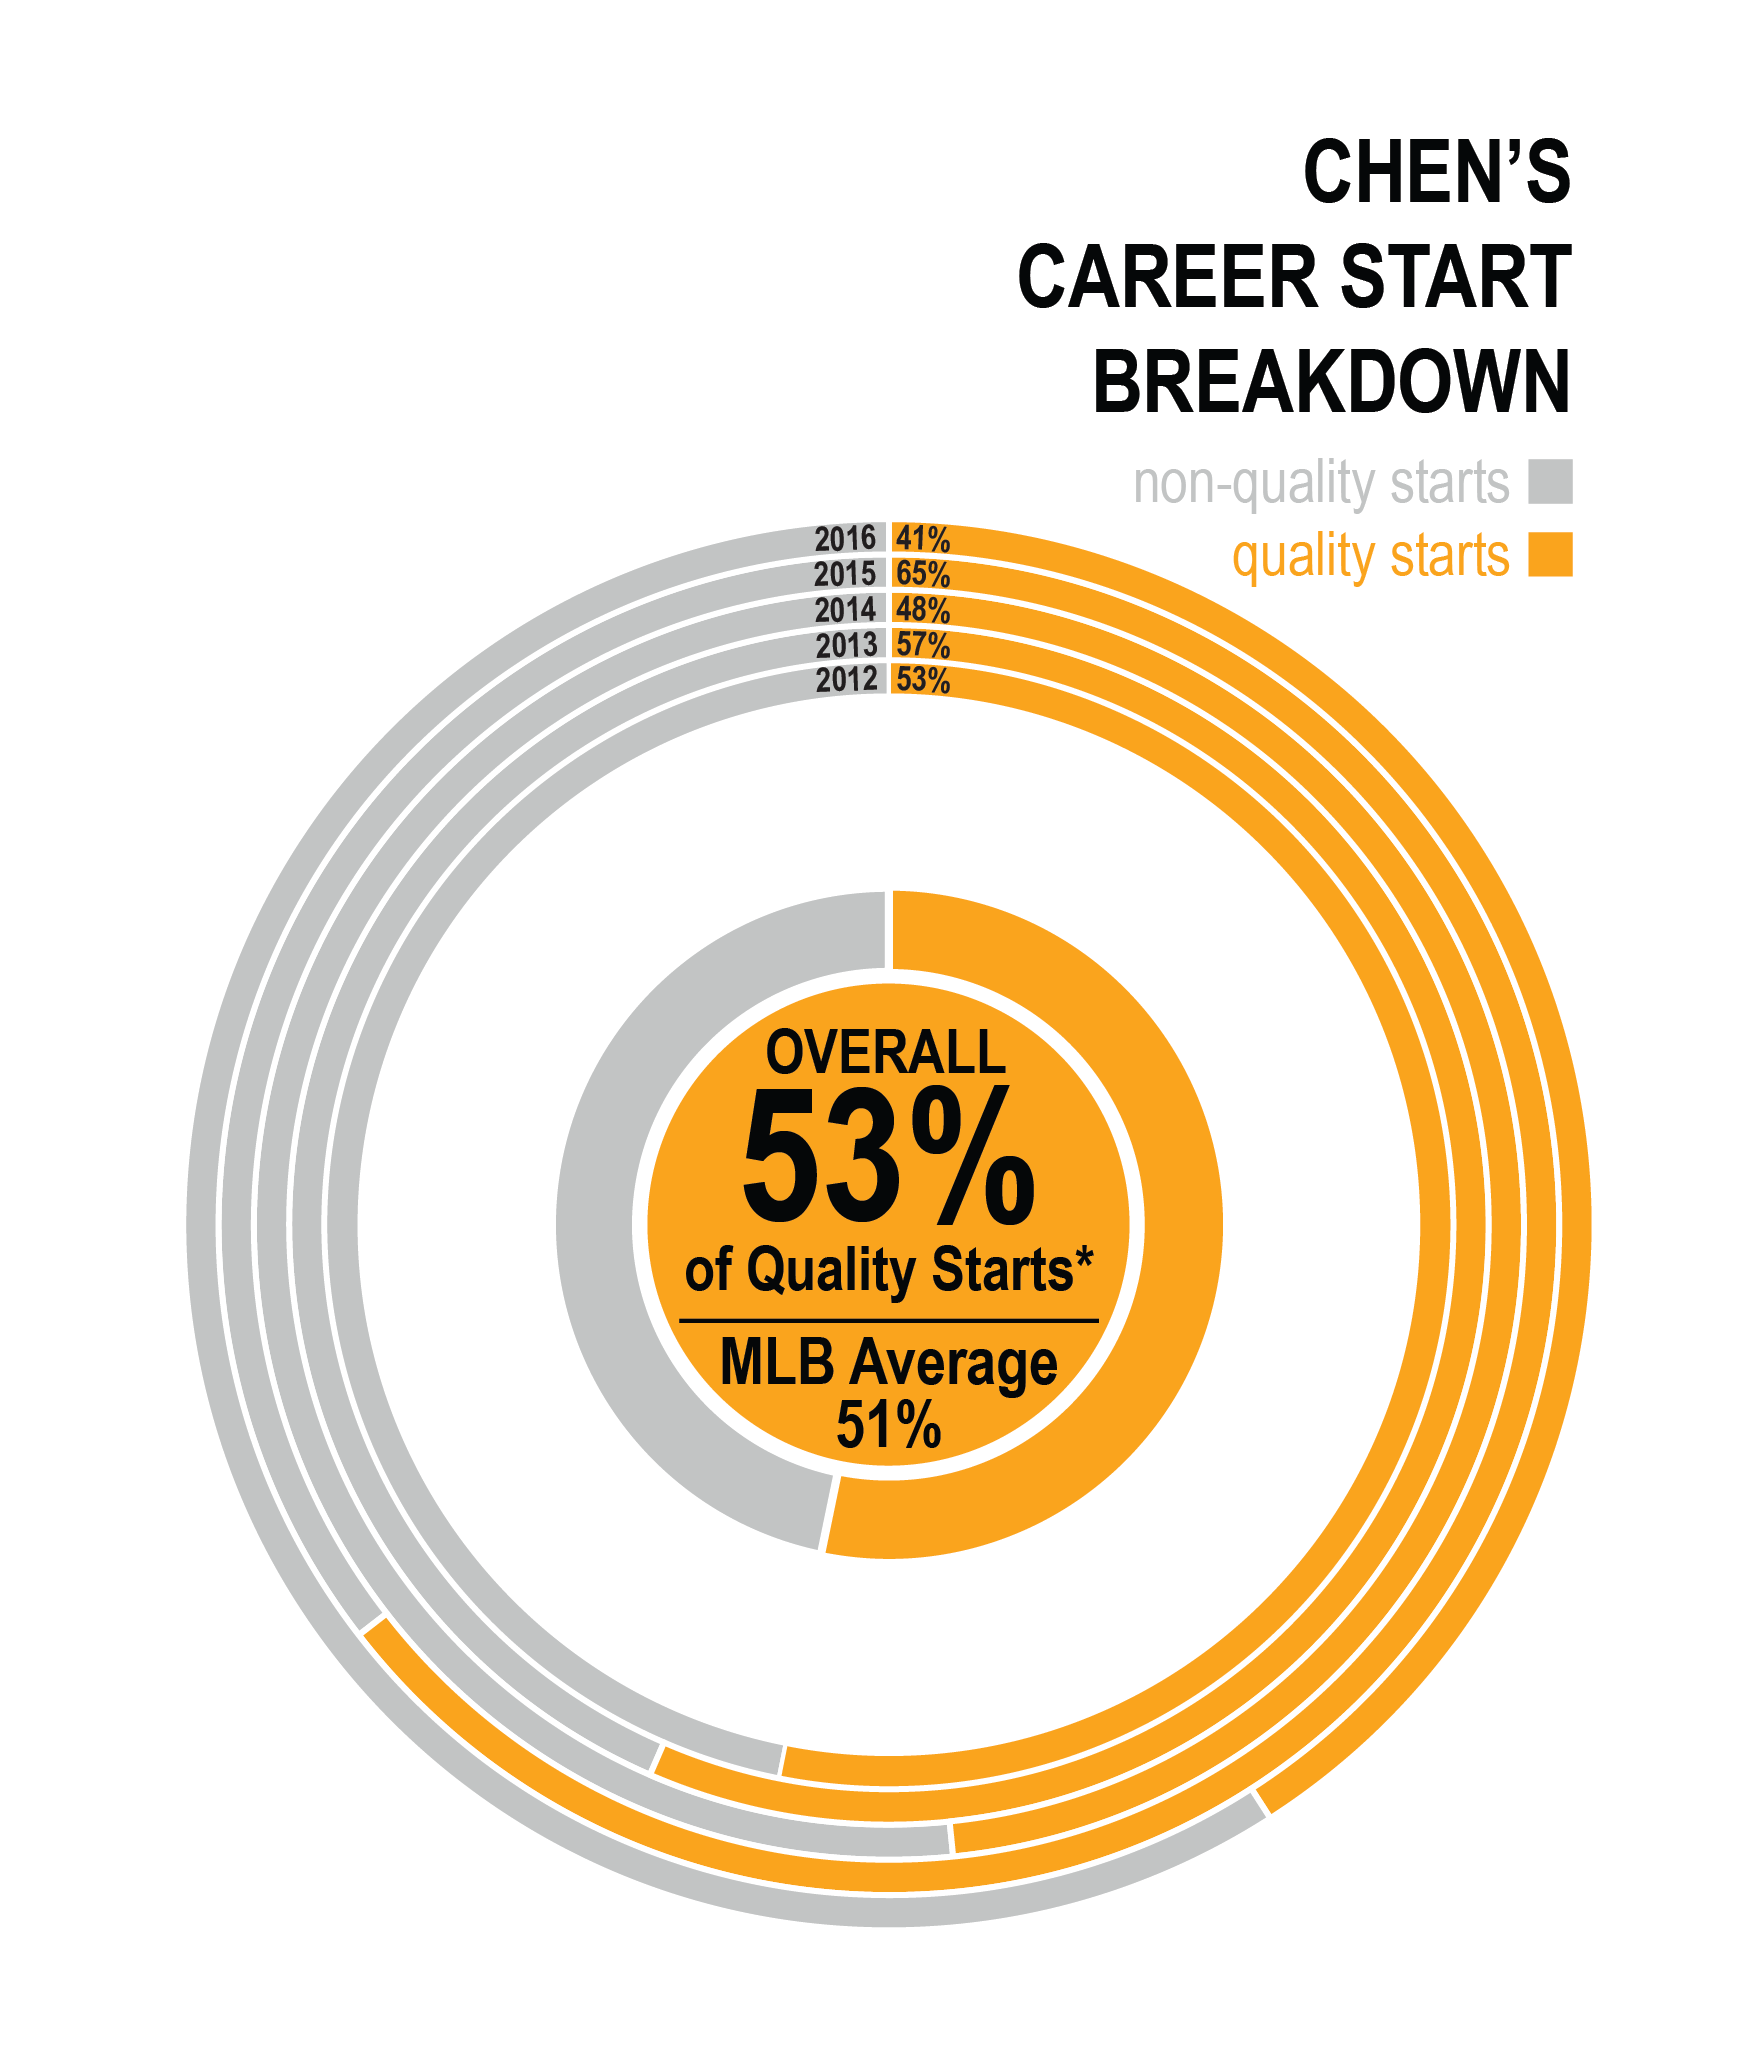
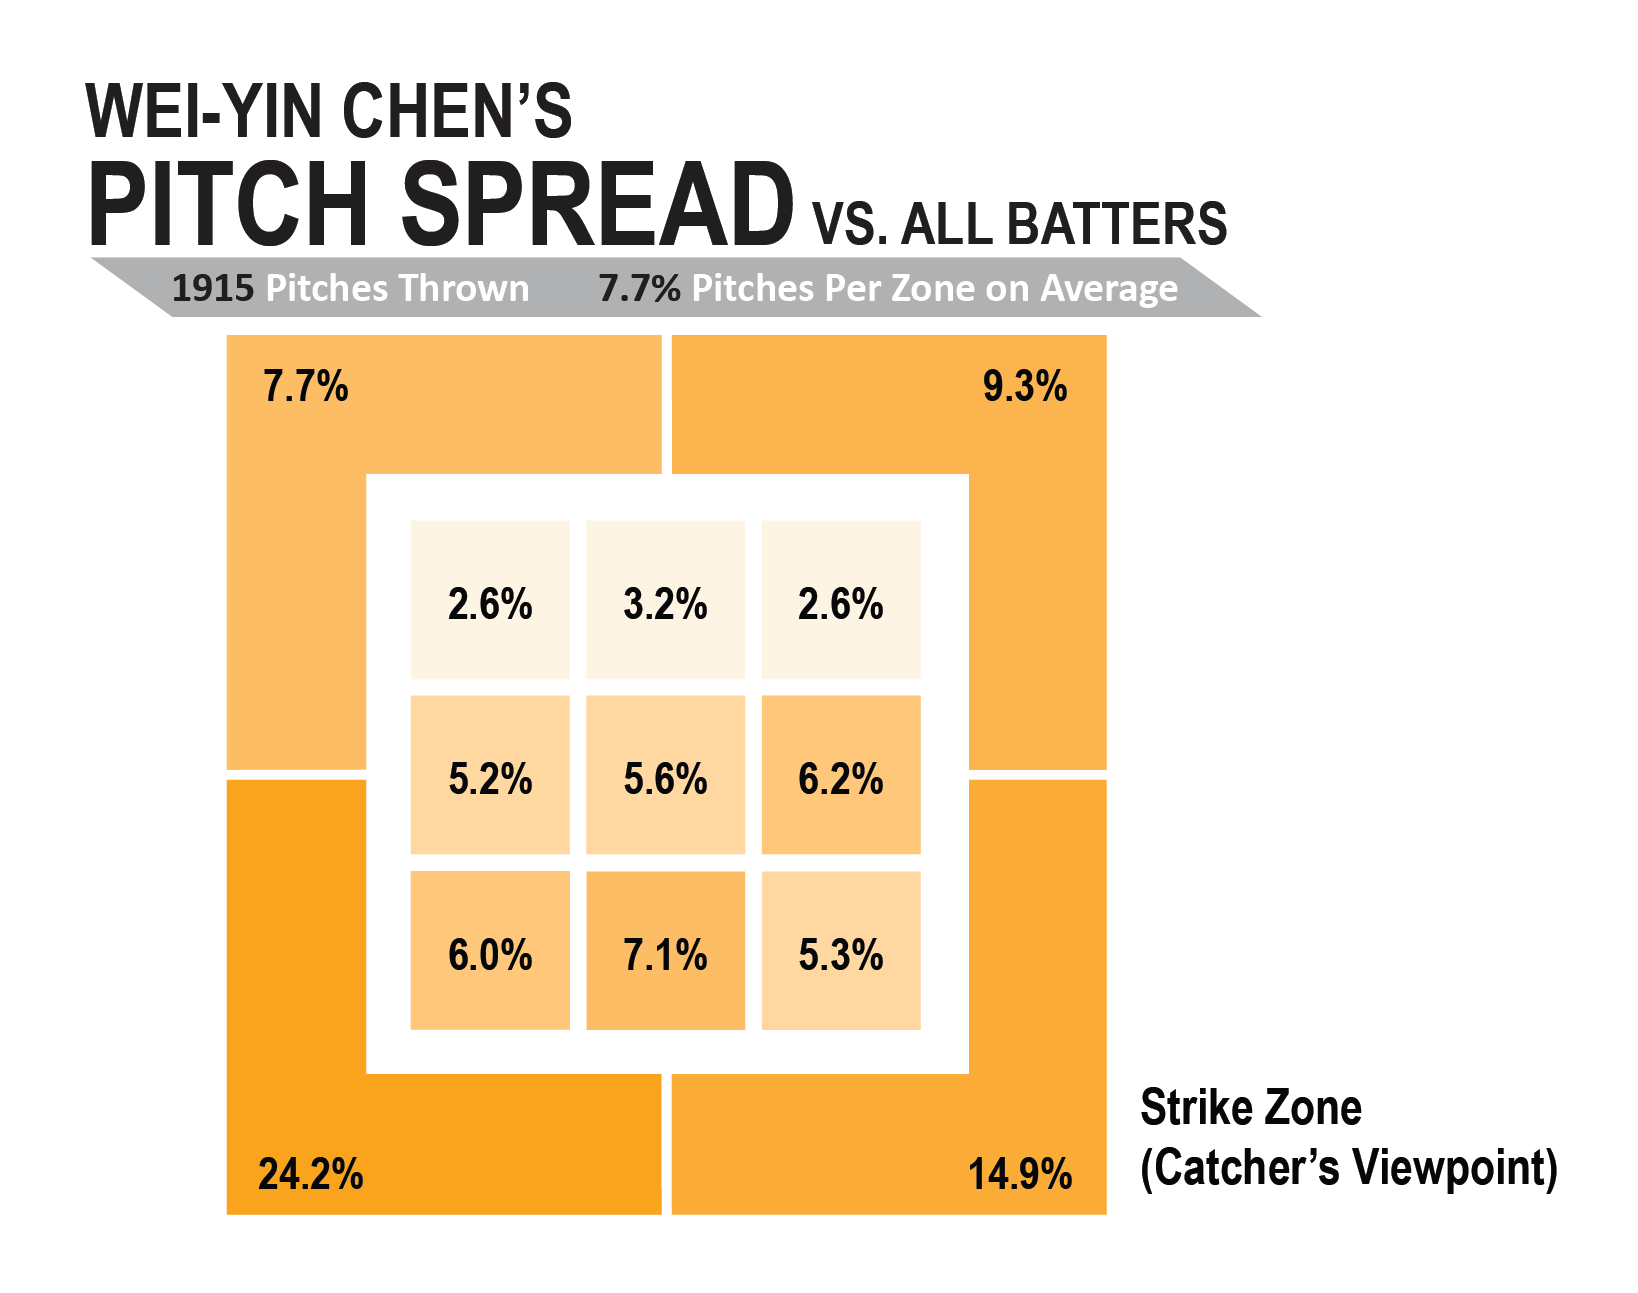
Wei-Yin Chen is an infographic design project for my Visual Information Design course. The project allows me to choose a topic of my own and create an infographic from visualized data for the topic. As a baseball fan from Taiwan, I chose to create one for my favorite Major League baseball pitcher, Wei-Yin Chen, who is also from Taiwan. The statistics and record for his performance are collected from MLB.com and Baseball Reference.
Project Details
Tools: Adobe Illustrator, Microsoft Excel, Tableau
Deliverables: Final infographic, graphic displays, model infographic analysis, portfolio site
The Learning
The project started with analyzing the visual elements of existing infographics. This includes their use of color, size, encoding, typography, visual language, and layout. Through the process, I were to choose some of the infographics as my model infographics, with which I produced my own based on their practices of visual elements.
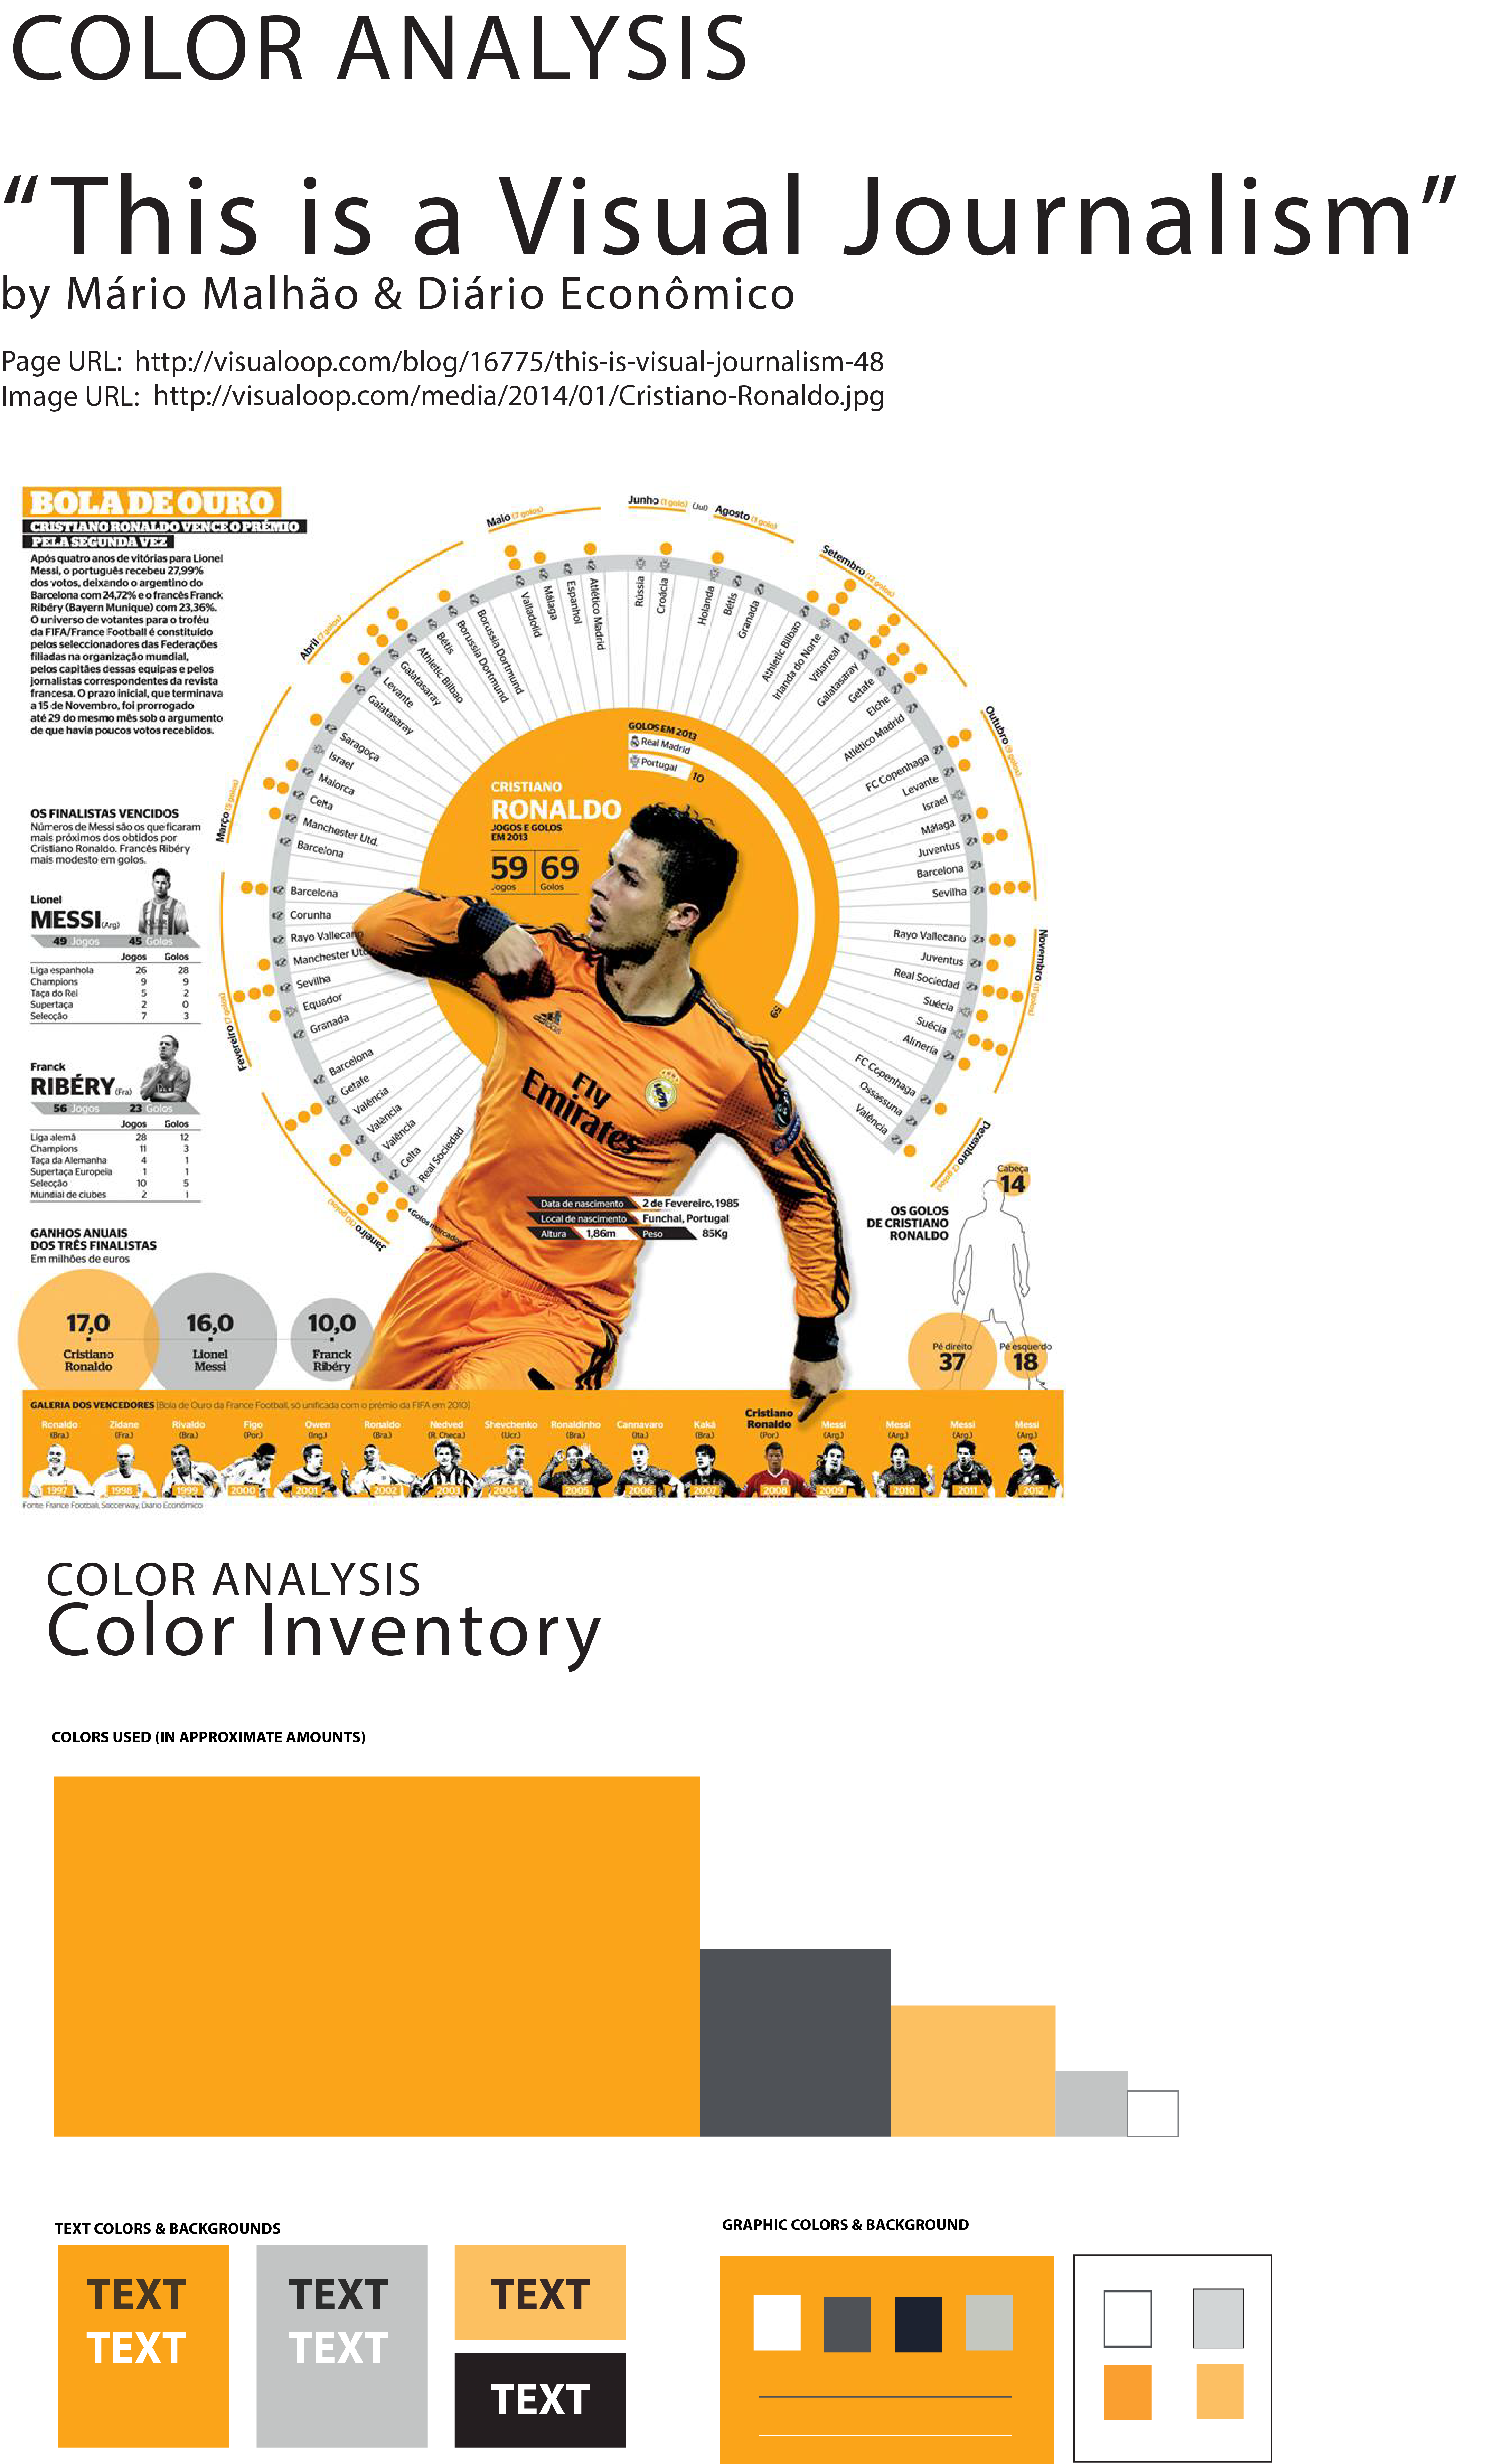
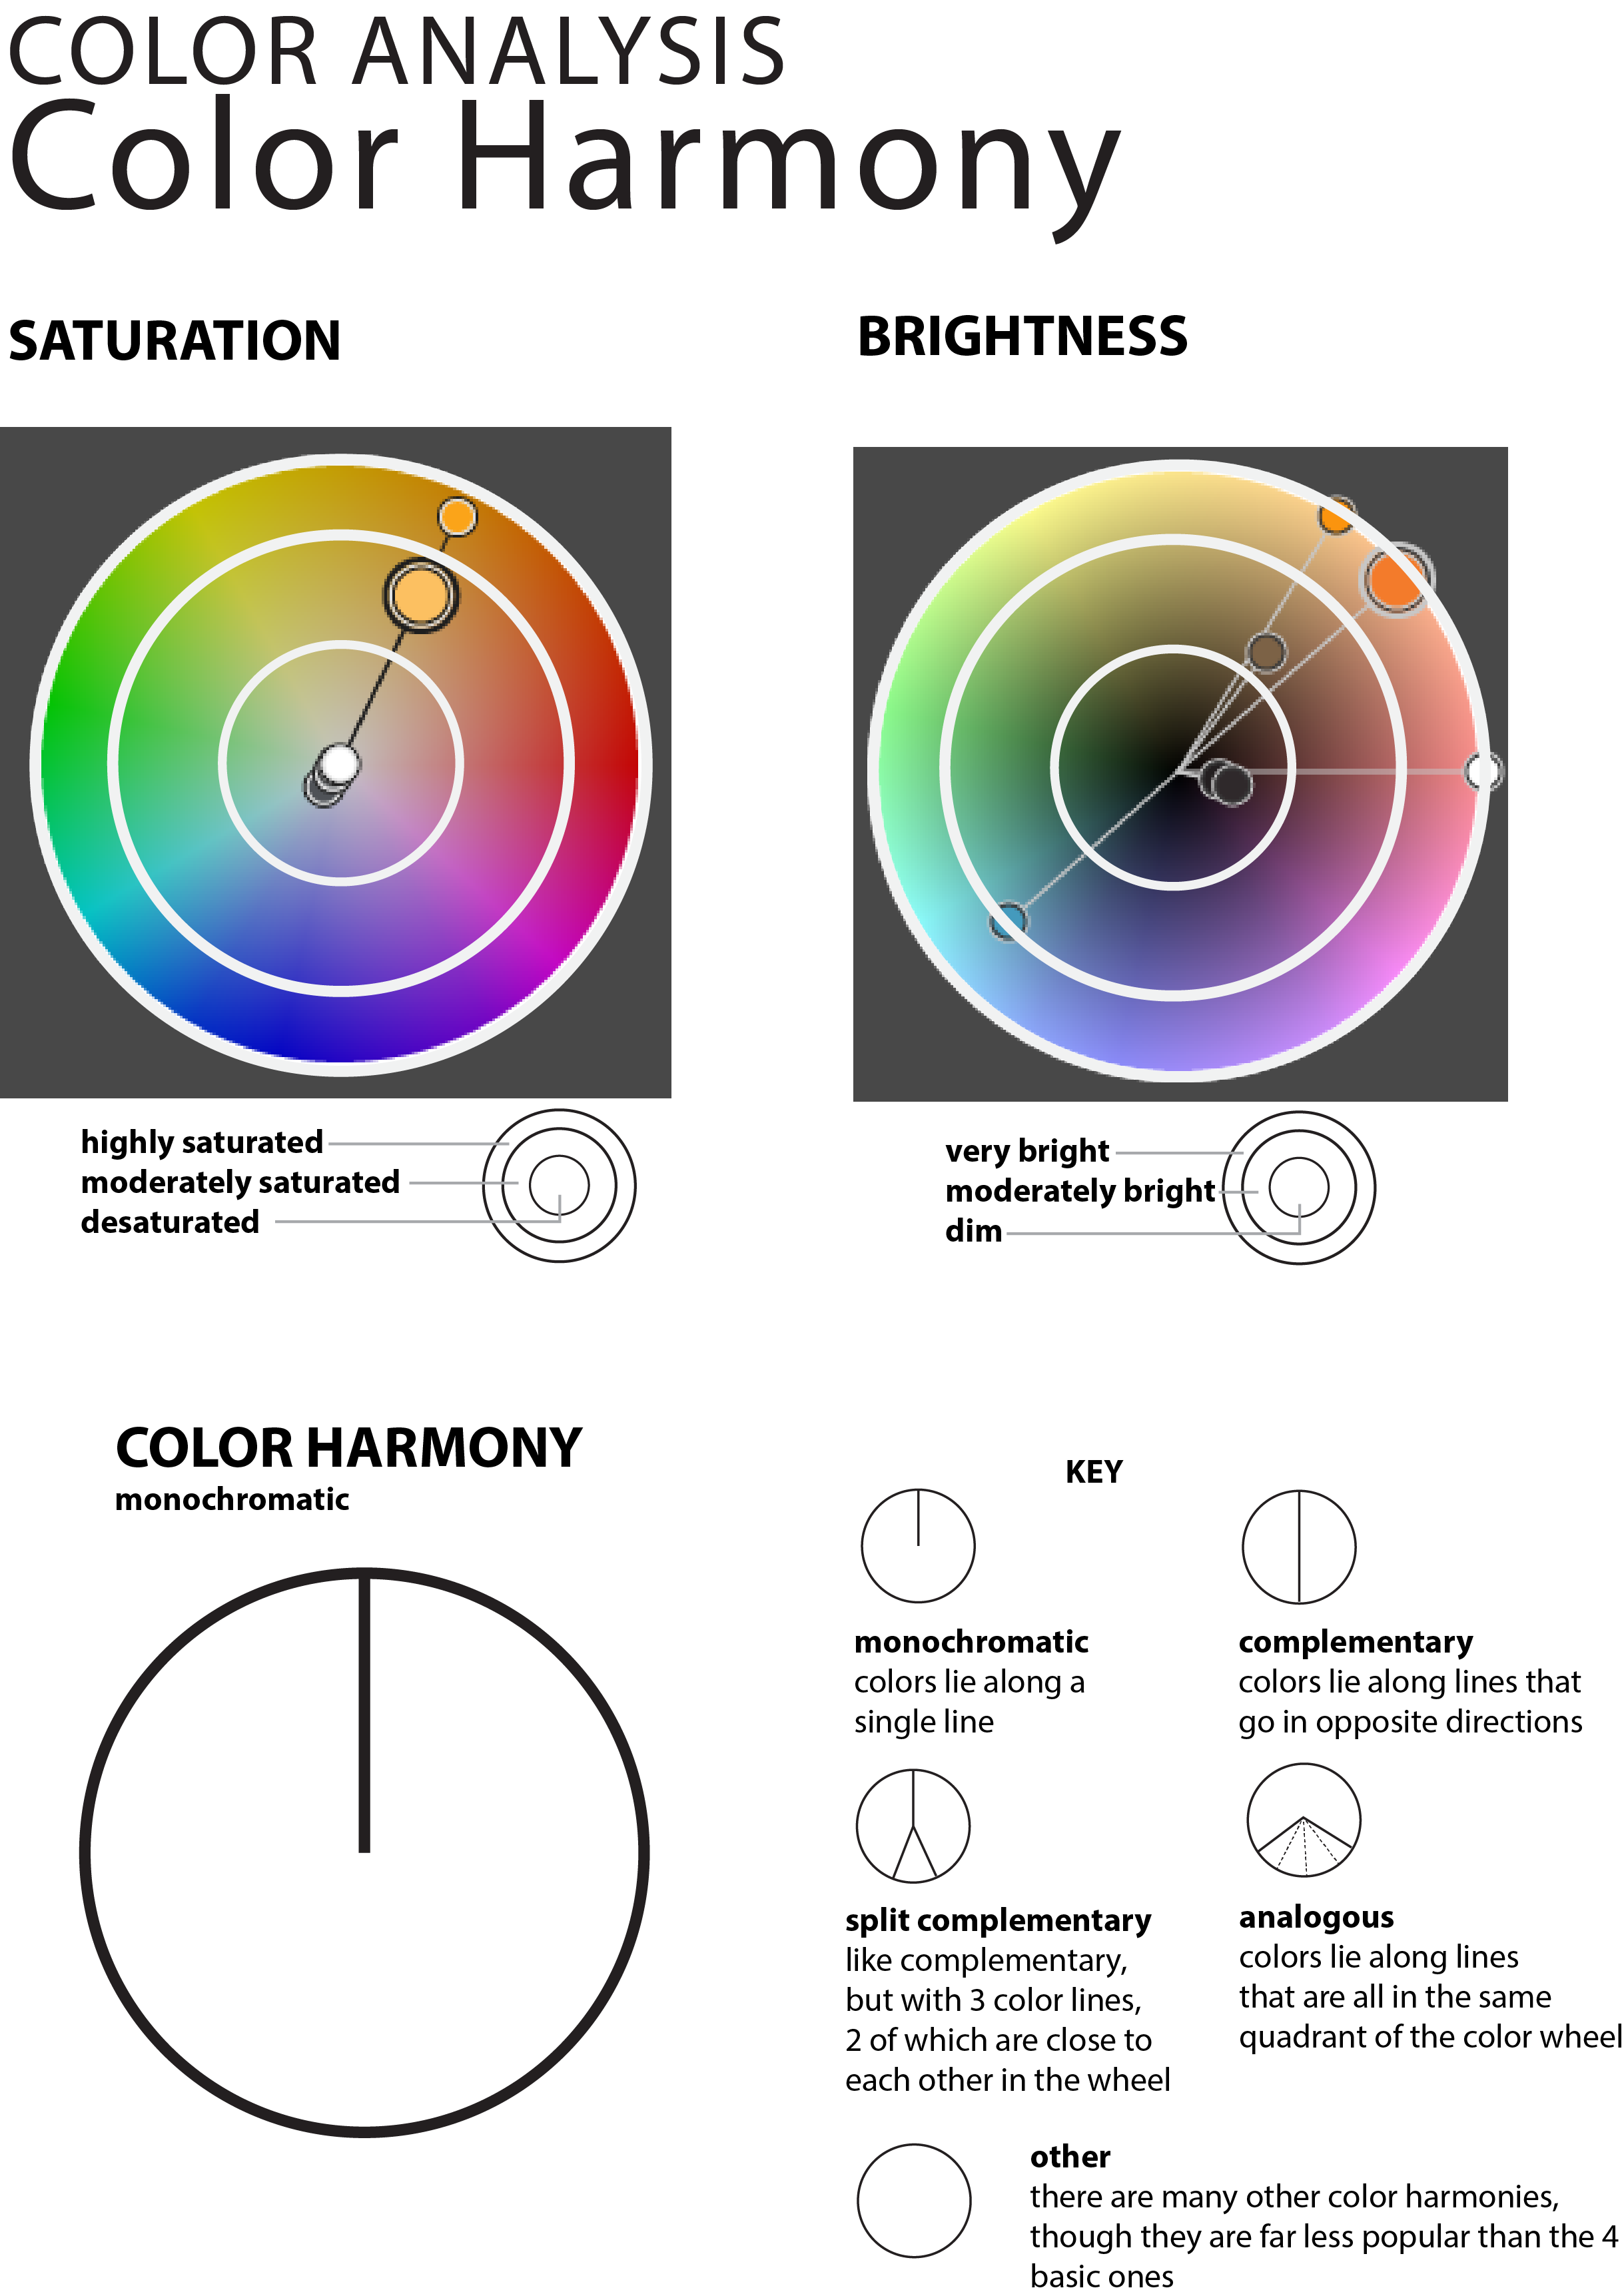
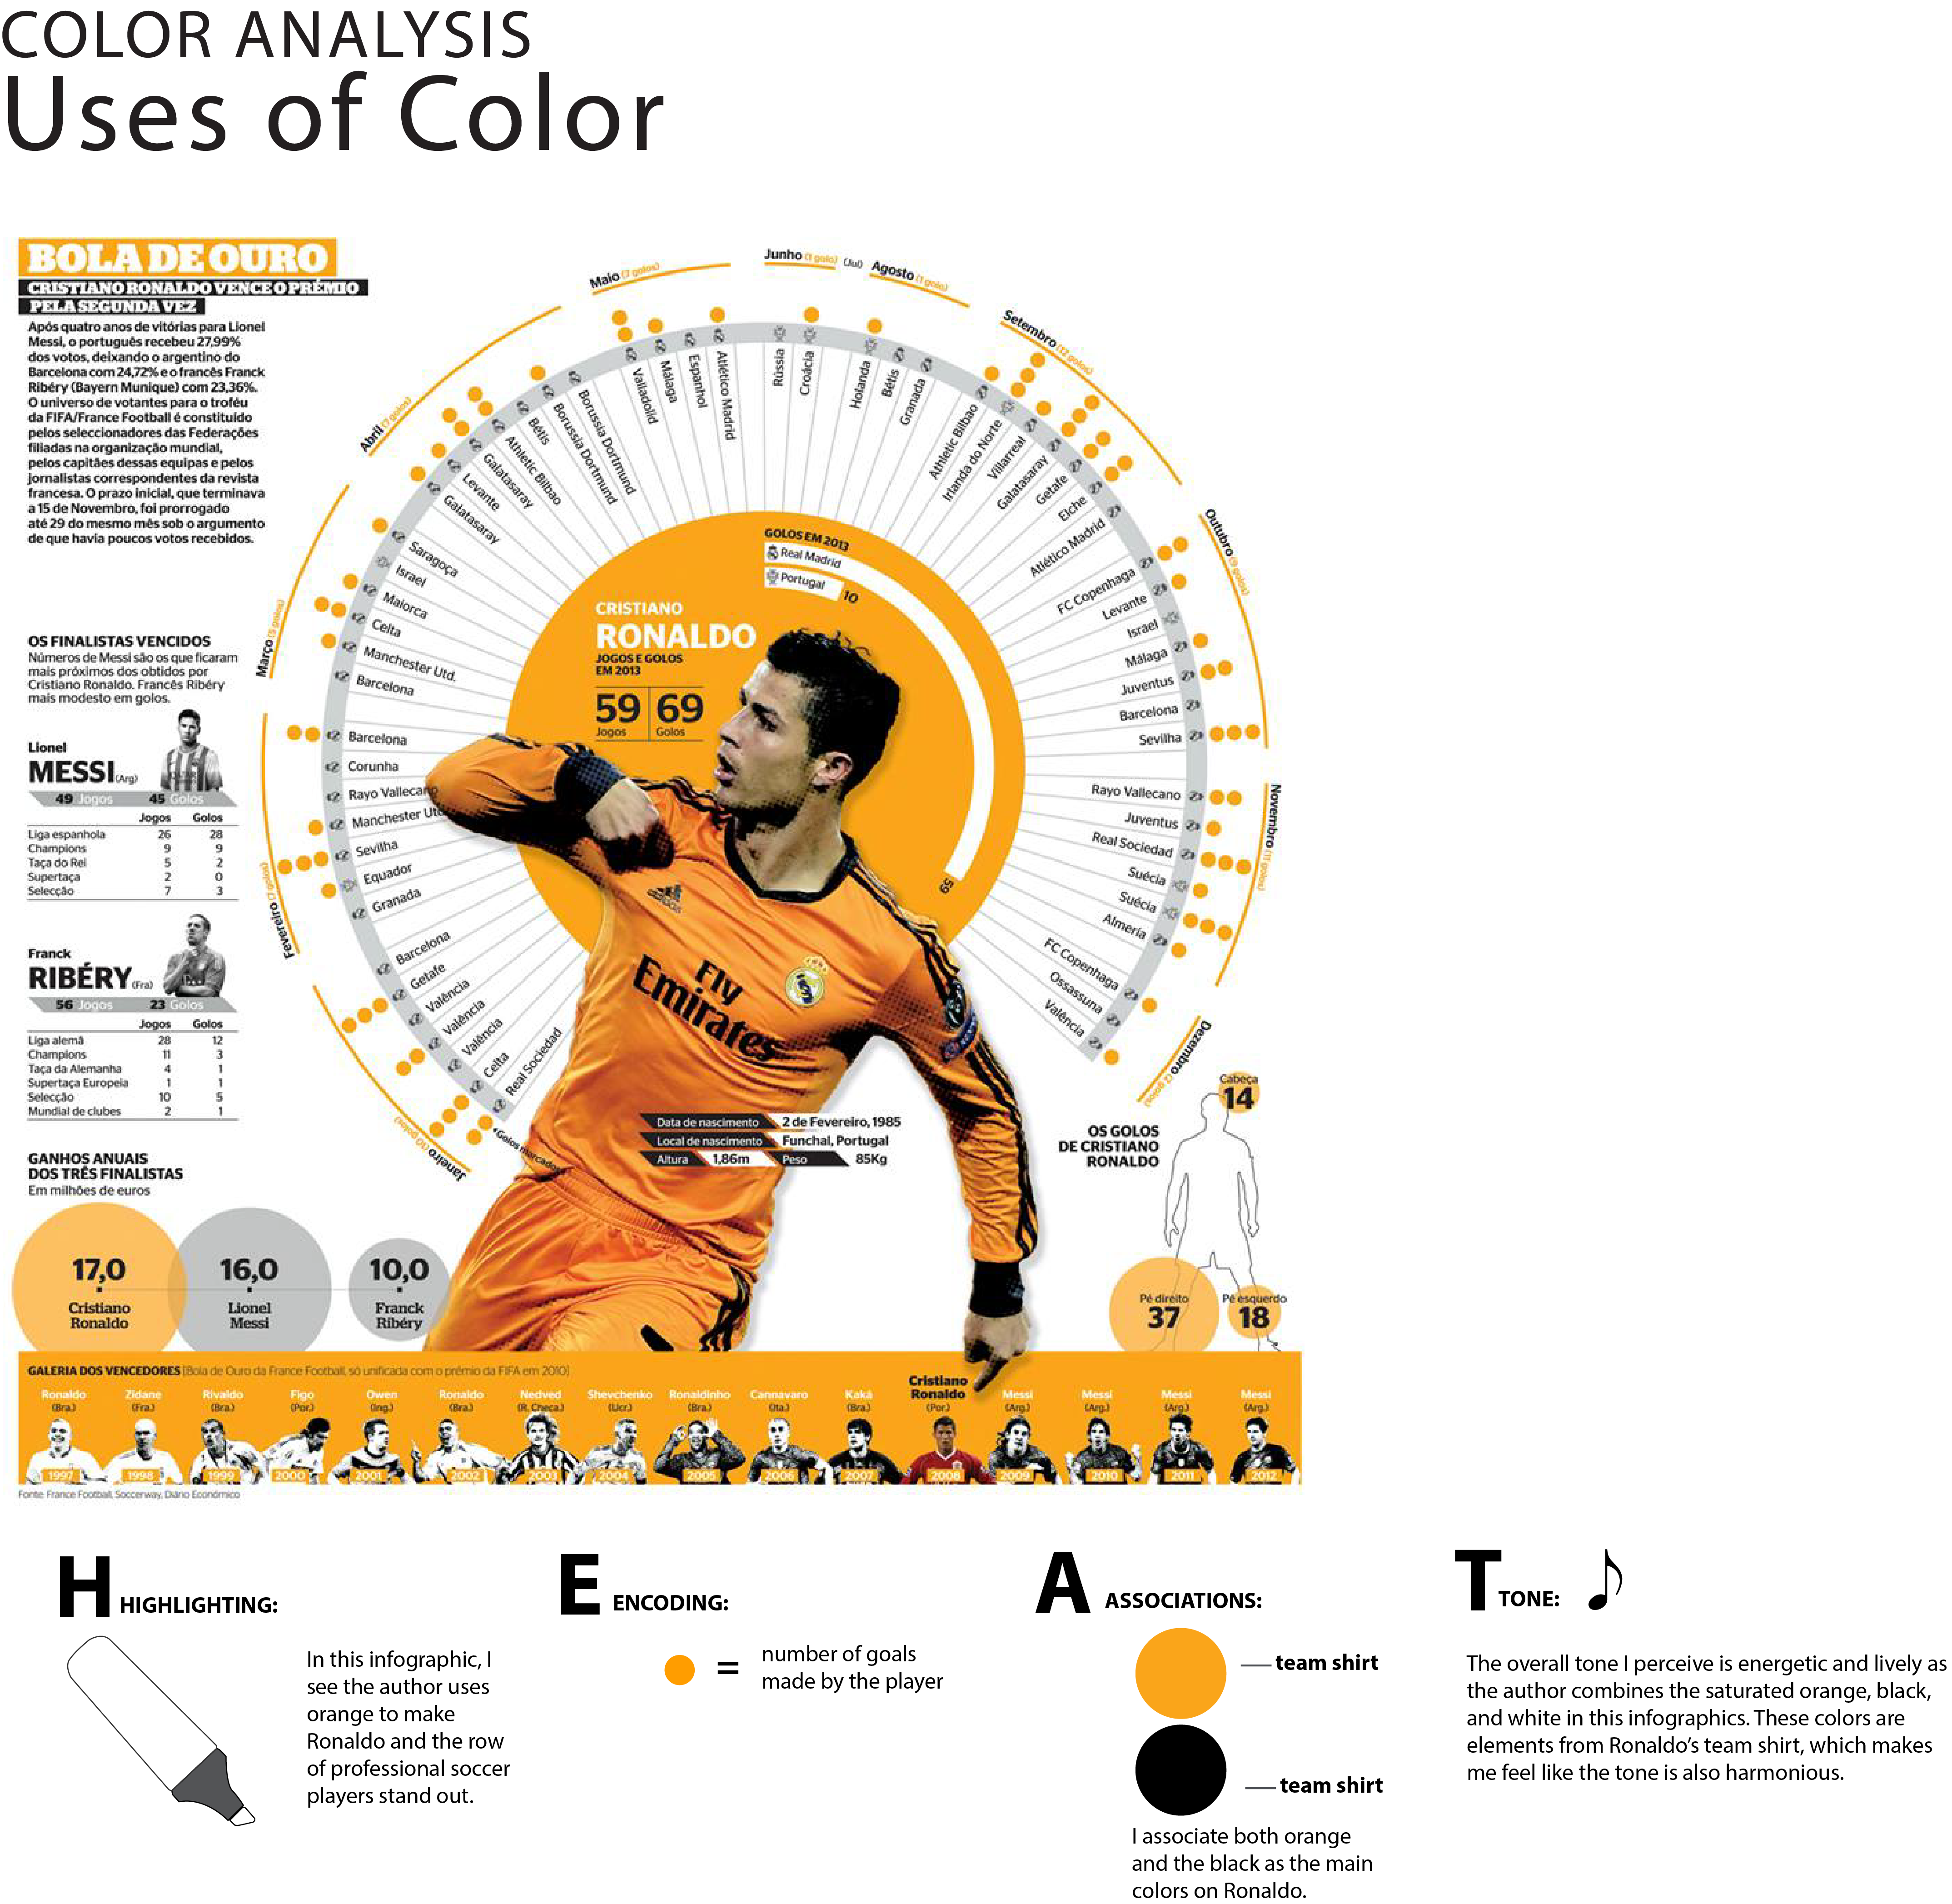
Analysis on Model Infographics
An important learning objective of this project is to learn from the models through analysis. This is one of the analyses I did on a sample infographic. It covers the color inventory, color harmony, and use of colors in the sample.
The Iteration and Design Process
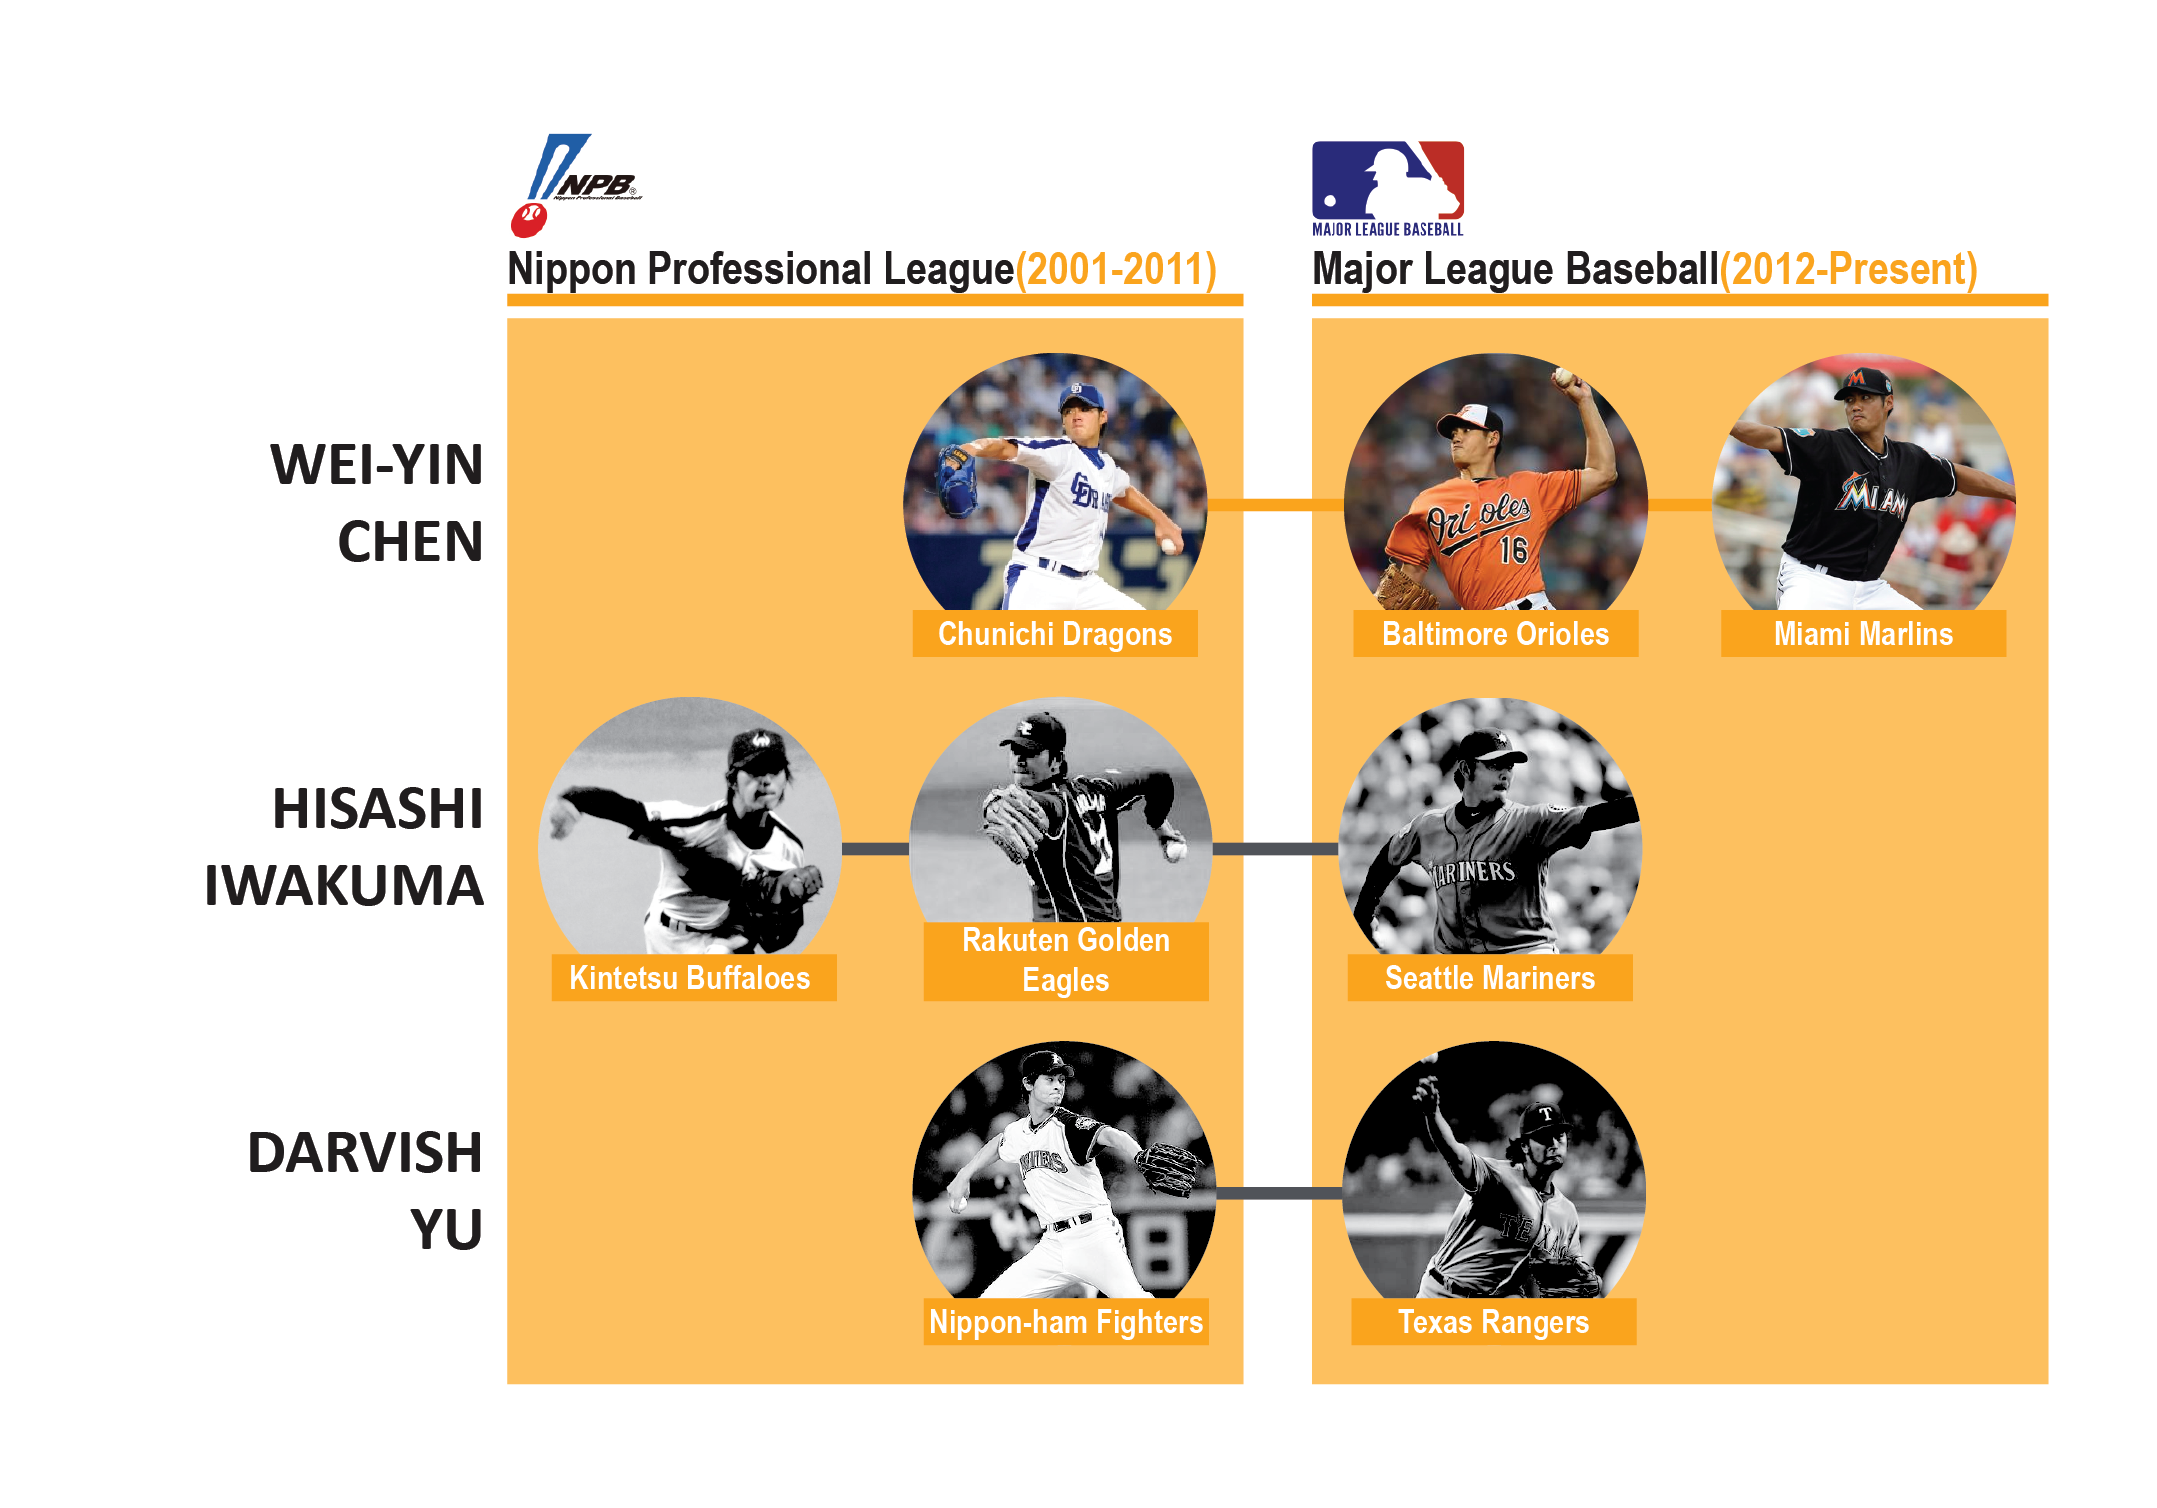
Throughout the second half of the course, I created my own visual displays using Adobe Illustrator, Excel, and Tableau. The displays were created to explore the five areas of visual potentials of my topic: appearance, numbers, location, time, and relationships. Each display is iterated at least 3 times based on feedback from peer critiques.
At the end of the class, these displays were then synthesized to a final infographic that emulates the layout of my layout model. My instructor was impressed by my work, and my project site for the infographic is featured as a sample portfolio for future students of the class.
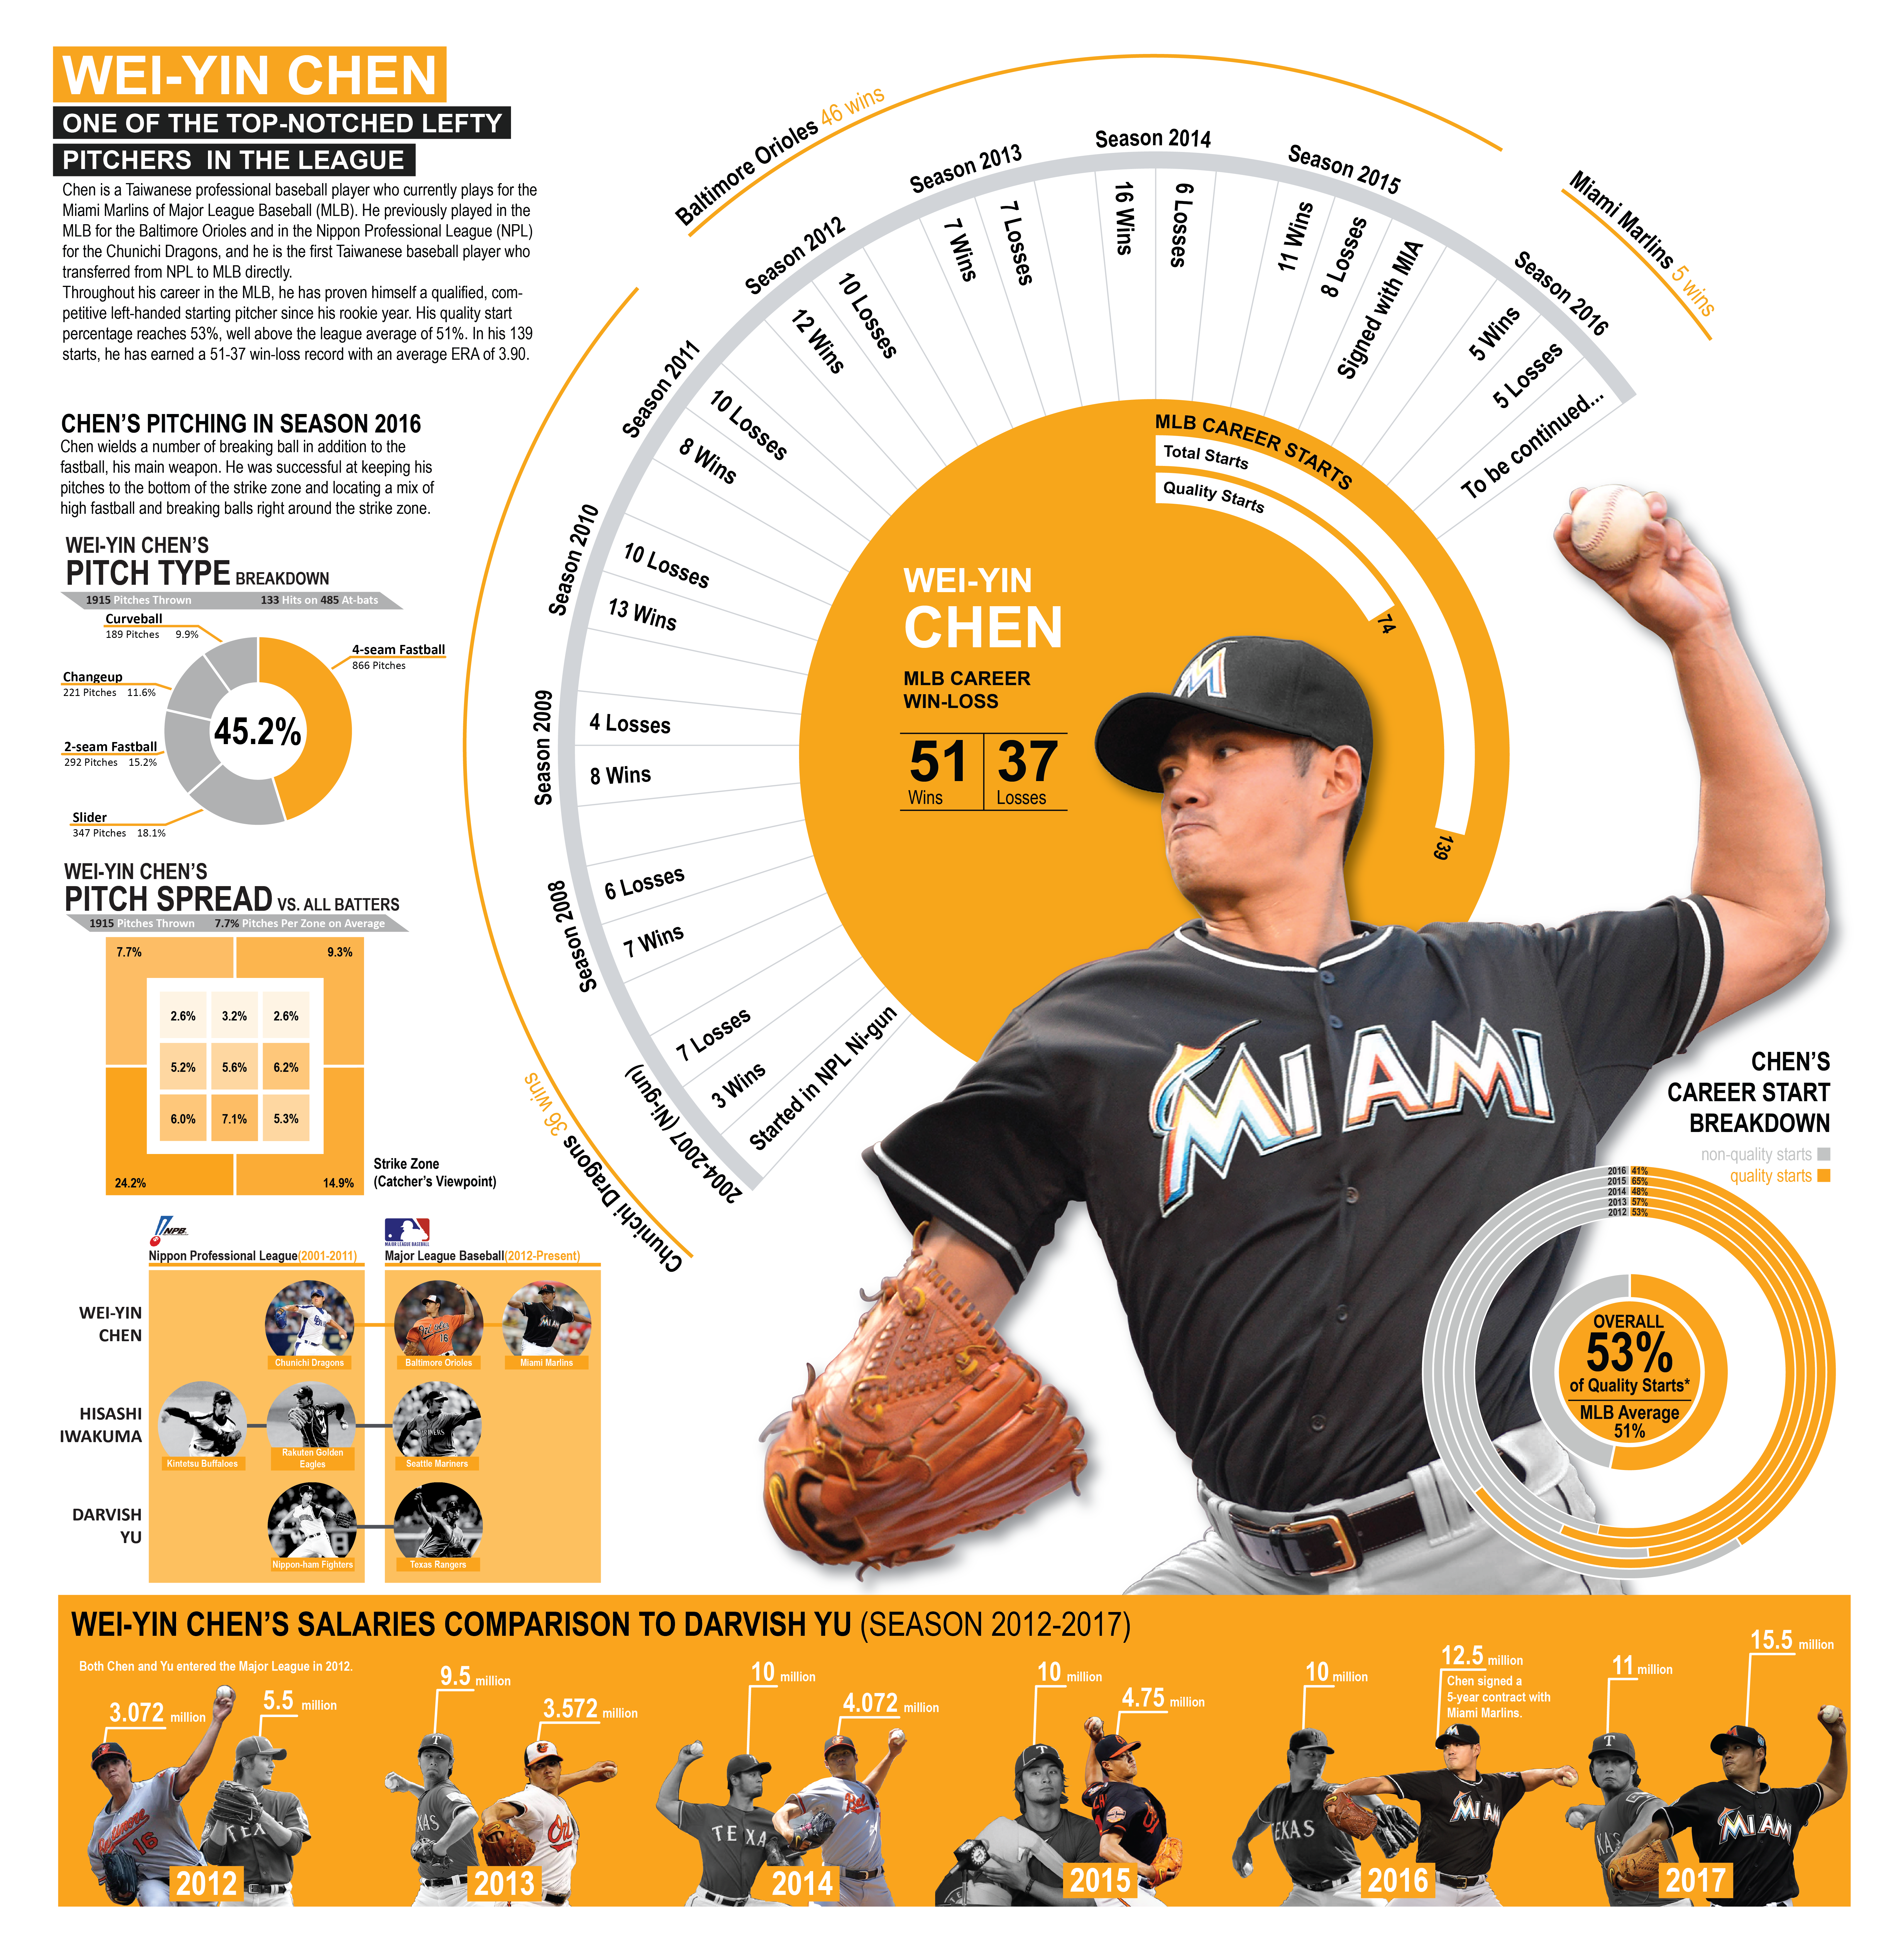
The displays by parts:
