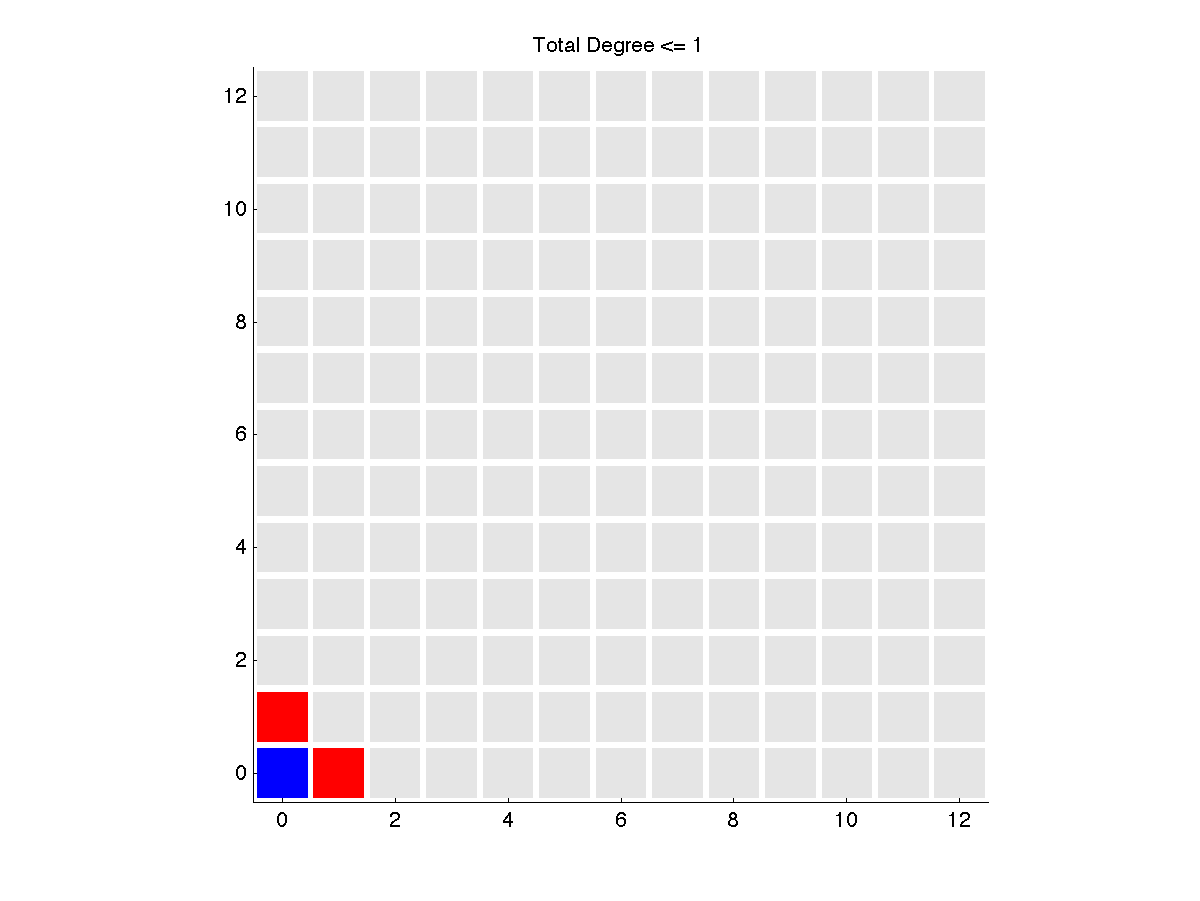
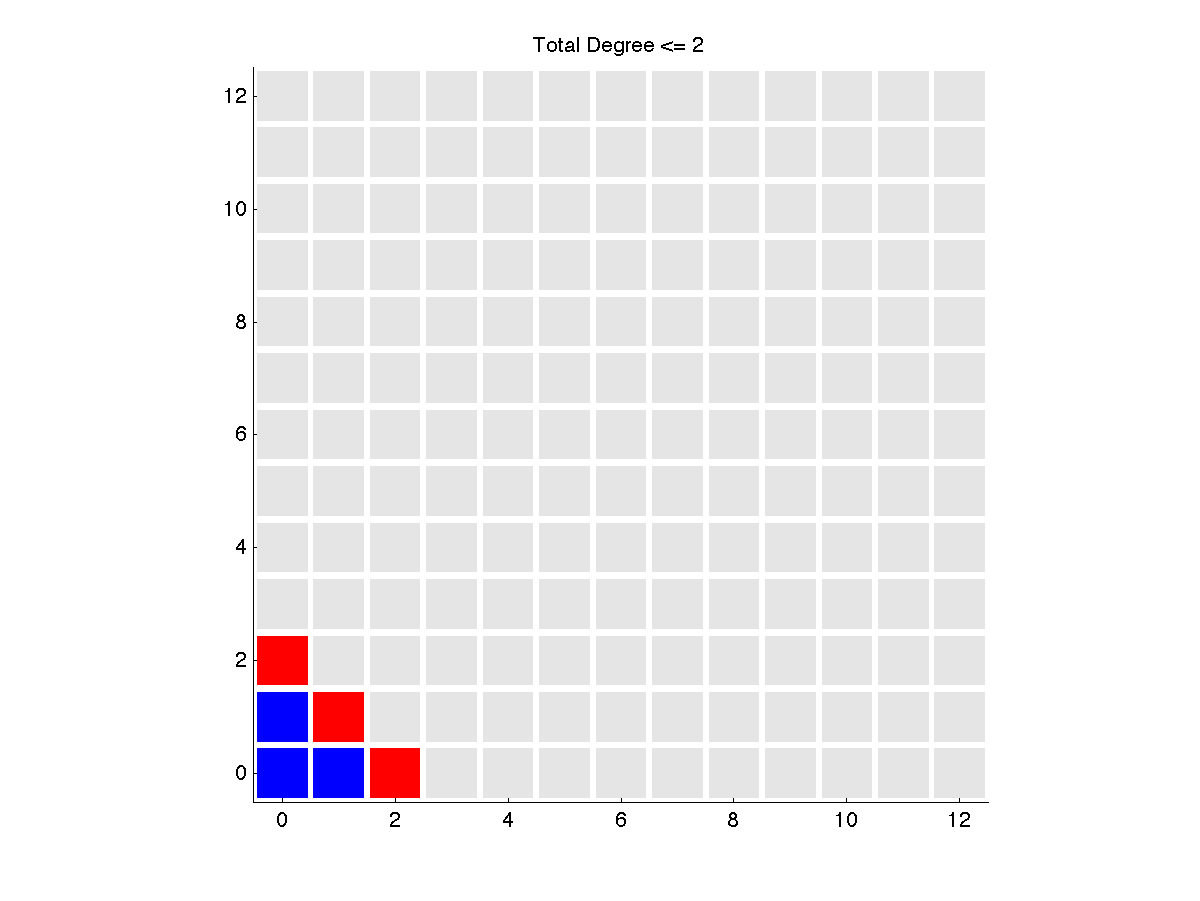
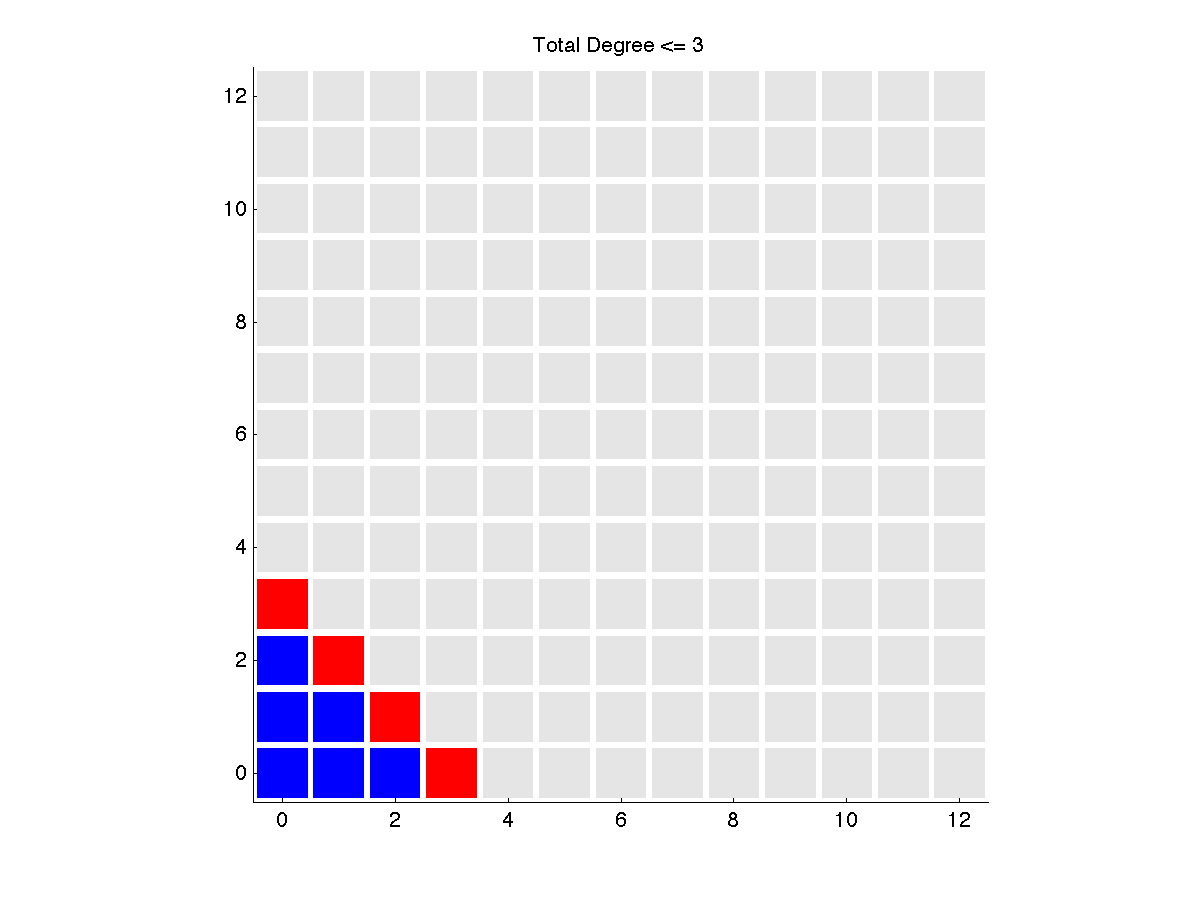
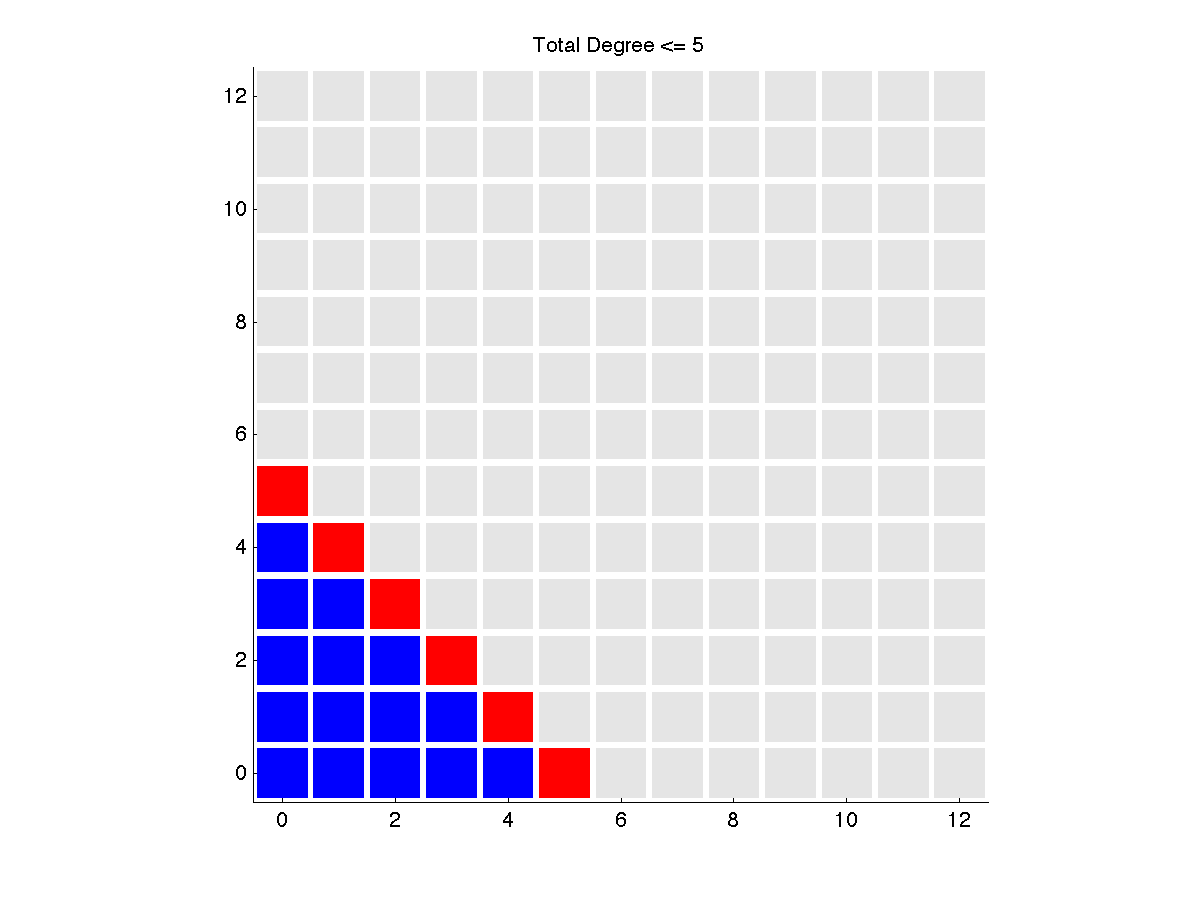
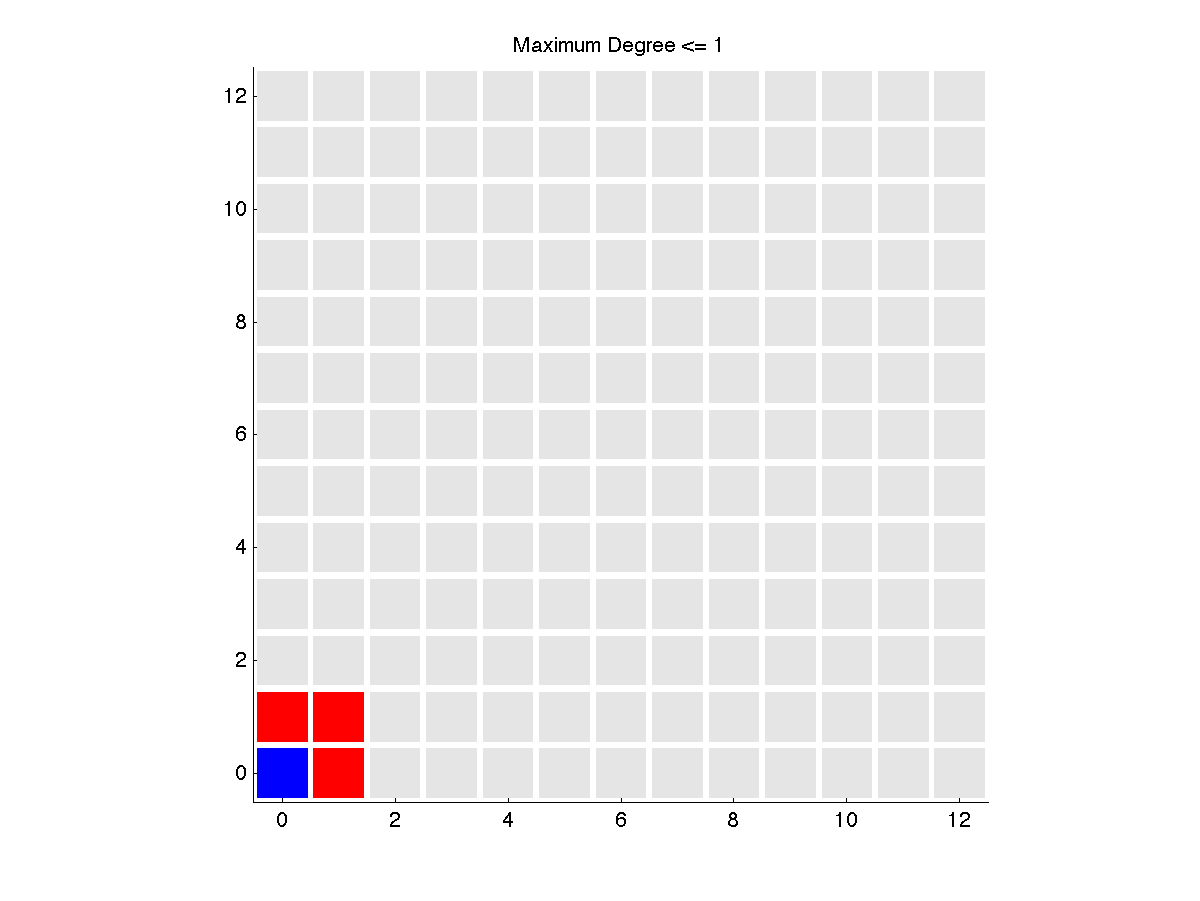
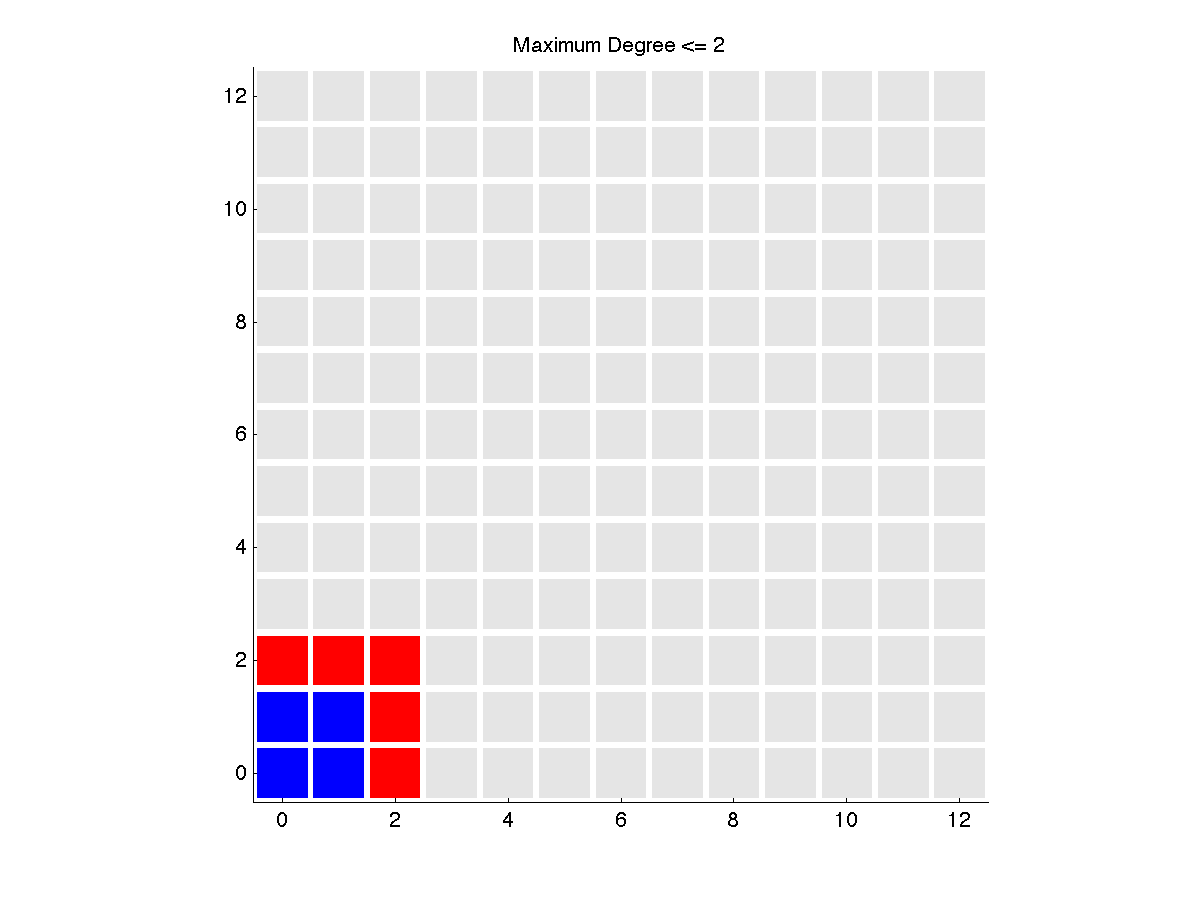
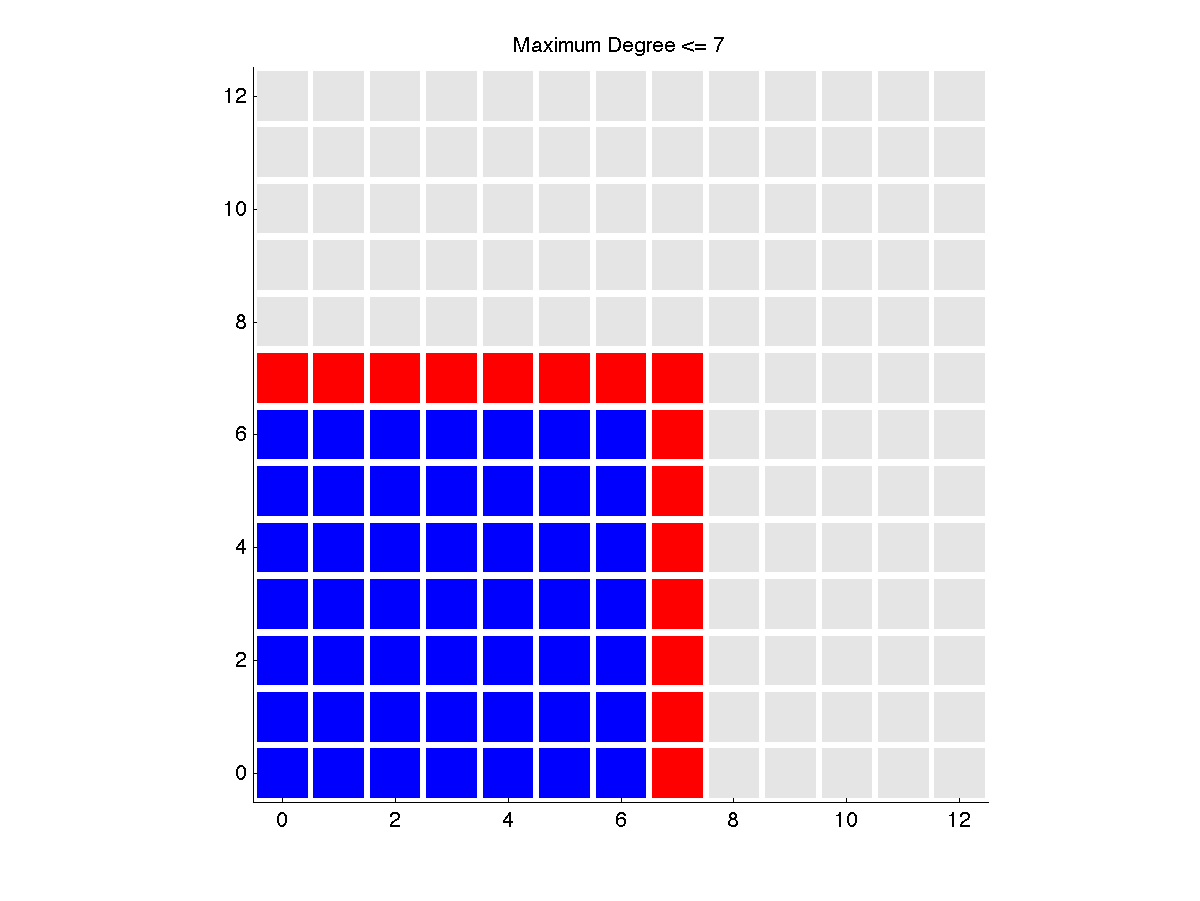
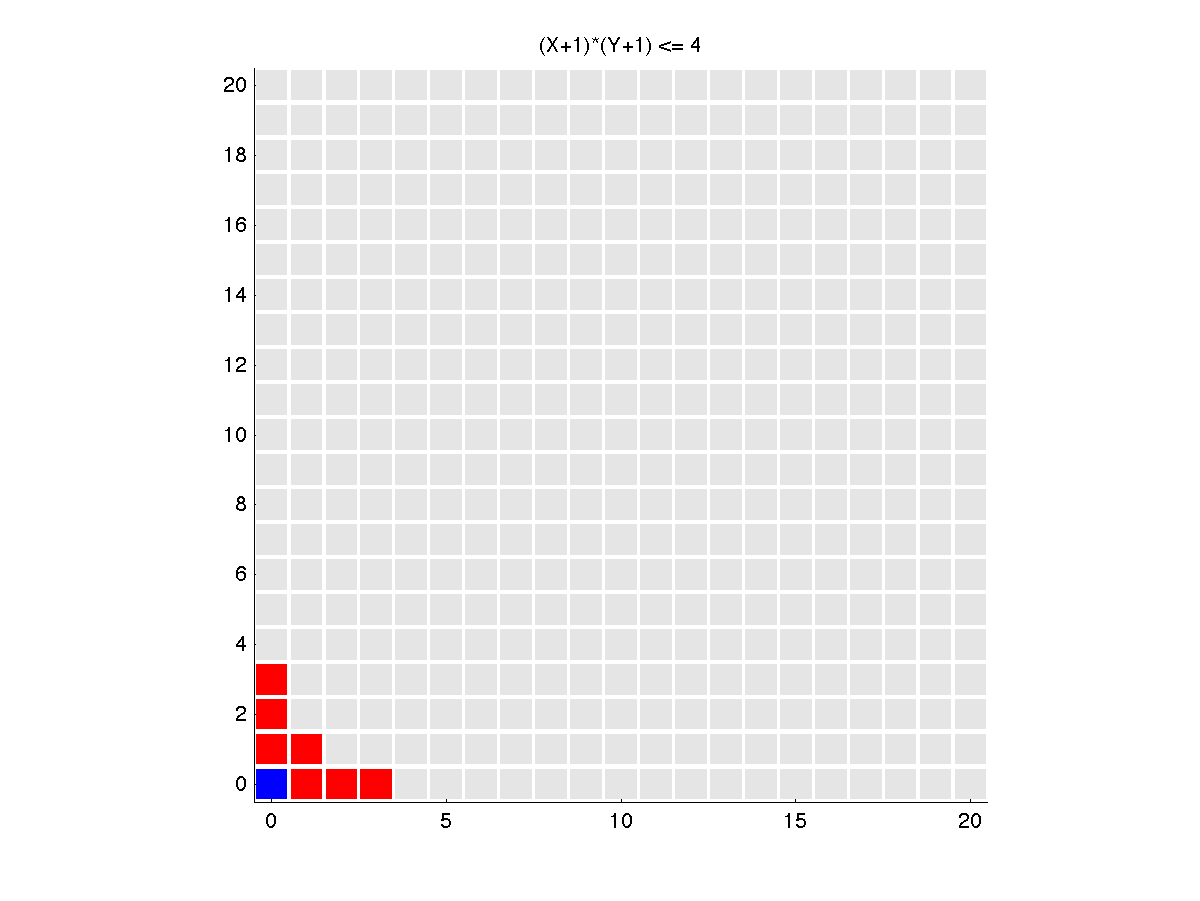
BOX_DISPLAY is a MATLAB program which creates a plot over a range of integer boxes, whose default color is gray, but some of which can be painted red (new stuff) and some painted blue (old stuff)
box_display ( m, n, @blue, @red, title )where
The computer code and data files described and made available on this web page are distributed under the GNU LGPL license.
BAR_PLOT, a FORTRAN90 program which reads a set of data from a file and creates a bar plot.
BOX_PLOT, a MATLAB program which displays a box plot of data that consists of pairs of integers;
CC_DISPLAY, a MATLAB program which displays the abscissas used in various kinds of Clenshaw Curtis quadrature rules.
GL_DISPLAY, a MATLAB program which displays the abscissas used in various kinds of Gauss Legendre quadrature rules.
GRIDLINES, a MATLAB library which gives the user more control over drawing gridlines on a graph than the builtin "grid on" command.
PLOT_POINTS, a FORTRAN90 program which reads a set of points from a file and plots them into an Encapsulated PostScript file.
XY_DISPLAY, a MATLAB program which reads a set of 2D points from a file and plots them in a the MATLAB graphics window.
XYF_DISPLAY, a MATLAB program which reads XYF information defining points and faces in 2D, and displays an image in a MATLAB graphics window.
XYL_DISPLAY, a MATLAB program which reads XYL information defining points and lines in 2D, and displays an image in a MATLAB graphics window.
XYZ_DISPLAY, a MATLAB program which reads a set of 3D points from a file and plots them in a the MATLAB graphics window.
TD represents the total degree polynomials for which D1 + D2 <= L. Blue indicates "old" data, and red "new".
MD represents the maximum degree polynomials for which max ( D1, D2 ) <= L. Blue indicates "old" data, and red "new".
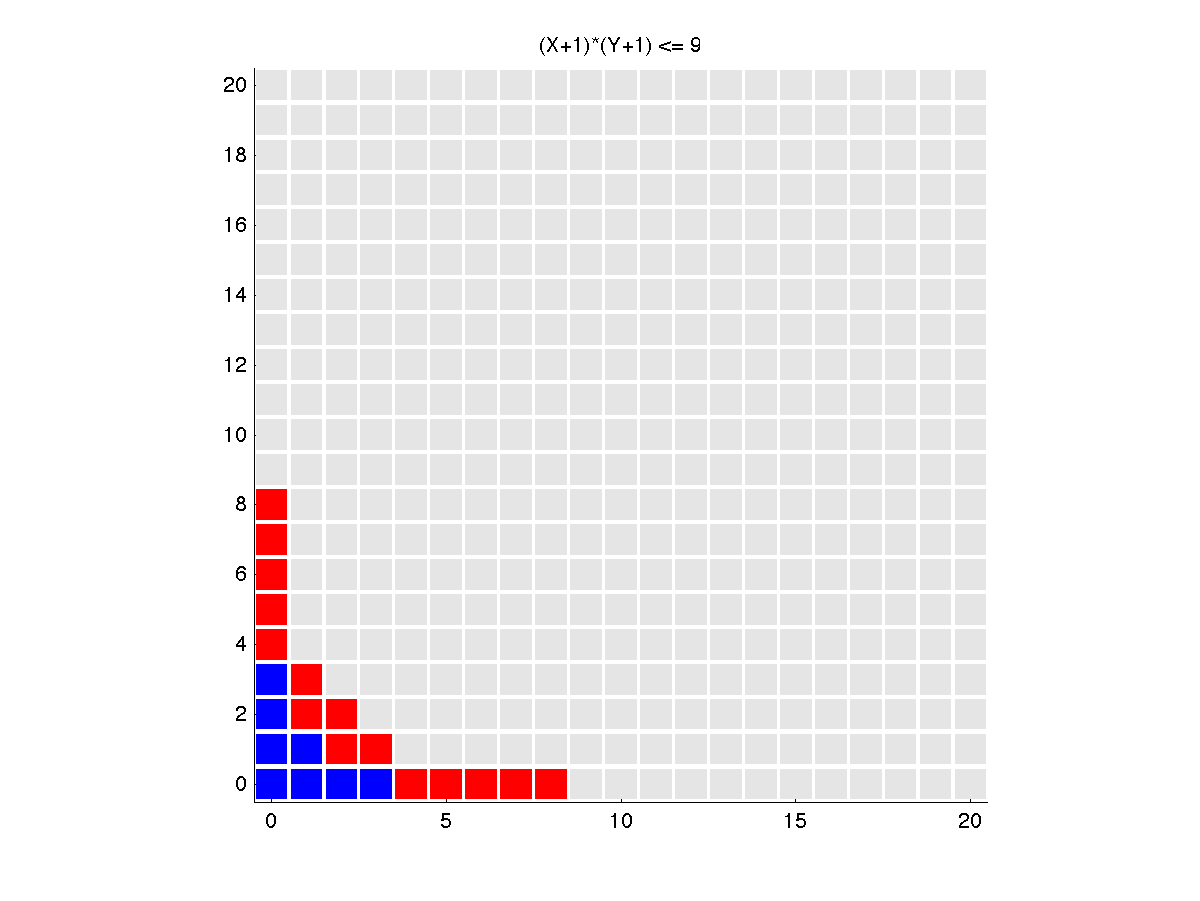
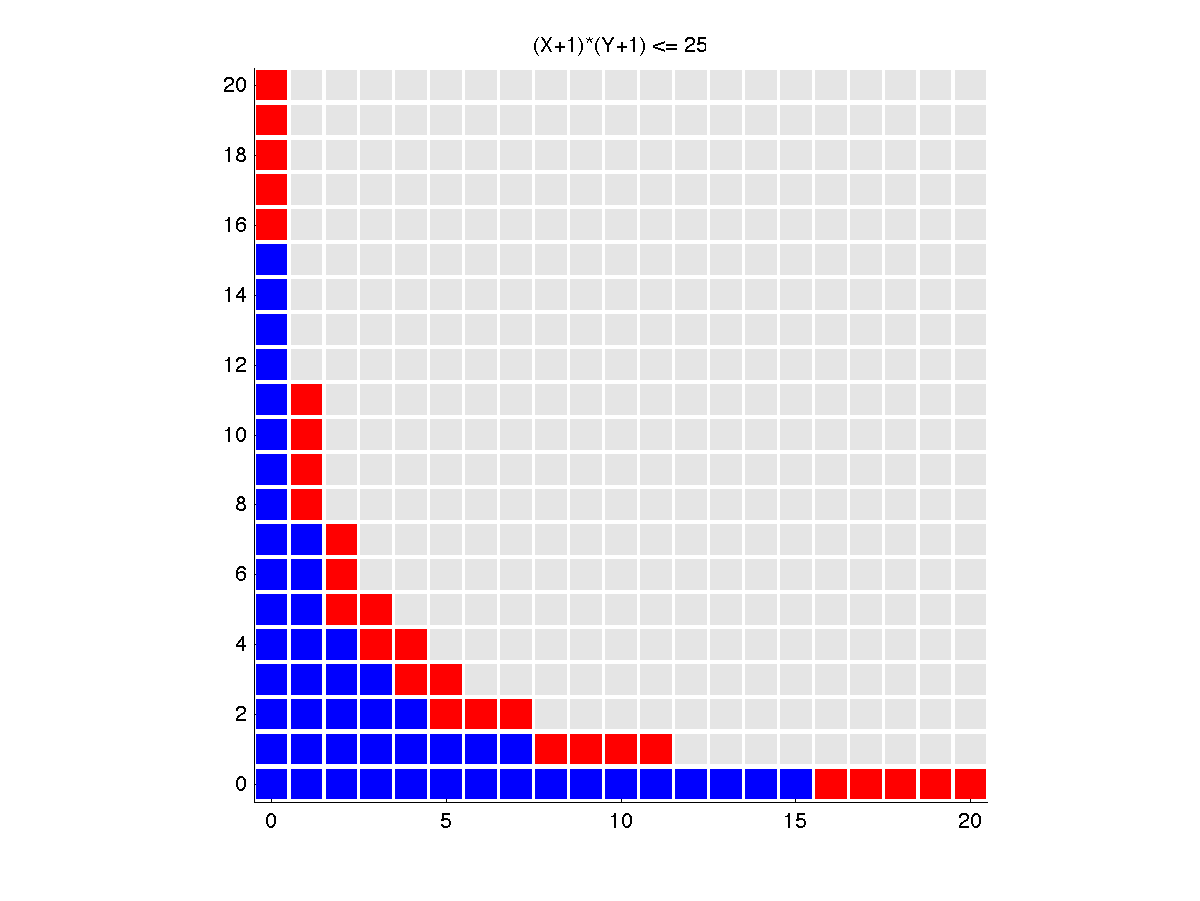
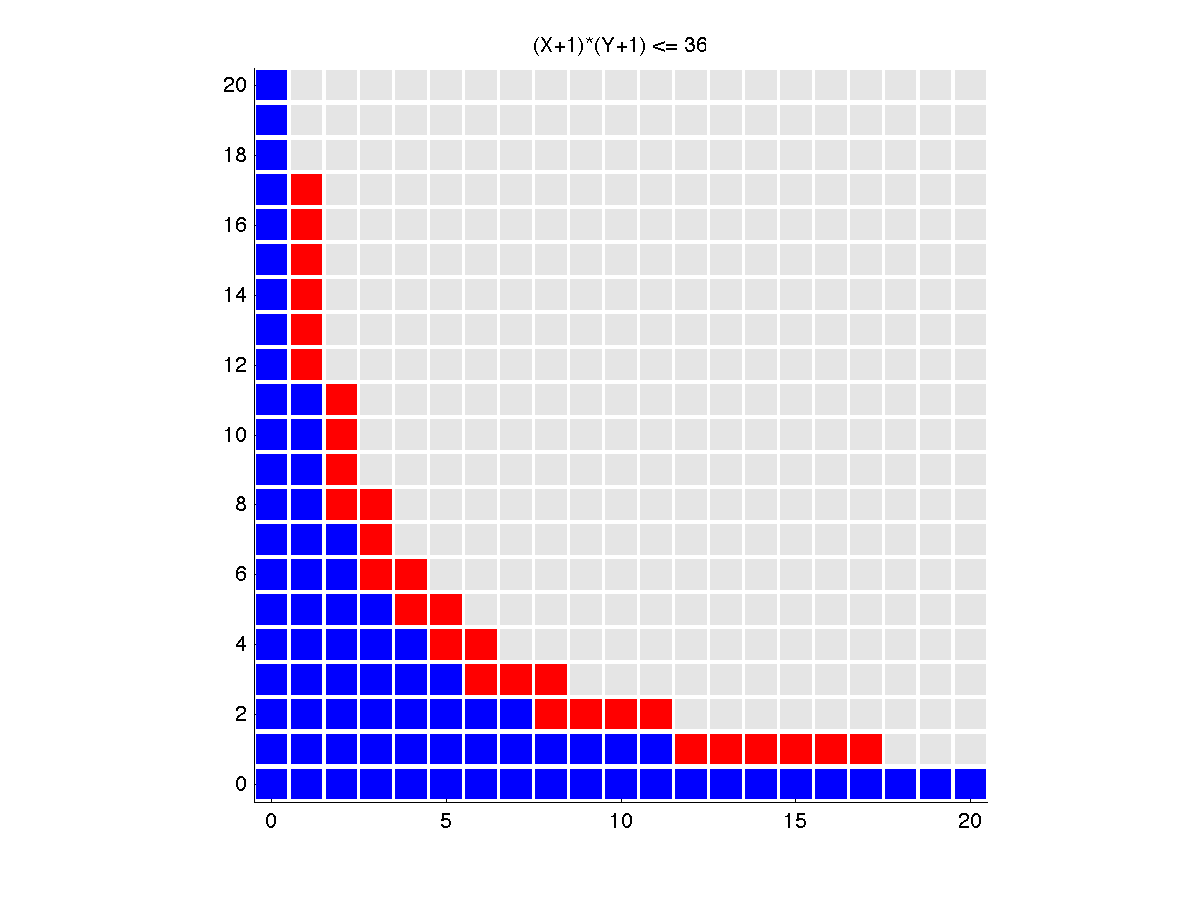
HC represents the hyperbolic cross polynomials for which (D1+1)*(D2+1) <= L. Blue indicates "old" data, and red "new".
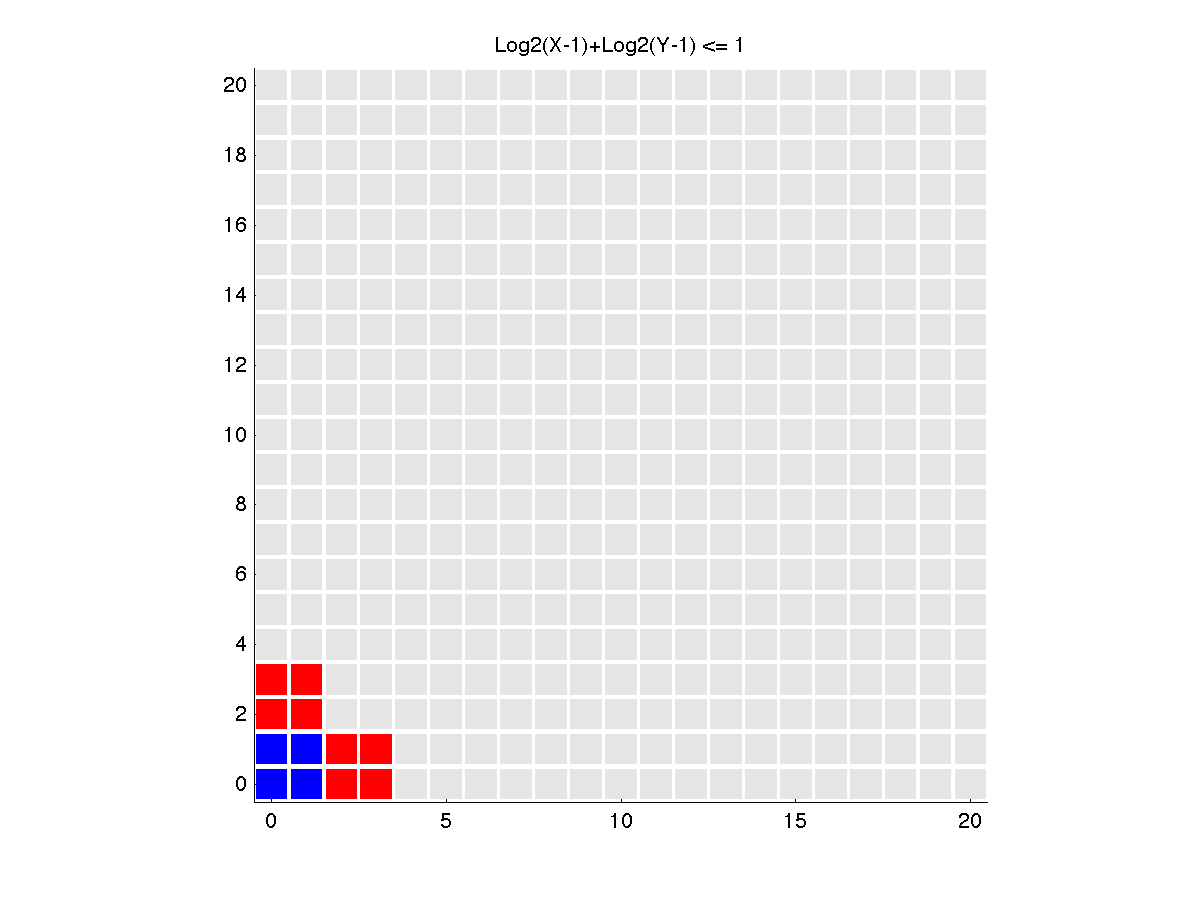
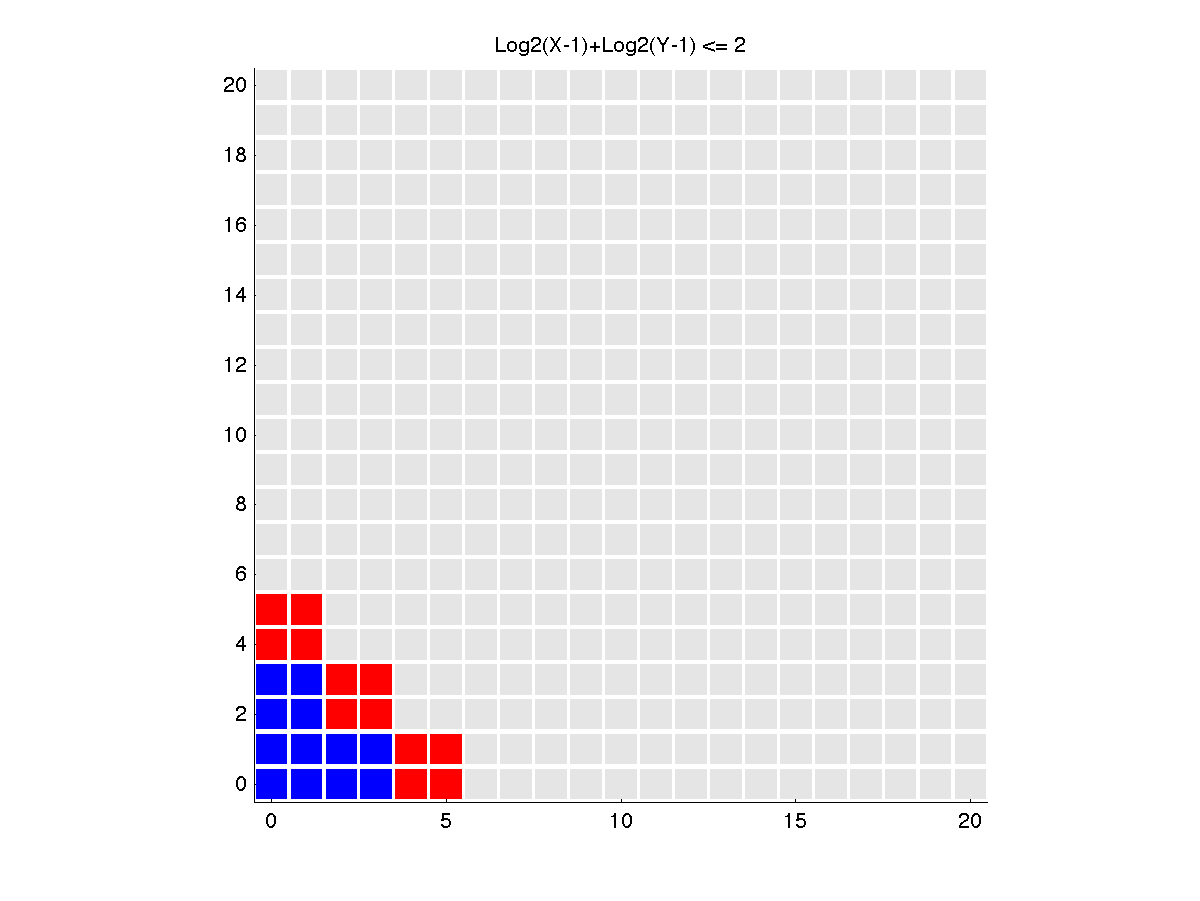
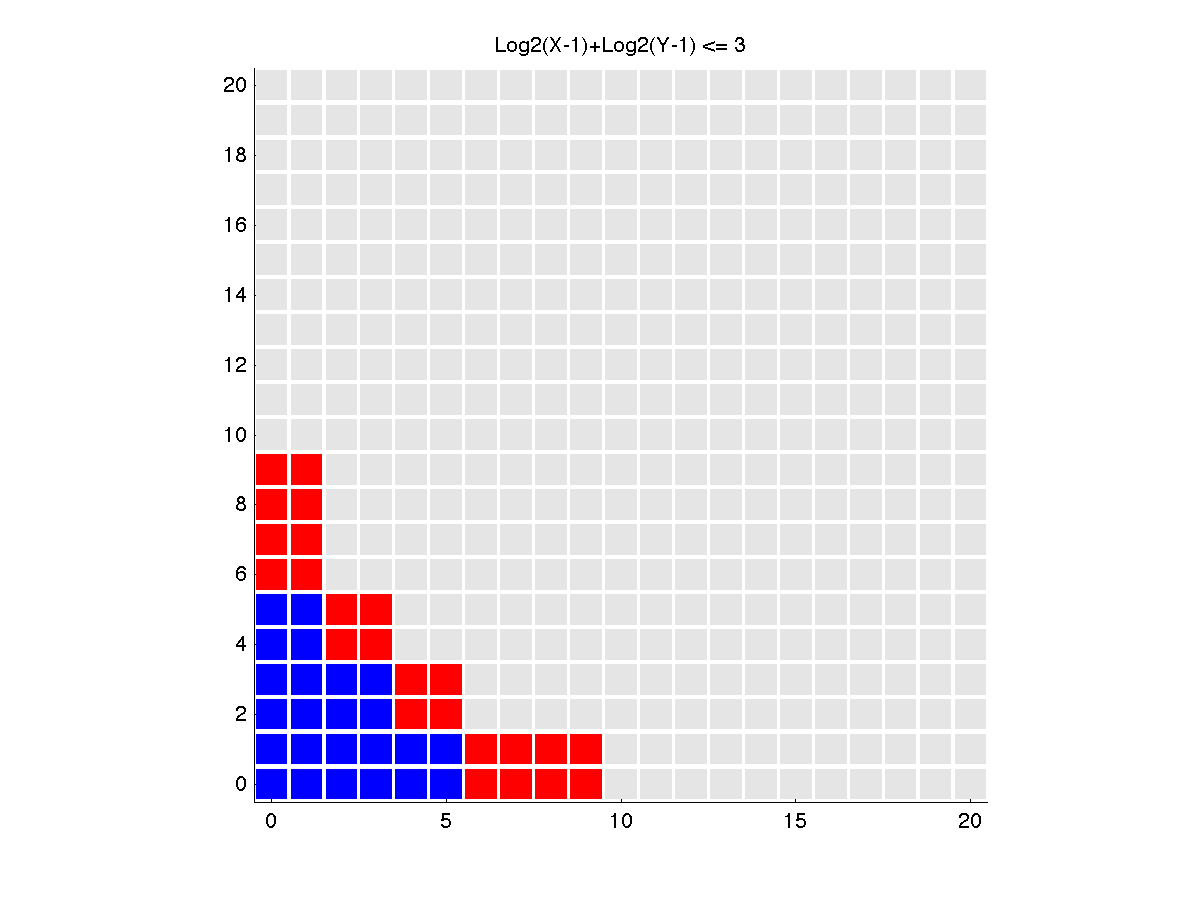
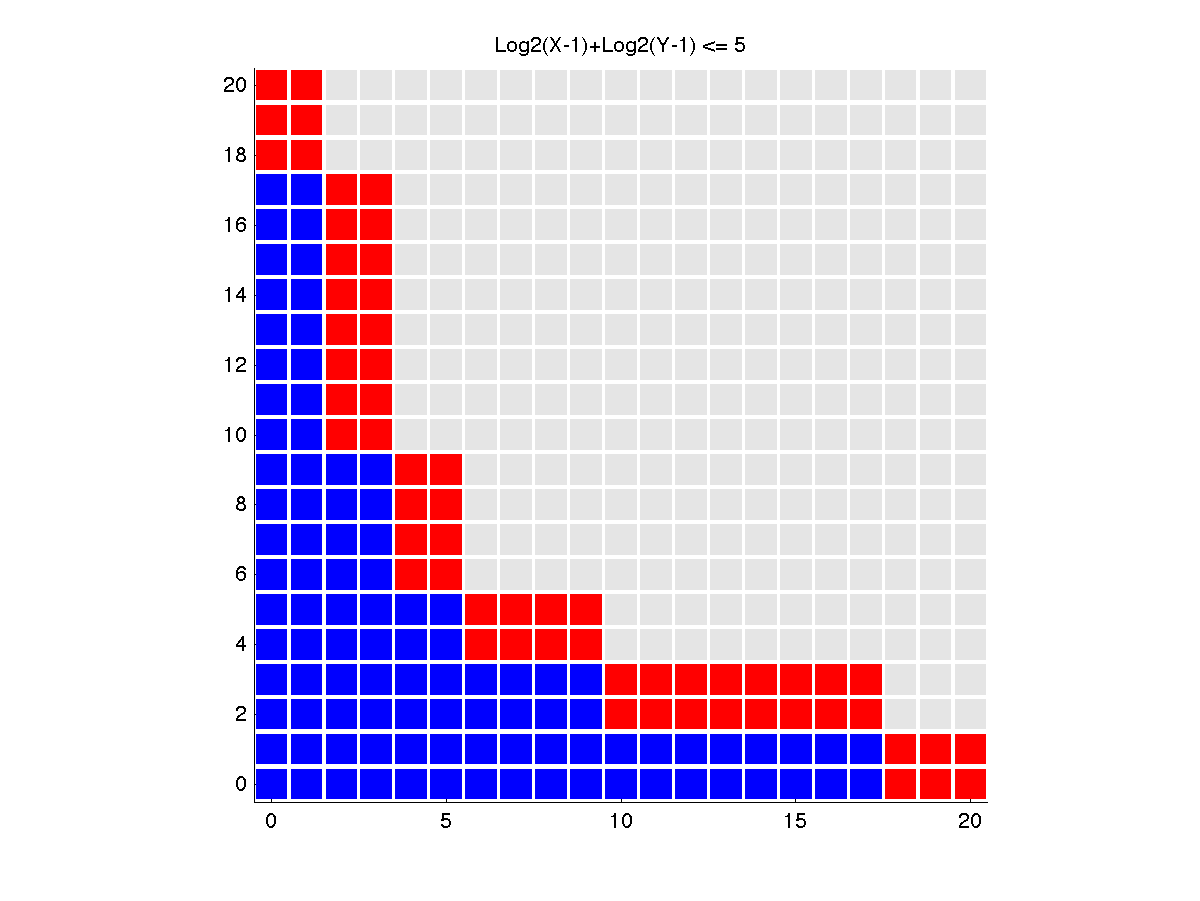
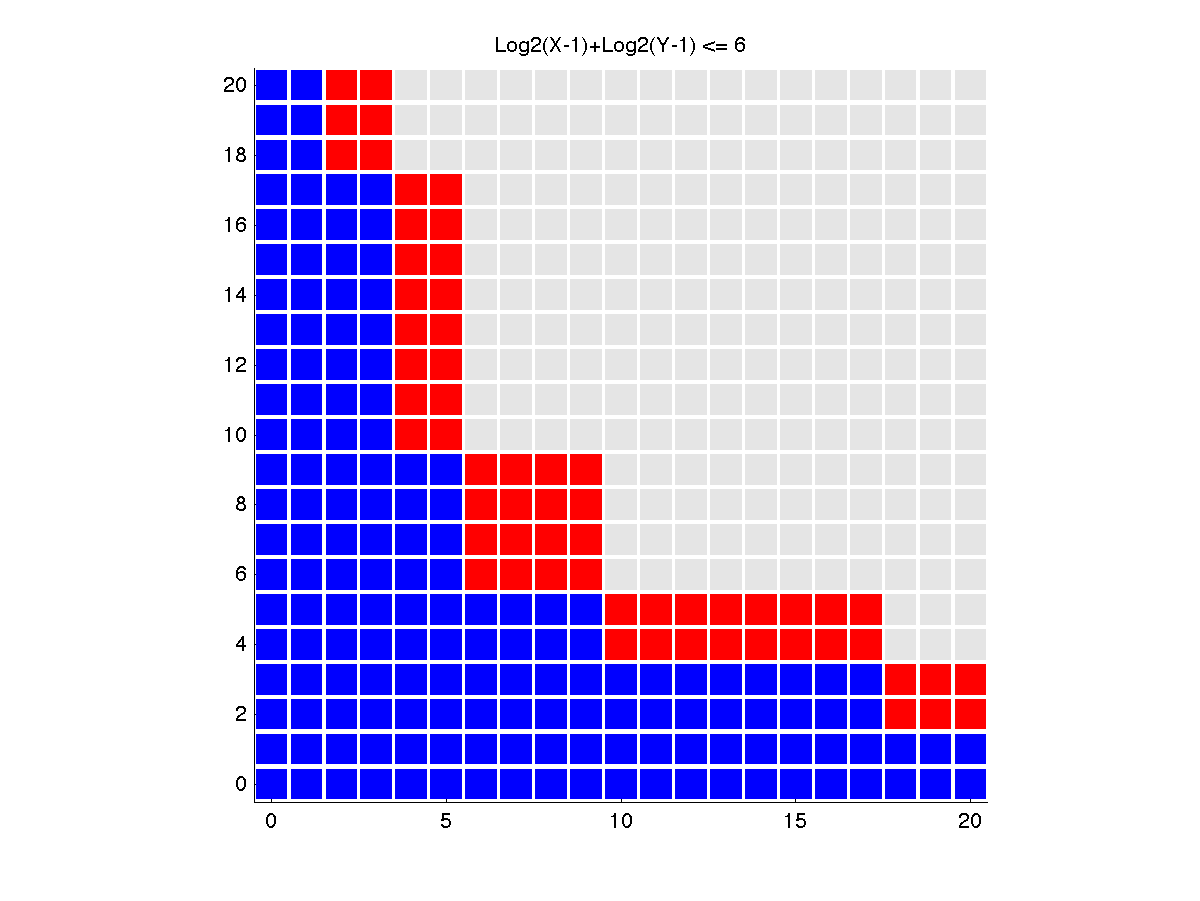
CC represents the Smolyak Clenshaw Curtis polynomials for which log2(D1-1)+log2(D2-1) <= L. Blue indicates "old" data, and red "new".
You can go up one level to the MATLAB source codes.