BOX_PLOT is a MATLAB program which reads a file of integer coordinates and associated colors, and makes a plot, placing a unit box of the given color at each coordinate.
box_plot ( 'input_filename' )where
The computer code and data files described and made available on this web page are distributed under the GNU LGPL license.
BAR_PLOT, a FORTRAN90 program which reads a set of data from a file and creates a bar plot.
CC_DISPLAY, a MATLAB program which displays the abscissas used in various kinds of Clenshaw Curtis quadrature rules.
GL_DISPLAY, a MATLAB program which displays the abscissas used in various kinds of Gauss Legendre quadrature rules.
GRIDLINES, a MATLAB library which gives the user more control over drawing gridlines on a graph than the builtin "grid on" command.
PLOT_POINTS, a FORTRAN90 program which reads a set of points from a file and plots them into an Encapsulated PostScript file.
XY_DISPLAY, a MATLAB program which reads a set of 2D points from a file and plots them in a the MATLAB graphics window.
XYF_DISPLAY, a MATLAB program which reads XYF information defining points and faces in 2D, and displays an image in a MATLAB graphics window.
XYL_DISPLAY, a MATLAB program which reads XYL information defining points and lines in 2D, and displays an image in a MATLAB graphics window.
XYZ_DISPLAY, a MATLAB program which reads a set of 3D points from a file and plots them in a the MATLAB graphics window.
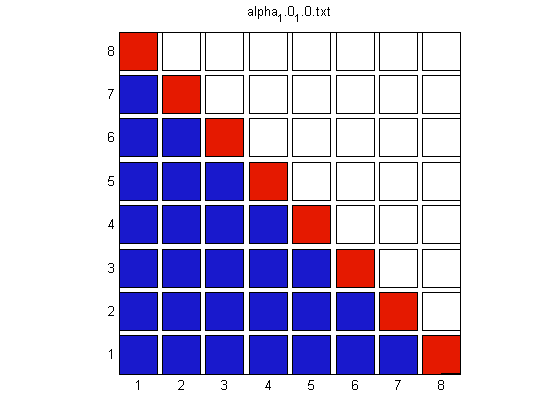
ALPHA_1.0_1.0 prints some of the 64 pairs of values on an 8 by 8 grid. Blue indicates "old" data, and red "new".
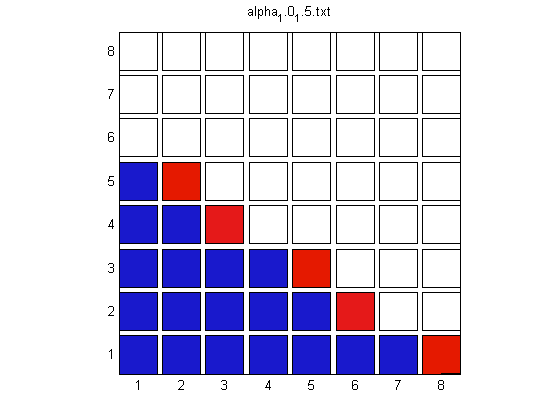
ALPHA_1.0_1.5 prints some of the 64 pairs of values on an 8 by 8 grid. Blue indicates "old" data, and red "new".
ALPHA_1.0_2.0 prints some of the 64 pairs of values on an 8 by 8 grid. Blue indicates "old" data, and red "new".
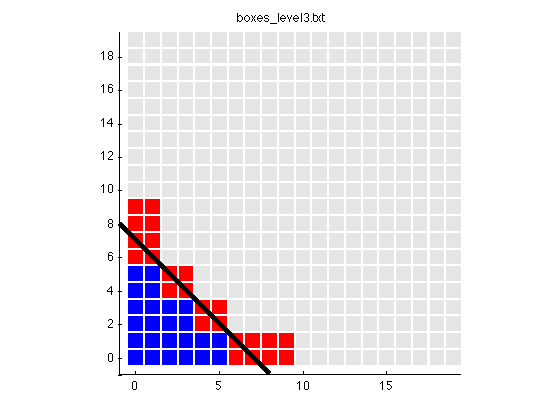
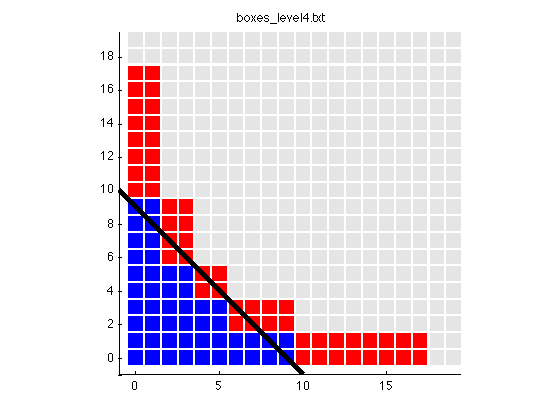
BOXES suggests the monomials that are exactly integrated by a 2D Clenshaw-Curtis sparse grid of levels 0 through 4. Monomials added on this level are red, old ones are blue. A common 20x20 grid is used for all the plots.
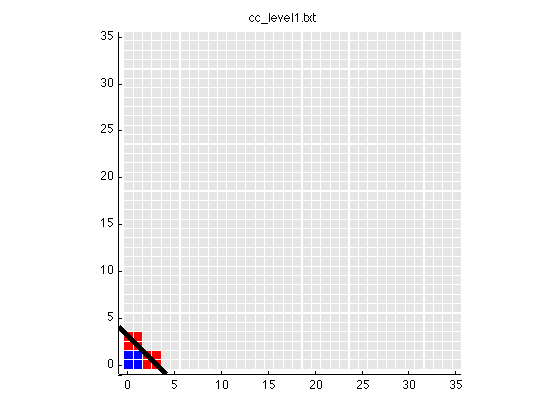
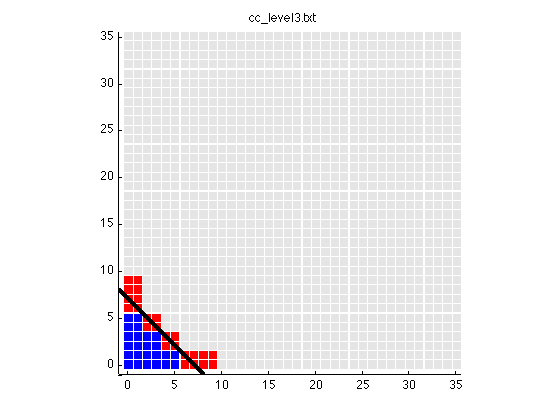
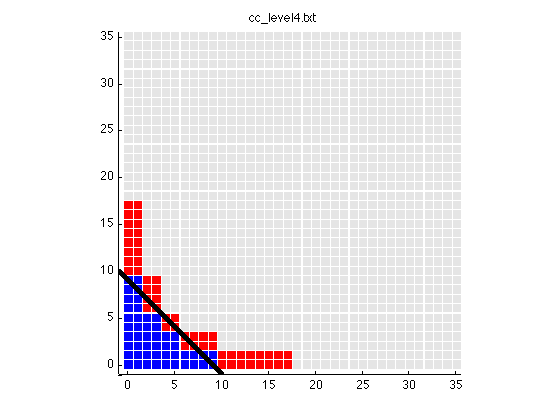
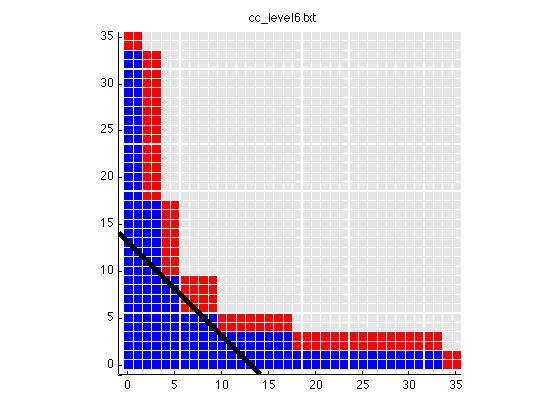
CC looks at the monomials that are exactly integrated by 2D Clenshaw-Curtis sparse grids of levels 0 through 6, using a common 35x35 grid.
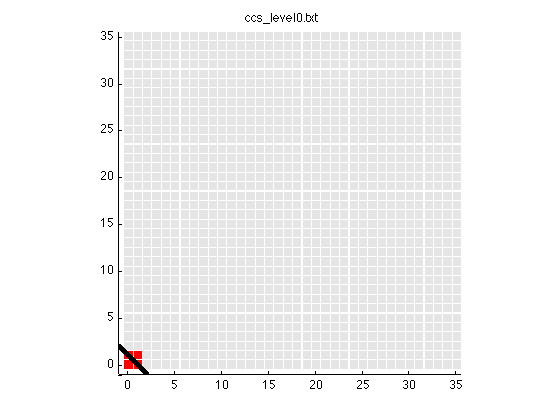
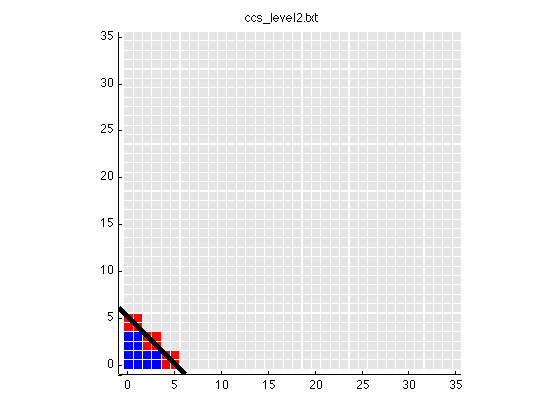
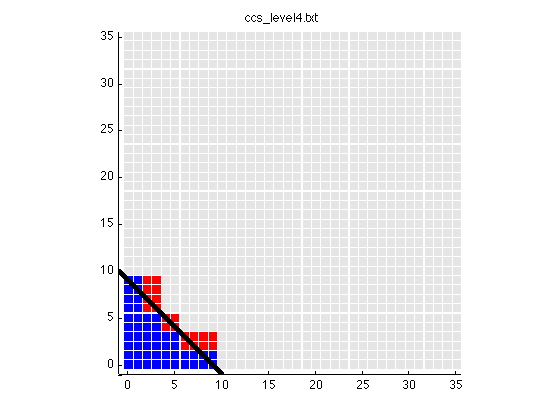
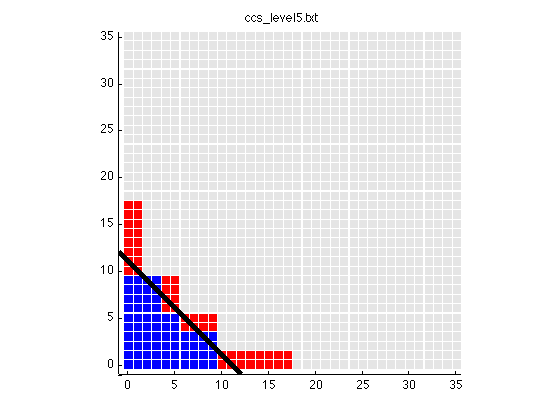
CCS looks at the monomials that are exactly integrated by 2D Clenshaw-Curtis "Slow exponential" sparse grids of levels 0 through 6, using a common 35x35 grid. This is a variant of the Clenshaw Curtis rule that tries to delay the exponential growth of the orders. Differences only appear once level 4 has been reached.
CHECKERBOARD is a set of 64 pairs of integers and colors that correspond to a checkerboard.
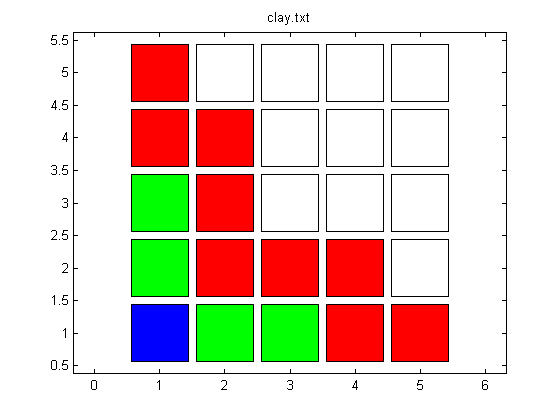
CLAY is a set of pairs of integers that record the basic method (1,1) in blue, some low order methods in green, and secondary refinements in red.
F is a set of points that can make the letter F:
You can go up one level to the MATLAB source codes.