GL_DISPLAY is a MATLAB library which displays the abscissas used in a 2D Gauss-Legendre product quadrature rule.
The computer code and data files described and made available on this web page are distributed under the GNU LGPL license.
BOX_PLOT, a MATLAB program which can color in specified entries of a checkerboard, corresponding to pairs of integer data.
CC_DISPLAY, a MATLAB library which displays a Clenshaw Curtis product rule quadrature grids in 2D.
CLENSHAW_CURTIS_RULE, a MATLAB library which defines a Clenshaw Curtis quadrature rule.
FEKETE, a MATLAB library which defines a Fekete rule for quadrature or interpolation over a triangle.
GRID_DISPLAY, a MATLAB library which can display a 2D or 3D grid or sparse grid.
GRIDLINES, a MATLAB library which gives the user more control over drawing gridlines on a graph than the builtin "grid on" command.
INTLIB, a FORTRAN90 library which defines routines for numerical estimation of integrals in 1D.
NESTED_SEQUENCE_DISPLAY, a MATLAB program which displays a set of nested sequences.
QUADRULE, a MATLAB library which defines quadrature rules.
STROUD, a MATLAB library which defines quadrature rules for a variety of unusual areas, surfaces and volumes in 2D, 3D and N-dimensions.
TENSOR_GRID_DISPLAY, a MATLAB program which can display the grid points of a tensor product rule used for interpolation or quadrature, in 1D, 2D or 3D.
GL_GRID_SQUARE_DISPLAY displays Gauss-Legendre grids in which the orders of each dimension are equal.
GL_GRID_DISPLAY displays Gauss-Legendre grids in which the orders of each dimension are arbitrary.
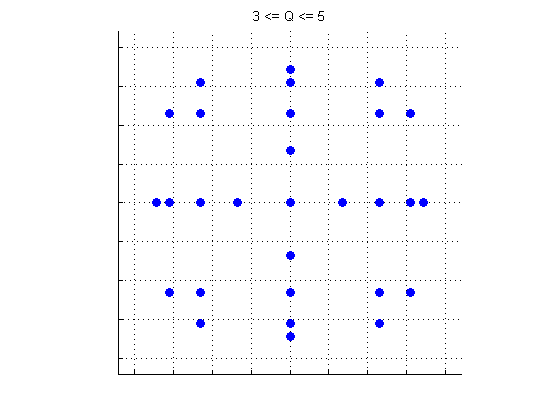
GL_GRIDS_MINMAX_DISPLAY displays all Gauss-Legendre grids in which the orders of each dimension sum to a value Q between QMIN and QMAX.
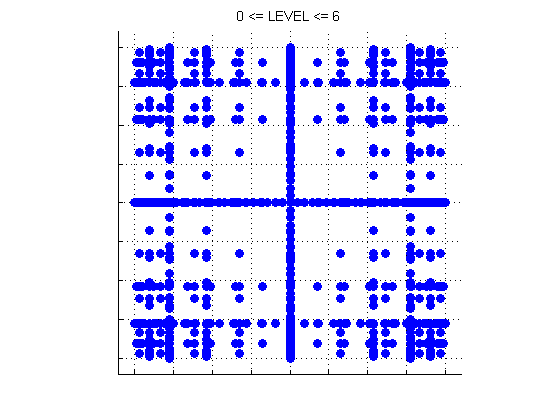
GL_LEVELS_MINMAX_DISPLAY displays all Gauss-Legendre grids in which the levels of each dimension sum to a value LEVEL between LEVEL_MIN and LEVEL_MAX.
You can go up one level to the MATLAB source codes.