GRAPHICS_EXAMPLES, MATLAB programs which illustrate how various kinds of data can be displayed and analyzed graphically.
The computer code and data files described and made available on this web page are distributed under the GNU LGPL license.
GRAPHICS_EXAMPLES programs are available in a C version and a C++ version and CONVERT and a dataset version and a FORTRAN77 version and a FORTRAN90 version and GNUPLOT and GRACE and a MATHEMATICA version and a MATLAB version.
HISTOGRAM_DISPLAY, a MATLAB program which makes a bar plot of a set of data stored as columns in a file; the first column is the X values, and all the other columns are Y values to be shown as a stack of bars;
MESH_DISPLAY, a MATLAB program which reads data defining a polygonal mesh and displays it, with optional numbering.
XY_DISPLAY, a MATLAB program which reads XY information defining points in 2D, and displays an image in a MATLAB graphics window;
XYF_DISPLAY, a MATLAB program which reads XYF information defining points and faces in 2D, and displays an image in a MATLAB graphics window.
XYL_DISPLAY, a MATLAB program which reads XYL information defining points and lines in 2D, and displays an image in a MATLAB graphics window.
AUTOMOBILE contains 205 records, with 26 attributes, describing properties of cars available in 1985, taken from the UCI Machine Learning Repository. Some data values are missing, and are indicated by '?'. The data is comma separated, and includes text, integers, and real values. Our interest is to make a scatter plot of certain pairs of real attributes.
CIRCLE_INOUT depicts 500 pairs of (X,Y) data points in the unit square, 395 of which lie inside the unit circle, and 105 outside. If possible, the "inside" points should be blue, the "outside" points red, and the circle itself should also be drawn.
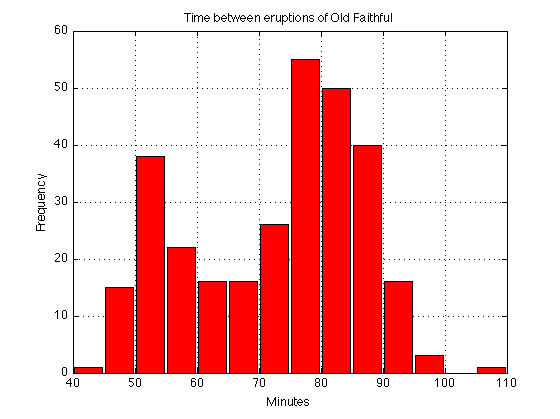
GEYSER contains the waiting time in minutes between successive eruptions of the Old Faithful geyser. 299 values are recorded. The data ranges from 43 to 108. It should be displayed in 14 bins of width 5 from 40 to 110. The data comes from Martinez and Martinez.
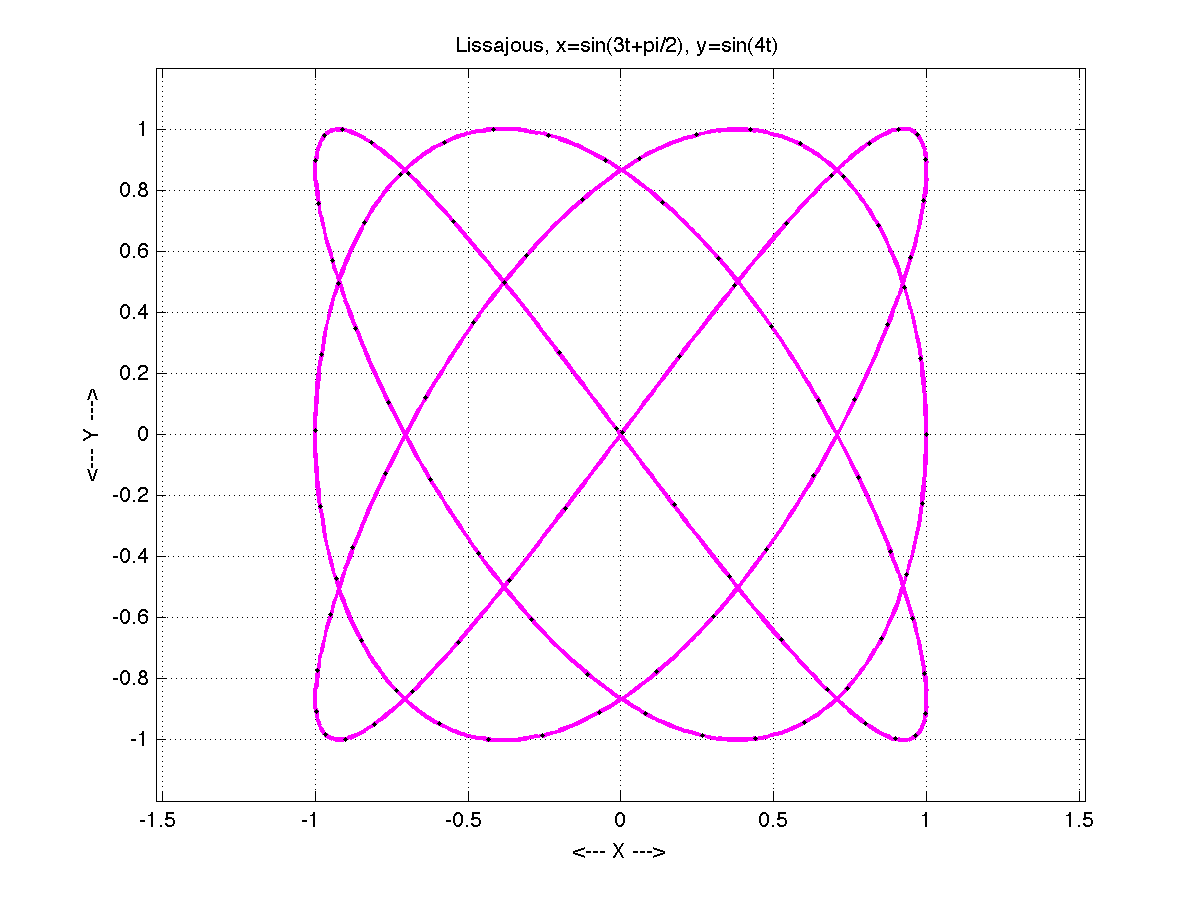
LISSAJOUS records 1000 points on a Lissajous curve defined by x=sin(3*t+pi/2), y=sin(4t). The curve is to be plotted and every tenth point marked.
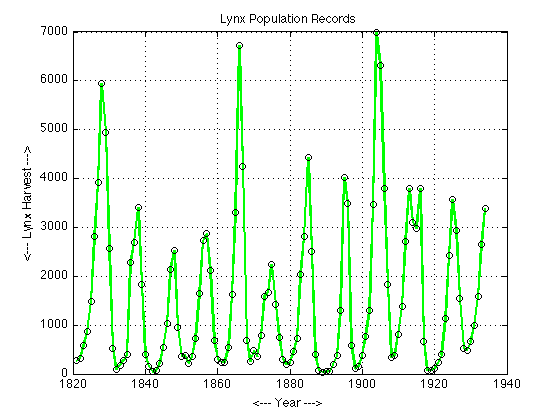
LYNX records the yearly lynx harvest from 1821 to 1934. The graph should plot the data points as circles, and connect consecutive data points with straight line segments to suggest a curve.
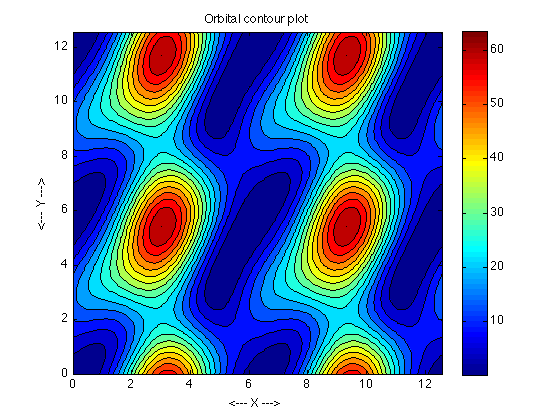
ORBITAL records, on a 101x101 grid over [0,4*pi]x[0,4*pi], the minimum distance between two planets given a pair of orbital angles. A contour plot of this data is to be presented.
SCATTER_PLOT generates 500 pairs of (X,Y) data, which lie in the unit square, and tend to cluster around (0.5,0.5).
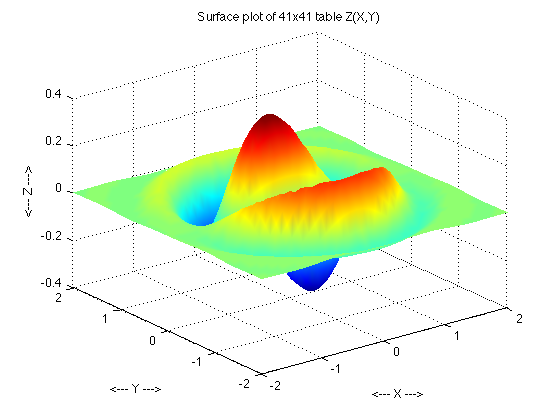
SURFACE_GRID records, on a 41x41 grid over [-2,2]x[-2,+2], the values z = exp(-(x^2+y^2)) * cos(0.25*x) * sin(y) * cos(2*(x^2+y^2)). The data is to be plotted as a surface.
You can go up one level to the MATLAB source codes.