GRF_DISPLAY is a MATLAB program which reads a GRF file containing information about an abstract graph and displays a plot in the MATLAB graphics window.
grf_display prefixor
grf_display ( 'prefix' )where
The computer code and data files described and made available on this web page are distributed under the GNU LGPL license.
GRAFFITI, a dataset directory which contains 195 abstract graphs, with adjacency and embedding information, stored in the GRF format.
GRAPH_REPRESENTATION, a data directory of examples of ways of representing abstract mathematical graphs
GRF, a data directory which contains a description of the GRF format and some examples.
GRF_DISPLAY_OPENGL, a C++ program which reads a GRF file defining a mathematical graph and displays it in an OpenGL graphics window.
GRF_IO, a MATLAB library which reads and writes files in the GRF format.
GRF_TO_EPS, a FORTRAN90 program which can make an encapsulated PostScript image of a GRF file.
GRF_TO_XYL, a FORTRAN90 program which converts information describing the adjacency and embedding of an abstract graph from GRF to XYL format.
GRID_DISPLAY, a MATLAB library which can display a 2D or 3D grid or sparse grid.
GRIDLINES, a MATLAB library which gives the user more control over drawing gridlines on a graph than the builtin "grid on" command.
PLY_DISPLAY, a MATLAB program which displays an image of a 3D graphics file in PLY format;
XY_DISPLAY, a MATLAB program which reads an XY file containing the coordinates of points in 2D, and displays an image in a MATLAB graphics window;
XYF_DISPLAY, a MATLAB program which reads XYF information defining points and faces in 2D, and displays an image in a MATLAB graphics window.
XYL, a data directory which contains examples of XYL files, a simple 2D graphics point and line format;
XYL_DISPLAY, a MATLAB program which reads XYL information defining points and lines in 2D, and displays an image in a MATLAB graphics window.
XYZL_DISPLAY, a MATLAB program which reads XYZL information defining points and lines in 3D, and displays an image in a MATLAB graphics window.
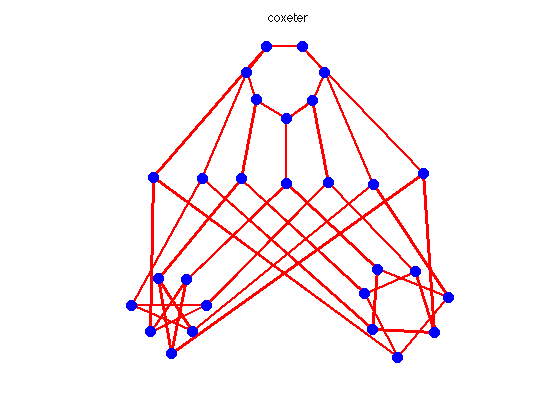
COXETER is the Coxeter graph.
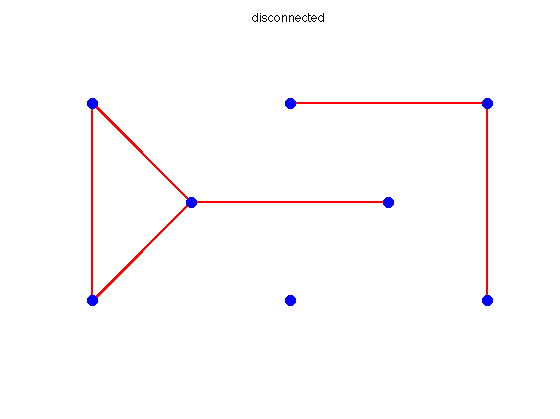
DISCONNECTED is a disconnected graph.
MST is a graph associated with a minimum spanning tree problem.
SIMPLE is a graph associated with a simple graph.
TSP is a complete graph associated with a traveling salesman problem.
You can go up one level to the MATLAB source codes.