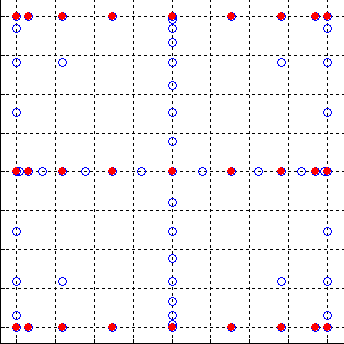
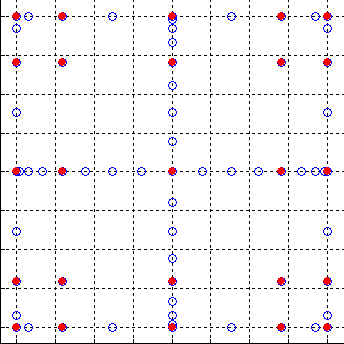
GRIDS_DISPLAY is a MATLAB program which can read two ASCII files defining grids or sparse grids in 2D or 3D. The first grid is plotted "lightly", in hollow blue dots, while the second is plotted with solid red dots. The image is automatically saved to a PNG file.
grids_display ( 'file_name1', 'file_name2', rmin, rmax )where
The computer code and data files described and made available on this web page are distributed under the GNU LGPL license.
CC_DISPLAY, a MATLAB program which displays points on various grids derived from the Clenshaw Curtis rule.
GL_DISPLAY, a MATLAB program which displays points on various grids derived from the Gauss-Legendre rule.
GRID_DISPLAY, a MATLAB program which reads a file of points on a grid or sparse grid, displays the grid and saves the image in a PNG file;
GRIDLINES, a MATLAB library which gives the user more control over drawing gridlines on a graph than the builtin "grid on" command.
QUADRATURE_RULES, a dataset directory which contains quadrature rules; a number of examples of sparse grid quadrature rules are included.
SPARSE_GRID_CC, a dataset directory which contains some sample sparse grids from the Clenshaw Curtis rule.
SPARSE_GRID_F2, a dataset directory which contains some sample sparse grids from the Fejer Type 2 rule.
SPARSE_GRID_GP, a dataset directory which contains some sample sparse grids from the Gauss Patterson rule.
SPARSE_GRID_HW, a MATLAB library which creates sparse grids based on Gauss-Legendre, Gauss-Hermite, Gauss-Patterson, or a nested variation of Gauss-Hermite rules, by Florian Heiss and Viktor Winschel.
SPARSE_GRID_NCC, a dataset directory which contains some sample sparse grids from the Newton Cotes Closed rule.
SPARSE_GRID_NCO, a dataset directory which contains some sample sparse grids from the Newton Cotes Open rule.
TENSOR_GRID_DISPLAY, a MATLAB program which can display the grid points of a tensor product rule used for interpolation or quadrature, in 1D, 2D or 3D.
XY, a data directory which contains some examples of 2D pointsets.
XY_DISPLAY, a MATLAB program which can read a file of coordinates of points, and display an image of the points in a MATLAB graphics window.
XY_DISPLAY_OPENGL, a C++ program which can read a file containing 2D point coordinates, and display an image of those points using Open GL.
A 2D example which illustrates how a Clenshaw Curtis sparse grid of level 4 is the sum of 5 Clenshaw Curtis product grids:
You can go up one level to the MATLAB source codes.