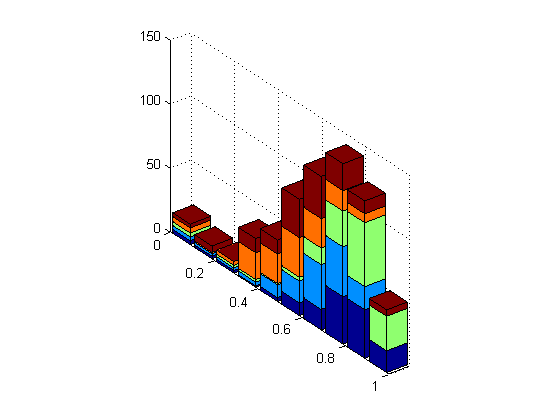
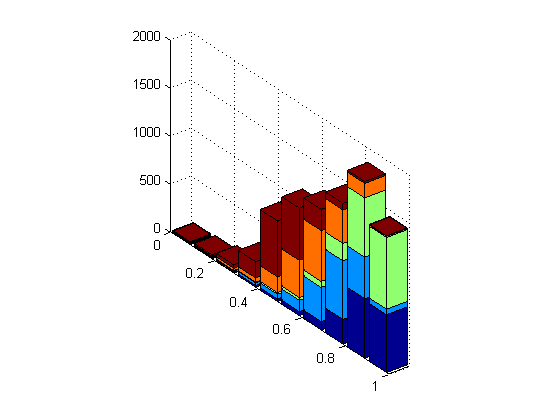
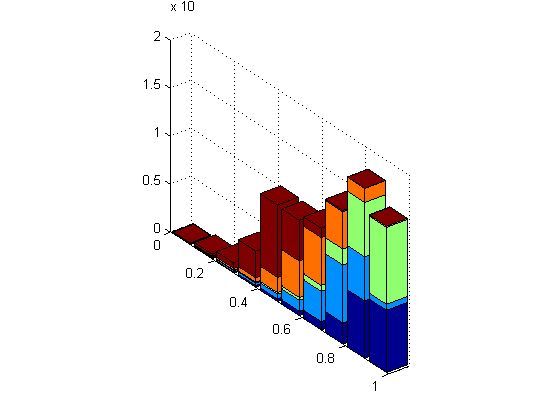
HISTOGRAM_DISPLAY is a MATLAB program which reads a data file of histogram data and displays it.
The data file is presumed to contain M columns of data, and each column having N items. The first column is assumed to be an ascending series of X coordinates, to be used as the centers of a series of bars. The other columns are assumed to be Y values associated with the bars. In other words, column 1 plus any other column makes a single histogram.
To keep things simple, the program plots all the histograms together, stacking the Y values. For some data, this may be the least confusing view.
histogram_display ('filename')where
The computer code and data files described and made available on this web page are distributed under the GNU LGPL license.
BAR_PLOT, a FORTRAN90 program which reads a table of data, and creates a bar plot.
TABLE, a file format which is used for the input data file.
TABLE_HISTOGRAM, a FORTRAN90 program which reads a table of data, and creates a histogrammed table suitable for input to histogram_plot.
You can go up one level to the MATLAB source codes.