MOC_DISPLAY is a MATLAB library of functions which estimate and plot the modulus of continuity function.
Given a function F(X) and an interval [A,B], the modulus of continuity may be defined as
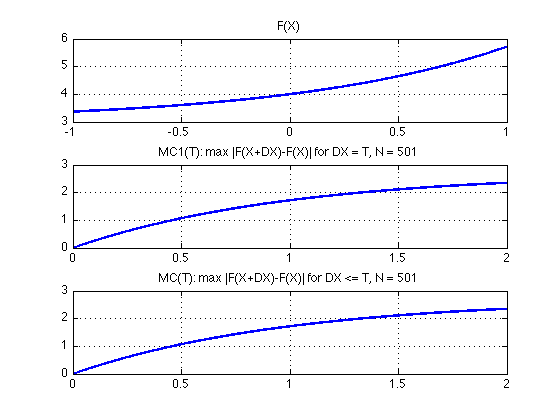
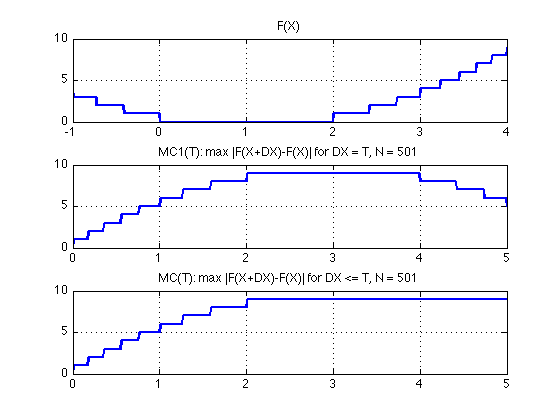
MC(T) = max | F(X+DX) - F(X) |, for 0 <= DX <= T, and X and X+DX in [A,B].The function MC(T) records the maximum change that can occur in F(X) over an interval of length T or less. MC(T) is a monotone increasing function.
For convenience, we define a related function
MC1(DX) = max | F(X+DX) - F(X) |, for 0 <= DX, and X and X+DX in [A,B].The function MC1(DX) records the maximum change that can occur in F(X) over an interval of length exactly DX. MC1(DX) need not be a strictly increasing function, particularly if F(X) is periodic.
moc_display ( a, b, n, @f )where
The computer code and data files described and made available on this web page are distributed under the GNU LGPL license.
F1 = cos ( 6 * pi * x ) .* exp ( - pi * x .* x );
F2 = cos ( 3 * pi * x );
F3 = x .* x + 0.5 * x - 2;
F4 = exp ( x ) + 3;
F5 = floor ( ( x - 1 ).^2 );
You can go up one level to the MATLAB source codes.