SPHERE_XYZ_DISPLAY is a MATLAB program which reads the name of a data file containing a list of 3D point coordinates, reads the data, and displays a unit sphere and the points in the MATLAB graphics window.
It is difficult to visualize a set of points that lie on the unit sphere. You can't see the curving surface, and you can see points that should not be visible, because they are on the other side of the sphere. By starting the display with a unit sphere, and then adding the 3D points you want to see, both of these problems are resolved. The addition of the sphere gives important visual cues as to how to "read" the data.
The file containing the point coordinates is in the XYZ format. The MATLAB command scatter3 is used to display the points. The sphere is generated by the sphere command and displayed with the surf command.
SPHERE_XYZ_DISPLAY is essentially a version of XYZ_DISPLAY with the addition of a displayed sphere. It seems like a small change, but for spherical point data, it makes a huge difference.
sphere_xyz_display ( 'filename.xyz' )where
The computer code and data files described and made available on this web page are distributed under the GNU LGPL license.
BALL_AND_STICK_DISPLAY, a MATLAB program which demonstrates the creation of a 3D "ball and stick" image;
MPAS_GRID_DISPLAY, a directory of MATLAB programs which can read an MPAS NETCDF grid file and display the primary polygonal mesh or the dual triangular mesh.
QUAD_SURFACE_DISPLAY a MATLAB program which reads files defining a 3D quadrilateral mesh surface and displays it within MATLAB.
SPHERE_CVT is a MATLAB library which creates a mesh of well-separated points on a unit sphere by applying the Centroidal Voronoi Tessellation (CVT) iteration.
SPHERE_DELAUNAY, a MATLAB program which computes the Delaunay triangulation of points on a sphere.
SPHERE_DESIGN_RULE is a FORTRAN90 library which returns point sets on the surface of the unit sphere, known as "designs", which can be useful for estimating integrals on the surface, among other uses.
SPHERE_GRID, a dataset directory which contains grids of points, lines, triangles or quadrilaterals on a sphere;
SPHERE_GRID, a MATLAB library which provides a number of ways of generating grids of points, or of points and lines, or of points and lines and faces, over the unit sphere.
SPHERE_LEBEDEV_RULE_DISPLAY, a MATLAB program which reads a file defining a Lebedev quadrature rule for the sphere and displays the point locations.
SPHERE_STEREOGRAPH is a MATLAB library which computes the stereographic mapping between points on the unit sphere and points on the plane Z = 1.
SPHERE_VORONOI, a MATLAB program which computes the Voronoi diagram of points on a sphere.
SPHERE_VORONOI_DISPLAY_OPENGL, a C++ program which displays a sphere and randomly selected generator points, and then gradually colors in points in the sphere that are closest to each generator.
SPHERE_XYZ_DISPLAY_OPENGL a C++ program which reads XYZ information defining points in 3D, and displays a unit sphere and the points, using OpenGL.
SPHERE_XYZF_DISPLAY is a MATLAB program which reads XYZF information defining points and faces, and displays a unit sphere, the points, and the faces, in the MATLAB graphics window. This can be used, for instance, to display Voronoi diagrams or Delaunay triangulations on the unit sphere.
TRI_SURFACE_DISPLAY is a MATLAB program which reads data defining a triangular mesh of a 3D surface and displays it.
XYZ_DISPLAY a MATLAB program which reads XYZ information defining points in 3D, and displays an image in the MATLAB graphics window.
XYZ_DISPLAY_OPENGL a C++ program which reads a set of 3D points from a file and plots them in an OpenGL graphics window.
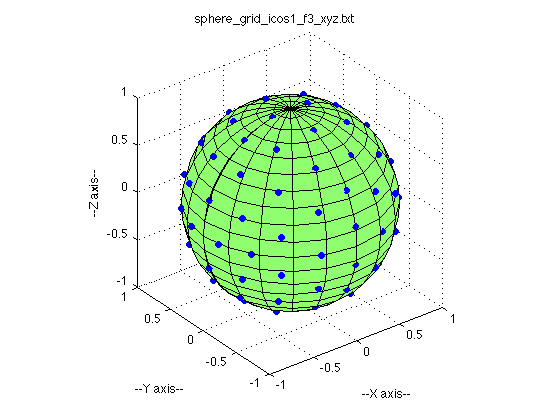
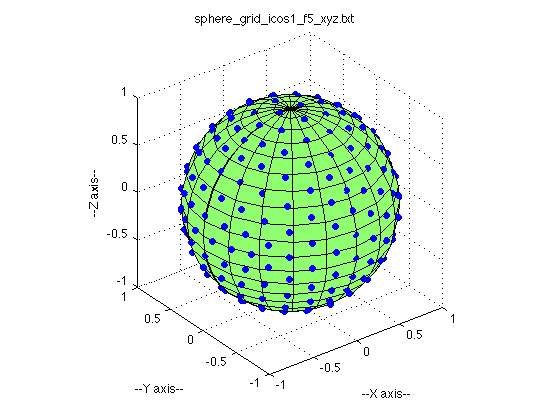
SPHERE_GRID_ICOS1_F*_XYZ is a family of files containing the XYZ coordinates of points on the unit sphere generated by subdividing the triangular faces of an icosahedron, and using a naive (secant-based) projection method. The value of F controls the fineness of the subdivision.
You can go up one level to the MATLAB source codes.