TCELL_FLOW_DISPLAY is a MATLAB program which can display a snapshot of the velocity field from a dataset of solutions of a time-dependent incompressible parameterized flow problem in a T-cell.
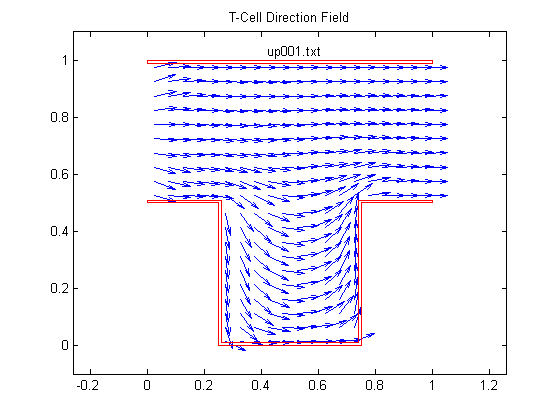
The "T-Cell" region is a T-shaped region contained in a subset of the unit square [01]x[01]. The top half of the region is a channel open to the left and right, with a rectangular recess in the bottom. The left channel opening extends from [0.0,0.5] to [0.0,1.0], and the right channel from [1.0,0.5] to [1.0,1.0]. The recess is a square, whose bottom extends from [0.25,0.0] to [0.75,0.0], and which extends upward to meet the channel.
             +--------------------+
             +--------------------+
            ->                      ->
      Inlet --->      Channel       --->  Outlet
            ->                      ->
             +-----+          +---+
             +----+|  Recess  |+--+
                  ||          ||
             Void ||          || Void
                  |+----------+|
                  +------------+
The grid can be thought of as being generated by a uniform 81 by 81
uniformly spaced grid of nodes, from which the nodes corresponding to
the two voids have been deleted. This leaves 4,961 nodes.
These nodes are organized into 2400 6-node triangular elements
which are quadratic in velocity and linear in pressure.
The computer code and data files described and made available on this web page are distributed under the GNU LGPL license.
CAVITY_FLOW_DISPLAY, a MATLAB program which can plot the data produced by the CAVITY fluid flow program.
HCELL_FLOW_DISPLAY, a MATLAB program which can plot the data produced by the HCELL fluid flow program.
INOUT_FLOW_DISPLAY, a MATLAB program which can plot the data produced by the INOUT fluid flow program.
TCELL_FLOW, a dataset directory which contains a sequence of flow solutions for the T-cell region.
VELOCITY_ARROWS_GRID, a MATLAB program which reads files of node and velocity data, and, using interpolation, creates a vector plot with arrows place on a uniform grid of the user's specification.
You can go up one level to the MATLAB source code directory.