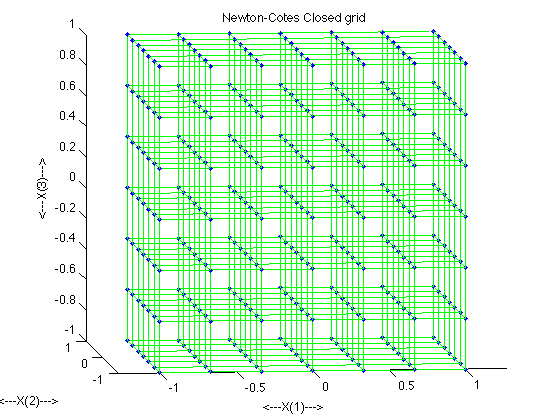
TENSOR_GRID_DISPLAY is a MATLAB program which can generate and display the points of a 1D/2D/3D tensor product grid formed by the same rule in each dimension, but allowing the order of points in each dimensio to vary.
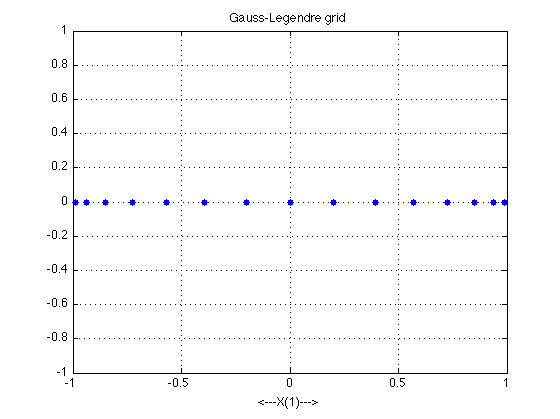
For instance, it is legal to request a 3D grid using the Gauss-Legendre rule in each dimension, but with 3 points in X, 9 points in Y, and 5 points in Z.
tensor_grid_display ( m, n_1d, rule )where
The codes for quadrature rules are:
The computer code and data files described and made available on this web page are distributed under the GNU LGPL license.
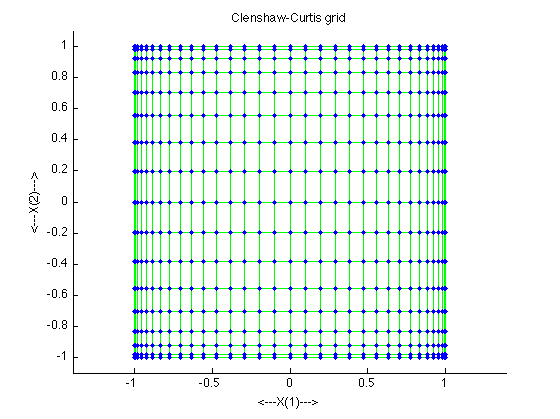
CC_DISPLAY, a MATLAB program which displays points on various grids derived from the Clenshaw Curtis rule.
GL_DISPLAY, a MATLAB program which displays points on various grids derived from the Gauss-Legendre rule.
GRID_DISPLAY, a MATLAB program which reads a file of points on a grid or sparse grid, displays the grid and saves the image in a PNG file;
GRIDS_DISPLAY, a MATLAB program which reads two files of grids or sparse grids, displays the first with hollow blue dots, the second with red dots.
NESTED_SEQUENCE_DISPLAY, a MATLAB program which displays a set of nested sequences.
QUADRULE, a MATLAB library which defines quadrature rules for 1D domains.
SEQUENCE_STREAK_DISPLAY, a MATLAB program which displays a "streak plot" of a numeric sequence;
XY_DISPLAY, a MATLAB program which can read a file of coordinates of points, and display an image of the points in a MATLAB graphics window.
XY_DISPLAY_OPENGL, a C++ program which can read a file containing 2D point coordinates, and display an image of those points using Open GL.
You can go up one level to the MATLAB source codes.