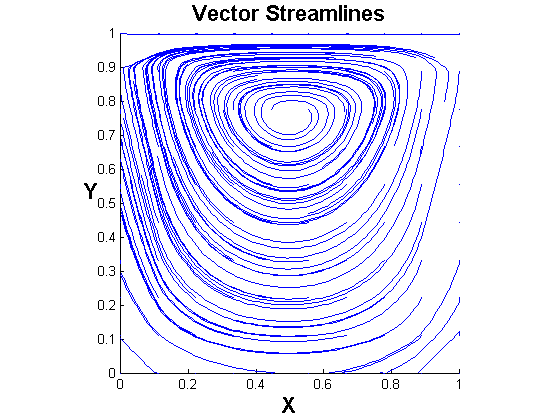
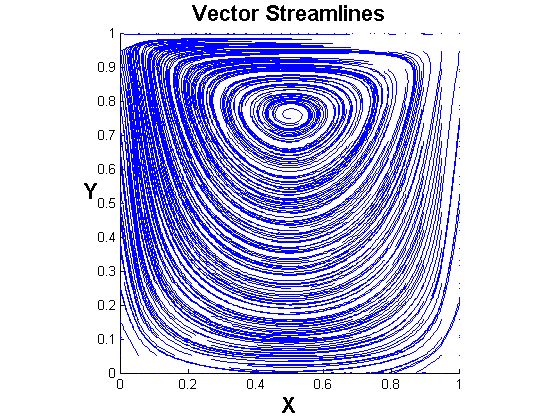
VECTOR_STREAM_GRID is a MATLAB program which reads vector data defined at possibly scattered points to produce a graph of the vector field's streamlines.
The program is mainly a preprocessor for MATLAB's streamline routine. It reads the (X,Y) coordinates of a set of points from a "node" file, and the corresponding vector values from a "vector" file. It uses MATLAB's griddata facility to create an interpolatory function to the given data. The interpolated function is then sampled on a regular grid, and the data is used to produce the plot plot.
Both the node and vector files are simple "table" files whose format is described online.
This program was written as a quick and convenient way to view finite element data. It can also be used for any situation in which a collection of points and vectors are available.
However, a small "sin" is committed when we use this program on finite element data, since we take only the node locations and vector values, but not the elements. We simply use MATLAB's grid data feature which constructs a cubic spline interpolant to scattered data. This is OK, and probably doesn't distort the data too much, but in fact, we are not actually viewing values of the finite element function, and there is no guarantee that this surrogate function will actually satisfy the boundary conditions or other characteristics of the finite element function.
VECTOR_STREAM_GRID is based in part on a plotting routine written by Professor Hyung-Chun Lee of Ajou University, Korea.
vector_stream_grid ( node_file, vector_file, grid_num, sample_num )where
The computer code and data files described and made available on this web page are distributed under the GNU LGPL license.
DIRECTION_ARROWS, a MATLAB program which plots the velocity direction field.
DIRECTION_ARROWS_SEQUENCE, a MATLAB program which plots the velocity direction fields of many data files with names that are numbered in sequence.
VECTOR_MAGNITUDE_GRID, a MATLAB program which reads node and velocity data from a file, and using an interpolating function, is able to display a contour plot of the vector magnitude field.
VECTOR_PLOT, a FORTRAN90 program which can read an XY file and a UV file and plot the velocity and velocity direction fields.
VELOCITY_ARROWS, a MATLAB program which plots a velocity vector field.
VELOCITY_ARROWS_GRID, a MATLAB program which reads node and velocity data from a file, and using interpolation is able to display a velocity vector field along any uniform grid of points specified by the user.
VELOCITY_ARROWS_SEQUENCE, a MATLAB program which can process a set of many data files with names that are numbered in sequence.
VELOCITY_ARROWS_SEQUENCE2, a MATLAB program which reads a single XYUV file of nodes and velocities, plots the data and writes it to a PNG file, and then repeats the process for the next file.
BIG_CAVITY is a fluid flow problem involving an irregular mesh of 8,185 nodes in a square region.
You can go up one level to the MATLAB source codes.