VELOCITY_ARROWS_GRID_SEQUENCE2 is a MATLAB program which reads a single XYUV file listing node coordinates and velocities, possibly at scattered points, or on a grid that is too dense or not dense enough; it interpolates a set of data that it samples on a uniform grid, and displays the data, and saves it to a PNG file. It then looks for the next sequentially named XYUV file, and if it exists, repeats the process.
The program is mainly a preprocessor for MATLAB's quiver routine. It reads the (X,Y) coordinates and (U,V) velocities for a set of points. It uses MATLAB's griddata facility to create an interpolatory function to the given data, which is then sampled on a regular grid and displayed.
The program is especially useful if simply displaying the original data is unsuitable, perhaps because there are too many points, or too few, or because the density of points varies greatly.
The node and velocity file is a simple "table" file whose format is described online.
The program assumes that the user actually has a sequence of XYUV datasets, with "consecutive" names, each of which is to be plotted. The program automatically reads each such dataset and creates the sequence of PNG files. It is easy to take such a sequence and make an animation.
This program was written as a quick and convenient way to view finite element data. It can also be used for any situation in which a collection of points and velocities are available.
However, a small "sin" is committed when we use this program on finite element data, since we take only the node locations and velocities, but not the elements. We simply use MATLAB's grid data feature which constructs a cubic spline interpolant to scattered data. This is OK, and probably doesn't distort the data too much, but in fact, we are not actually viewing values of the finite element function, and there is no guarantee that this surrogate function will actually satisfy the boundary conditions or other characteristics of the finite element function.
VELOCITY_ARROWS_GRID_SEQUENCE2 is based in part on a plotting routine written by Professor Hyung-Chun Lee of Ajou University, Korea.
The calling sequence is:
velocity_arrows_grid_sequence2 ( xyuv_file, scale, number )where
The computer code and data files described and made available on this web page are distributed under the GNU LGPL license.
DIRECTION_ARROWS, a MATLAB program which plots the velocity direction field.
DIRECTION_ARROWS_GRID, a MATLAB program which plots the velocity direction field on a uniform grid of density specified by the user.
VECTOR_MAGNITUDE_GRID, a MATLAB program which reads node and vector data from a file, computes an interpolatory function, evaluates on a uniform grid of points specified by the user, and displays a contour plot of the vector magnitude.
VECTOR_PLOT, a FORTRAN90 program which can read an XY file and a UV file and plot the velocity and velocity direction fields.
VECTOR_STREAM_GRID, a MATLAB program which reads node and vector data from a file, computes an interpolatory function, evaluates on a uniform grid of points specified by the user, and displays a streamline plot of the vector field.
VELOCITY_ARROWS, a MATLAB program which plots a velocity field from separate files of node and velocity information.
VELOCITY_ARROWS_GRID, a MATLAB program which reads separate files of node and velocity data, and using interpolation is able to display a velocity vector field along any uniform grid of points specified by the user.
VELOCITY_ARROWS_GRID2, a MATLAB program which reads a single file of XYUV node and velocity data, and using interpolation is able to display a velocity vector field along any uniform grid of points specified by the user.
VELOCITY_ARROWS_SEQUENCE, a MATLAB program which can process a set of many data files with names that are numbered in sequence.
VELOCITY_ARROWS2, a MATLAB program which plots a velocity field, and assumes that the node and velocity data are stored in a single table file.
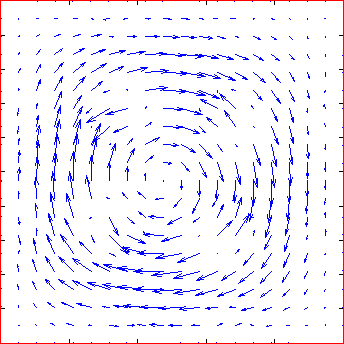
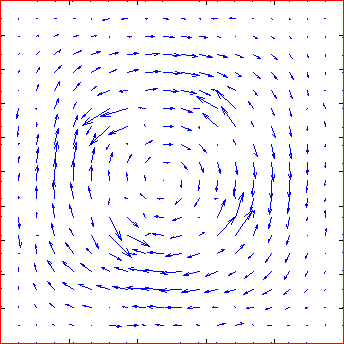
The VEL_FINAL dataset models flow in a 2D driven cavity. The following files are available:
The command
velocity_arrows_grid_sequence2 ( 'vel_final001.txt', 0, 20 )created the following files:
You can go up one level to the MATLAB source codes.