VORONOI_PLOT is a MATLAB program which plots the Voronoi neighborhoods of a set of center points.
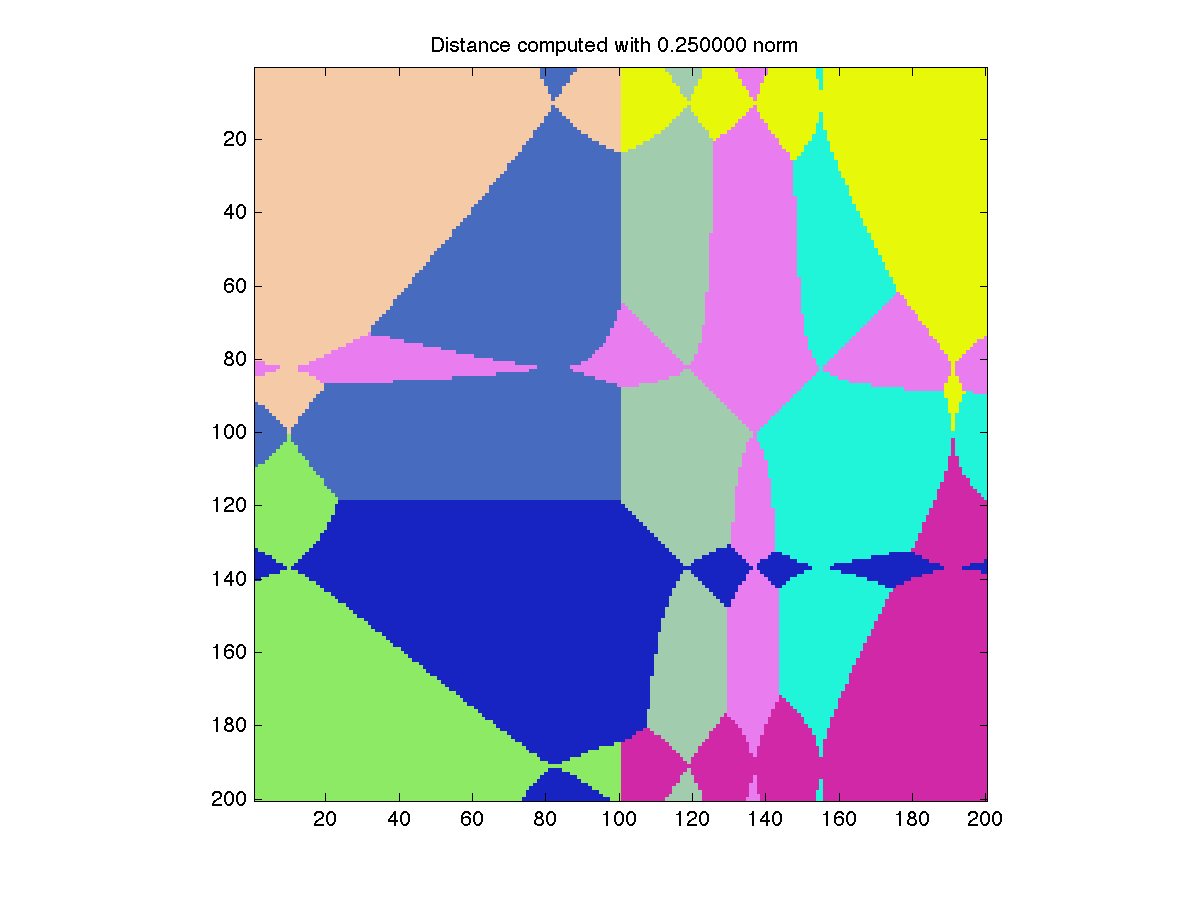
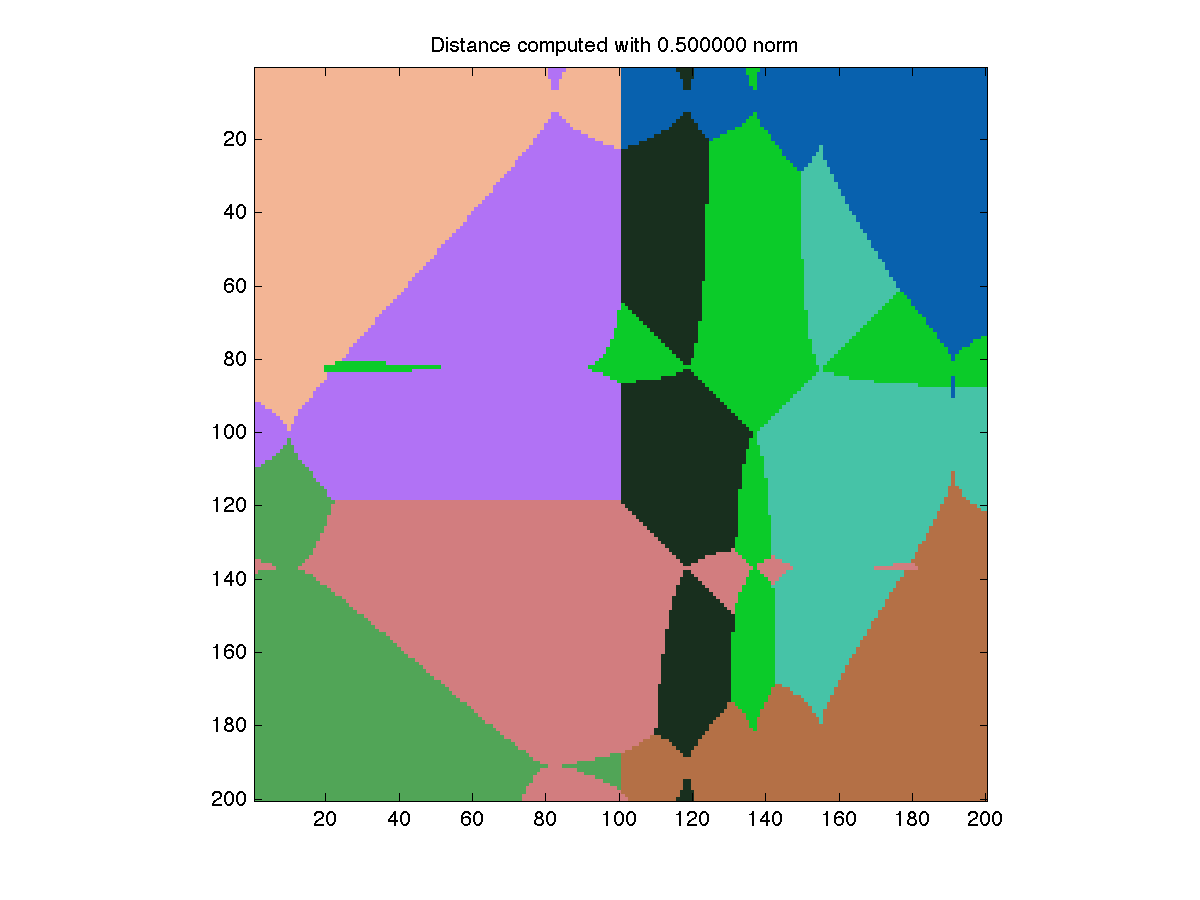
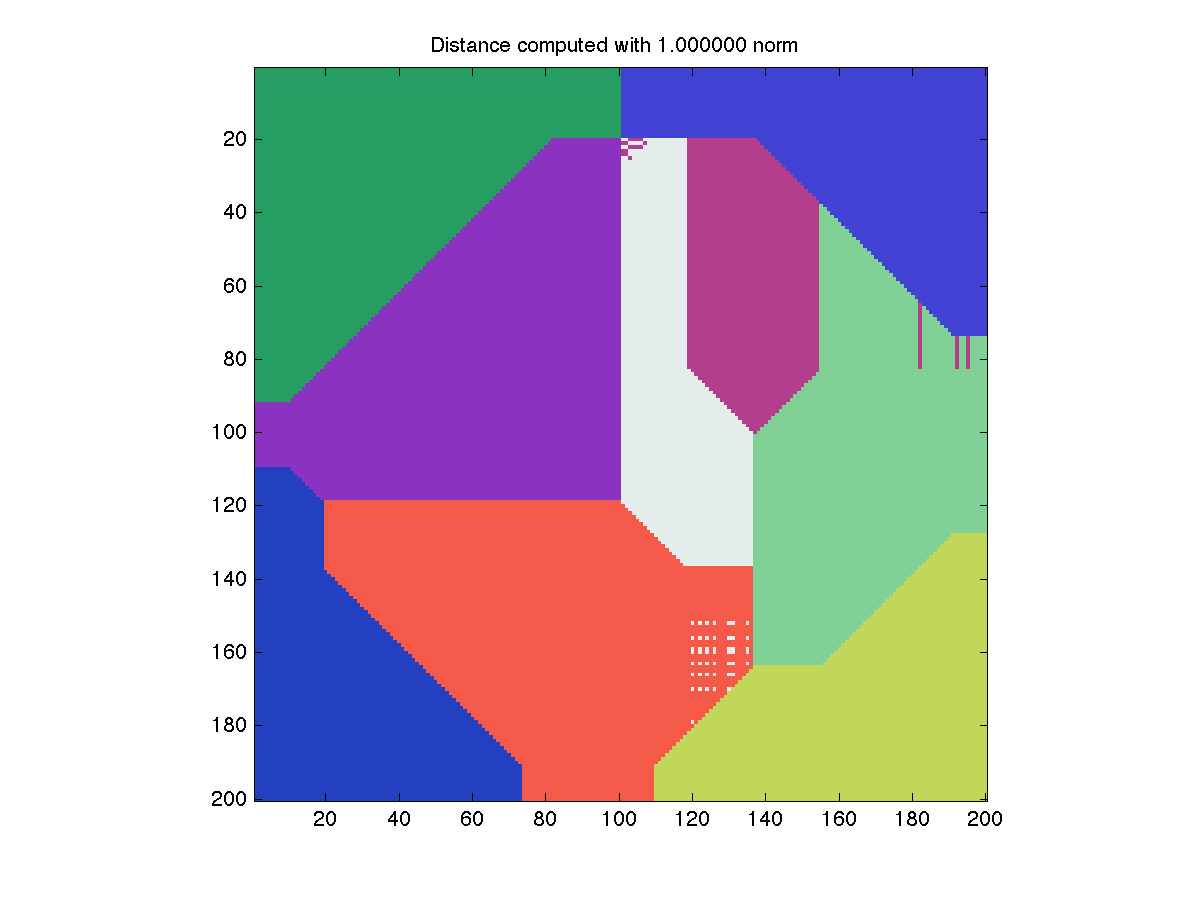
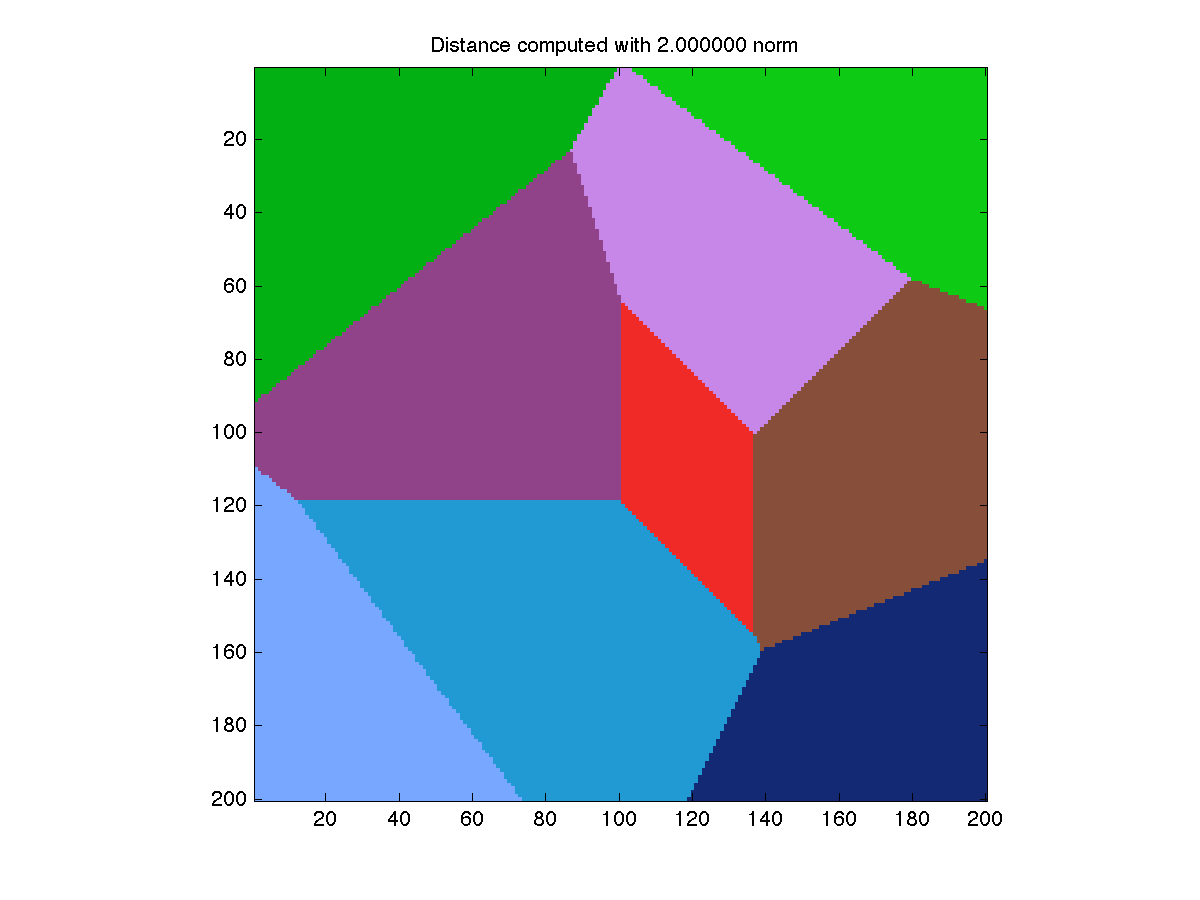
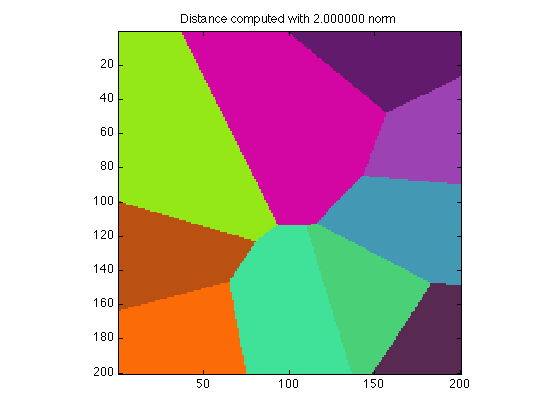
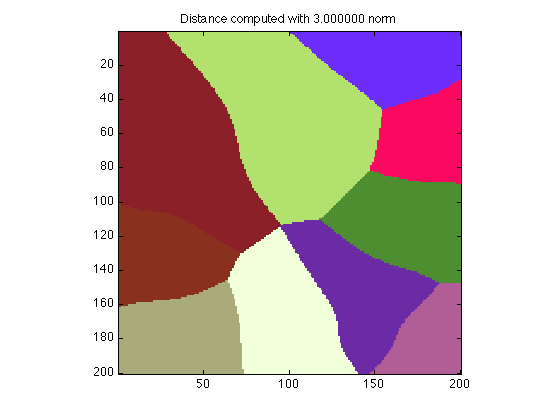
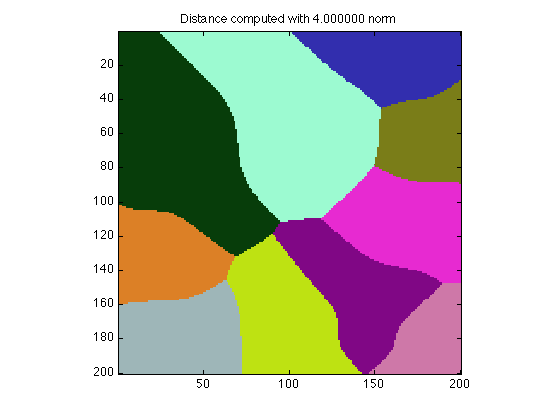
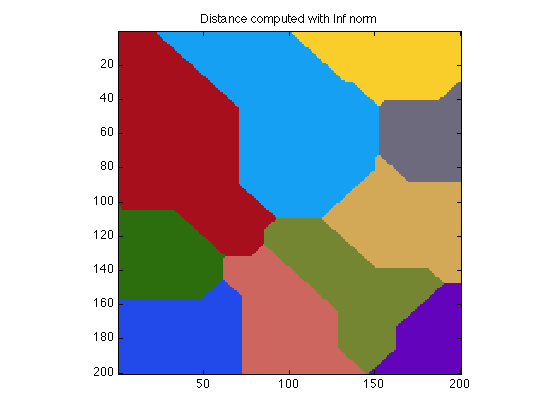
The picture is created using discrete pixel geometry, rather than sophisticated analysis. In other words, each center point is assigned a color at random. Then each pixel in the image is colored the same as the nearest center point.
The program allows the user to choose the values of M and N, the number of rows and columns used in the pixel array.
The program allows the user to choose the LP norm in which distances are calculated, with P any positive real value. In particular
voronoi_plot ( xy, m, n, p )where
The computer code and data files described and made available on this web page are distributed under the GNU LGPL license.
VORONOI_PLOT is available in a FORTRAN90 version and a MATLAB version.
SPHERE_DELAUNAY, a MATLAB program which computes the Delaunay triangulation of points on a sphere.
SPHERE_VORONOI, a MATLAB program which computes the Voronoi diagram of points on a sphere.
VORONOI_MOUNTAINS, a MATLAB program which makes a "mountain plot" of a Voronoi diagram, that is, a surface plot of the distance from each point to its nearest Voronoi generator.
DIAMOND_02_00009 is a set of 9 points whose Voronoi diagram includes a "diamond" shaped region.
UNIFORM_02_00010 is a set of 10 points chosen "randomly".
You can go up one level to the MATLAB source codes.