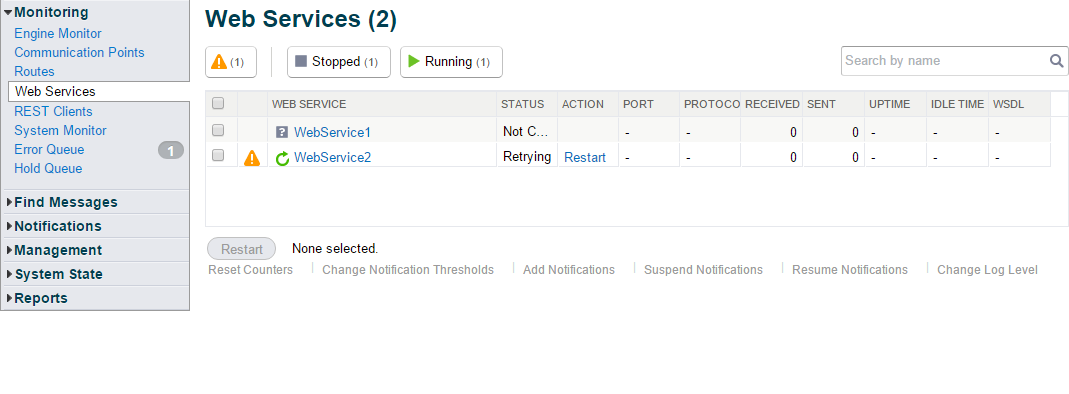
Menu Path : Monitoring>Web Services |
Required Access Rights:
|
Optional Access Group Rights:
|
The Web Services page displays a list of all the web services and their current status:
The following table describes the web services information displayed on this page:
Column |
Description |
|---|---|
Web Service |
The name of the web service. Click the web service name to display the web service details on the Web Service Details page. The icon indicates the status of the web service.
|
Action |
Click the Restart link to restart a web service. |
Port |
The local port for the HTTP(S) connector. |
Protocol |
The protocol in use - HTTP or HTTPS. |
Received |
The number of messages received. |
Sent |
The number of messages sent. |
Uptime |
The length of time the web service has been running. |
Idle Time |
The length of time the web service has been idle. |
WSDL |
Contains a link to the WSDL associated with the Web Service. You can either copy the link location, download from the link, or click the link to display the WSDL XML in a browser window. |
Filtering Components
You can use the following actions to filter the list of web services:
Action |
Description |
|---|---|
Filter buttons |
Enable you to filter the list based on component operational status or issue severity status. |
| Search field | Enables you to filter the list based on component name using a regular expression. The Management Console supports Java Regex. The following characters, which are allowed in component names, must be prepended with a backslash in order to be used as special characters in the regular expression: " |
Configuring Components
You can perform the following actions on the web services you have selected in the list:
Options |
Description |
|---|---|
Restart |
Click the Restart button to restart a Web service. |
Reset Counters |
Click the Reset Counters link to reset the message counts for the selected Web service. |
Change Notification Thresholds |
Click the Change Notification Thresholds link to set up thresholds for the selected Web service. |
Add Notifications |
Click the Add Notifications link to send text messages, pager messages, emails and SNMP with notifications of any Warnings, Alarms and Escalations that are raised. |
Suspend Notifications |
Click the Suspend Notifications link to stop sending text messages, pager messages, emails and SNMP with notifications of any Warnings, Alarms and Escalations that are raised. |
Resume Notifications |
Click the Resume Notifications link to resume sending text messages, pager messages, emails and SNMP with notifications of any Warnings, Alarms and Escalations that are raised. |
Change Log Level |
Click the Change Log Level link to display the Change Log Level dialog, where you can set the log level for the selected Web services from The log level you select on the Change Log Level dialog will be applied to all the selected Web services. |


