When troubleshooting an issue, implementing new functionality or auditing a configuration, you may be presented with an existing Rhapsody solution to review.
Review Existing Solution Documentation
Where solution documentation exists, it is generally the best place to start to understand a solution. The documentation should provide an overview of what the configuration is attempting to do, along with specific notes about the various parts of the configuration. Documentation of external systems, which the solution interfaces with, can sometimes be used to gain an understanding of what the solution system expects and what type of messages Rhapsody must process.
Where solution documentation does not exist, the auto-generated documentation from Rhapsody can sometimes be used in its place. This documentation can be generated by:
- Selecting a folder in the Workspace, or
- From the Rhapsody menu clicking Save Documentation....
The quality of the auto-generated documentation depends on the how well components in the configuration have been named, grouped and documented.
Use the Path View
The Path View feature of the Rhapsody IDE can be used to determine quickly how communications points and routes are connected together when direct connections between routes are used. To use Path View:
- From the View menu select Path View.
- Select the route or communications point required to be inspected from the workspace view.
Rhapsody generates a diagram illustrating how routes and other communications points are corrected to the currently selected item.
For configurations that contain many connections, the Path View schematic may become very elaborate. In these cases, it may be better to create a diagram representing the solution logic in an external tool.
Walk Configuration
Often, a full understanding of a solution can only be gained by directly inspecting the configuration using the Rhapsody IDE and tracking messages in the Management Console. To start an inspection of a solution, an input or output communication point that is a part of the solution should be identified. This can be using one or more of the following methods:
- Review of the solution documentation.
- Review of the Path View output.
- Inspection of the communication point and route views in the Management Console. With the solution running, check received and sent counts along with the idle time. This allows the active routes and communication points to be determined based on activity.
- Using the search functions in the Management Console to search for messages on one or more communication points (use the search options to filter the search as much as possible). The Message Contains field can be used to look for particular expressions in the messages. Note that a keyword search on a site that processes a large volume of messages will run very slowly. This allows actual messages to be inspected and the appropriate communications point identified.
- Reviewing the types and names of communications points in the configuration to make an educated guess as to the relevant communications point.
When a communication point has been identified, the Management Console can be used to identify the routes where the communication point is used by clicking on the Routes This Communication Point Is Used In link at the top of a communication point details page.
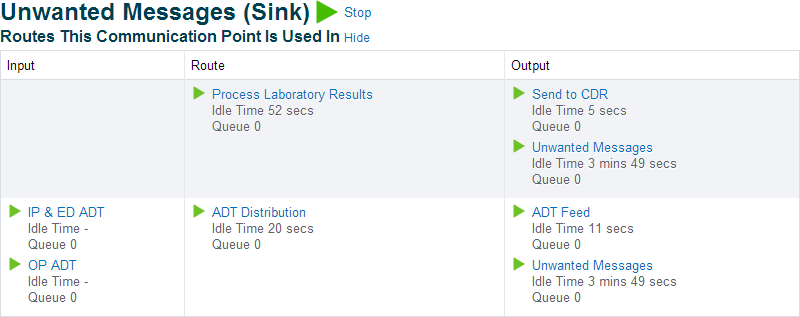
In the following example, a communication point called "Unwanted Messages" is being viewed in the Management Console. By clicking the Routes This Communication Point Is Used In link, you can see the communication point is used on two routes, "Process Laboratory Results" and "ADT Distribution":
Alternatively, in a solution where folders have been well used to group related configuration, the routes that use the communication point will be the same folder. However, if a communication point has been used on multiple routes, this approach might not reveal all uses.
Inspect via Rhapsody IDE
When the communication point has been identified, the Rhapsody IDE is used to inspect all filters and communication points linked to the identified communication point. You should check for message properties set via a message definition on the route and as an output of a mapper filter. Also note that various communication points and filters set properties on output, which might be used by other parts of the configuration in a solution. The FIFO settings on each route and any batching or de-batching filters may also alter the way that message process through any given route.
Inspect via Management Console
When inspecting a working solution, the Management Console can be used to track messages to determine how they were processed through the configuration. This technique can be invaluable when reviewing complex solutions or reviewing behavior around particular types of input. It is advisable to use a test system to feed selected test messages into the solution carefully. The set of test messages is usually selected through a configuration review using the Rhapsody IDE, or knowledge of the external systems and the likely problem message types.
Reports can be run from Management Console, for example a performance statistics report, that can indicate which route or filter is taking the longest time to process.
