A Rhapsody solution almost always interacts with one or more external systems. Being able to determine whether they are working correctly is an important troubleshooting approach. The following list is an example of third-party tools that can be used to diagnose certain types of issues:
SoapUI
SoapUI is a web service testing tool. I can be used for testing the web services set-up in Rhapsody. SoapUI can also be used to host a test web service or connect to a web service running on an external system to check that it is functioning correctly.
Filezilla or WinSCP
Filezilla and WinSCP are FTP/SFTP/FTPS client tools. When Rhapsody is having problems reading or writing files on an FTP server, these tools can be used to check the connection to the server from the Rhapsody machine and that file read and write operations are working correctly.
SQuirrel SQL Client
Squirrel SQL is a Java-based SQL database tool. It connects to a database using the same JDBC drivers as the Rhapsody engine. This allows a connection to be made to any database Rhapsody is able to connect to and returns SQL executed with results in the same way that Rhapsody would expect.
Fiddler
Fiddler is an HTTP logging proxy server which allows detailed analysis to be performed on traffic being sent to an HTTP server. It is normally used to inspect the HTTP traffic between a web browser and server.
However, it can also be used to inspect traffic between an external system and an HTTP Server or Web Services Hosting communication point in Rhapsody. A Fiddler proxy can be used when using the (S)FTP Client communication point and the HTTP proxy option to monitor connections to an external server from Rhapsody. Fiddler logs all requests and provides tools for analyzing request duration and content.
Wireshark
Wireshark is a network packet capture and analysis tool. It can either capture network traffic internally or take the output from tcpdump. Wireshark is able to see every network packet sent over a particular interface. This makes the tool ideal for analyzing low-level network or firewall problems for those who have a good understanding of the TCP protocol and the various connection states. When analyzing complex network problems, traffic may need to be captured at various points in the network (in the very least, at the Rhapsody server and the third-party system being connected to). Although Wireshark is also able to perform analysis on higher-level protocols, such as HTTP, dedicated analysis tools for these protocols (such as Fiddler) are generally easier to use.
Traceroute
Traceroute is a utility built into most operating systems ("tracert.exe" on Windows and "traceroute" on Unix systems). The utility reports the number and nature of network machines that sit between the source and destination computers, allowing one to quickly identify what network equipment is sitting between the Rhapsody machine the external system and whether the equipment might be blocking some requests. On some networks, intermediate machines can block the network packets this utility needs to operate. In these cases, the TCP traceroute (http://linux.die.net/man/1/tcptraceroute) program can be used.
Performance Monitoring
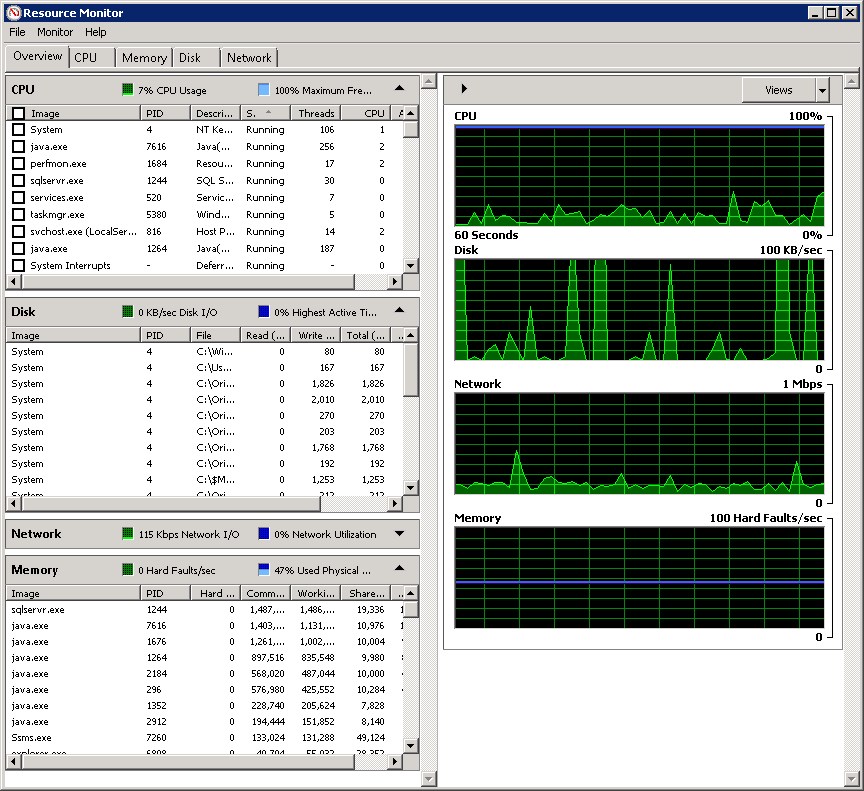
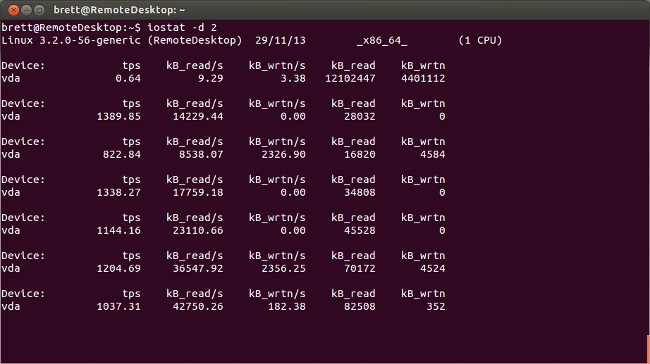
All operating systems come with performance monitoring tools. On Windows, the tools are Resource Monitor and Performance Monitor. On Linux systems, the Sysstat tools can be used to provide this information. These provide that ability to inspect CPU, disk and memory performance. Where the issue involves a performance problem and there is a suspicion that the system Rhapsody is running on could be resource constrained, performance monitoring tools should be checked.
Windows® - Resource Monitor
In the following screenshot, the Overview screen of the Resource Monitor application is displaying a summary of resource usage on the server along with details on the process responsible for the usage:
Linux - iostat
In the following screenshot, the iostat command (one of the commands in the Sysstat package) is displaying disk I/O statistics with a two-second refresh interval:
System Logs
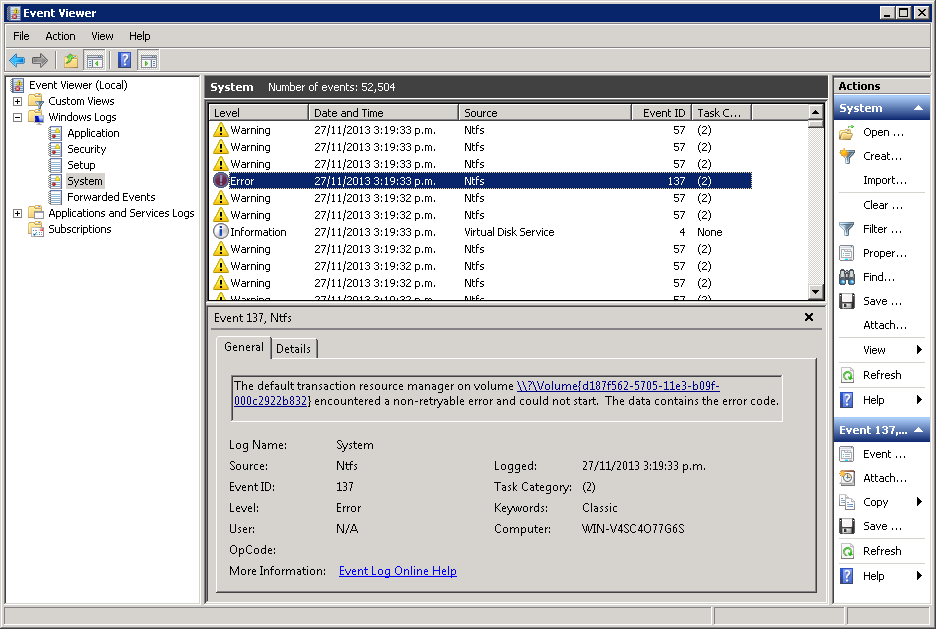
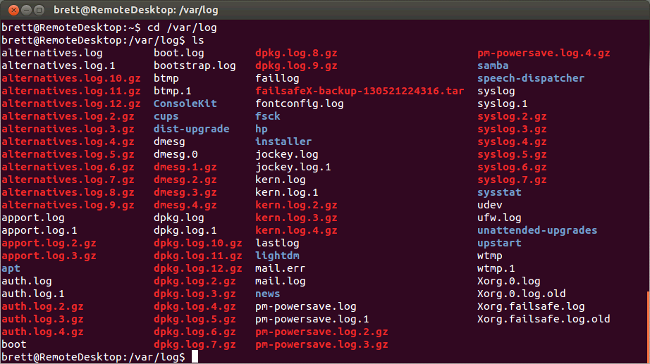
On a Windows® machine, the Event Viewer records and reports all system and many application events. On a Unix machine, all system events and many application events are logged in the /var/log directory. On a machine where the operating system or another application might be implicated in the issue, the system logs should be checked for possibly related log entries.
Windows® - Event Viewer
To view Rhapsody-related events in the Windows® Event Viewer:
- Navigate to Start>Control Panel>System and Security>Administrative Tools.
- Open the Event Viewer.
- In the left pane, navigate to Windows Logs>Application.
- In the Application pane, double-click a Rhapsody event to display its Event Properties dialog.
These instructions may differ slightly depending on the version of Windows® you are using.
Field |
Description |
|---|---|
Event Identifier |
The type of event triggered. Refer to Notifications Reference for details. |
Localhost |
The name and IP address of the machine that triggered the event. |
Timestamp |
The date and time the event was triggered. |
Parameters |
These vary depending on the type of event triggered. |
Level |
Severity of the event: |
Source |
The Rhapsody service that produced the error. |
Task Category |
Whether the event is triggered by a route, communication point or user. |
User |
This field is not in use. |
An XML representation of the event is available programmatically.
Linux - /var/log directory


