{
"cells": [
{
"cell_type": "markdown",
"metadata": {
"collapsed": true
},
"source": [
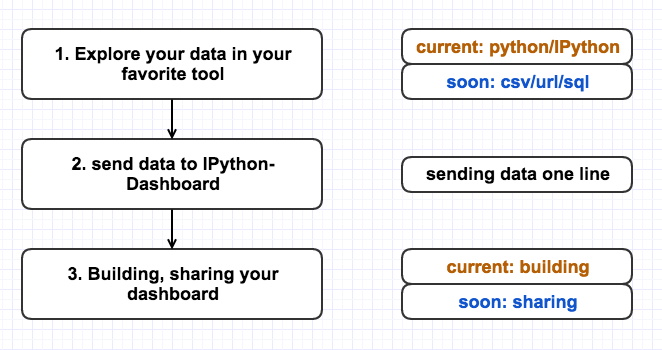
"## Hello, I'm ***IPython-Dashboar***, which is inspired by one of the greatest packages, ***IPython***.\n",
"\n",
"I'm a stand alone, light-weight web server for building, sharing graphs created in ipython. Aiming at building for data science, data analysis guys. Building an interactive visualization, collaborated dashboard, and real-time streaming graph.\n",
"\n",
"If you are doing data exploring in IPython notebook, and draw some graph or select some metrics from database, which will be used to present to others, but you don't like to share the code or the complicated logic [ for private or page cleaning ], I think I can help you to do the present part job.\n",
"\n",
"In this tutorial, I'll show you how to do data exploring in ipython notebook and how to share it to others without ipython.\n",
"\n",
""
]
},
{
"cell_type": "markdown",
"metadata": {},
"source": [
"## 1. Load packages [ One can't make bricks without straw ]\n",
"\n",
"\n",
"- I recommend import package in a readable and reasonable order, which will be useful as the project gets larger.\n"
]
},
{
"cell_type": "code",
"execution_count": 1,
"metadata": {
"collapsed": false
},
"outputs": [],
"source": [
"# built-in package\n",
"import os\n",
"import sys\n",
"import json\n",
"import time\n",
"import datetime as dt\n",
"\n",
"# third-parth package\n",
"import dashboard as dash\n",
"import pandas as pd\n",
"import matplotlib as plt\n",
"import seaborn\n",
"import mpld3\n",
"\n",
"# package configre\n",
"pd.options.display.max_columns = 100\n",
"pd.options.display.max_rows = 500"
]
},
{
"cell_type": "markdown",
"metadata": {},
"source": [
"## 2. Load data \n",
"\n",
"- I've prepared a test data on this repo.\n",
"- Don't forget to take a look at the data before exploring it, that's a good habit."
]
},
{
"cell_type": "code",
"execution_count": 2,
"metadata": {
"collapsed": false
},
"outputs": [],
"source": [
"url = \"\"\"https://github.com/litaotao/IPython-Dashboard/raw/v-0.1.2-visualiza-table/docs/people_number_by_province_lateset_10_years.csv\"\"\"\n",
"data = pd.read_csv(url)"
]
},
{
"cell_type": "code",
"execution_count": 3,
"metadata": {
"collapsed": false
},
"outputs": [
{
"data": {
"text/html": [
"\n",
"
\n",
" \n",
" \n",
" | \n",
" 地区 | \n",
" 2014年 | \n",
" 2013年 | \n",
" 2012年 | \n",
" 2011年 | \n",
" 2010年 | \n",
" 2009年 | \n",
" 2008年 | \n",
" 2007年 | \n",
" 2006年 | \n",
" 2005年 | \n",
"
\n",
" \n",
" \n",
" \n",
" | 0 | \n",
" 北京市 | \n",
" 2152 | \n",
" 2115 | \n",
" 2069 | \n",
" 2019 | \n",
" 1962 | \n",
" 1860 | \n",
" 1771 | \n",
" 1676 | \n",
" 1601 | \n",
" 1538 | \n",
"
\n",
" \n",
" | 1 | \n",
" 天津市 | \n",
" 1517 | \n",
" 1472 | \n",
" 1413 | \n",
" 1355 | \n",
" 1299 | \n",
" 1228 | \n",
" 1176 | \n",
" 1115 | \n",
" 1075 | \n",
" 1043 | \n",
"
\n",
" \n",
" | 2 | \n",
" 河北省 | \n",
" 7384 | \n",
" 7333 | \n",
" 7288 | \n",
" 7241 | \n",
" 7194 | \n",
" 7034 | \n",
" 6989 | \n",
" 6943 | \n",
" 6898 | \n",
" 6851 | \n",
"
\n",
" \n",
"
\n",
"