{
"cells": [
{
"cell_type": "markdown",
"metadata": {},
"source": [
"# Tracing the Python GIL\n",
"> Tracing and visualizing the Python GIL with perf and VizTracer\n",
"\n",
"- toc: true\n",
"- badges: true\n",
"- comments: true\n",
"- sticky_rank: 1\n",
"- author: Maarten Breddels\n",
"- image: images/example1-uprobes.png\n",
"- categories: [perf, jupyter, python, tracing, GIL]"
]
},
{
"cell_type": "markdown",
"metadata": {},
"source": [
"# Why the GIL matters\n",
"There are plenty of articles explaining why the Python GIL (The Global Interpreter Lock) exists[^1], and why it is there. The TLDR version is: the GIL prevents multithreaded pure Python code from using multiple CPU cores.\n",
"\n",
"However, in [Vaex](https://vaex.io) we execute most of the CPU intensive parts in C (C++) code, where we release the GIL. This is a common practice in high-performance Python libraries, where Python acts merely as a high-level glue.\n",
"\n",
"However, the GIL needs to be released explicitly, and this is the responsibility of the programmer and might be forgotten, leading to suboptimal use of your machine.\n",
"\n",
"I recently had this issue in [Vaex](https://github.com/vaexio/vaex/pull/1114) where I simply forgot to release the GIL and found a similar issue in [Apache Arrow](https://github.com/apache/arrow/pull/7756)[^2].\n",
"\n",
"Also, when running on 64 cores, I sometimes see a performance in Vaex that I am not happy with. It might be using 4000% CPU, instead of 6400% CPU, which is something I am not happy with. Instead of blindly pulling some levers to inspect the effect, I want to understand what is happening, and if the GIL is the problem, why, and where is it holding Vaex down. \n",
"\n",
"\n",
"\n",
"[^1]: I am assuming CPython.\n",
"\n",
"[^2]: Apache Arrow is a dependency of Vaex, so anytime the GIL is not released in Arrow, we (and others) suffer a performance hit."
]
},
{
"cell_type": "markdown",
"metadata": {},
"source": [
"# Why I write this\n",
"I'm planning to write a series of articles explaining some tools and techniques available for profiling/tracing Python together with native extensions, and how these tools can be glued together, to analyze and visualize what Python is doing, and when the GIL it taken or dropped.\n",
"\n",
"I hope this leads to improvement of tracing, profiling, and other performance tooling in the Python ecosystem, and the performance of the whole Python ecosystem.\n",
"\n",
"\n",
"# Prerequisites\n",
"\n",
"## Linux\n",
"Get access to a Linux machine, and make sure you have root privileges (sudo is fine), or ask your sysadmin to execute some of these commands for you. For the rest of the document, we only run as user.\n",
"\n",
"## Perf\n",
"\n",
"Make sure you have perf installed, e.g. on Ubuntu:\n",
"\n",
"```\n",
"$ sudo yum install perf\n",
"```\n",
"\n",
"## Kernel configuration\n",
"\n",
"To enable running it as a user:\n",
"\n",
"```\n",
"# Enable users to run perf (use at own risk)\n",
"$ sudo sysctl kernel.perf_event_paranoid=-1\n",
"\n",
"# Enable users to see schedule trace events:\n",
"$ sudo mount -o remount,mode=755 /sys/kernel/debug\n",
"$ sudo mount -o remount,mode=755 /sys/kernel/debug/tracing\n",
"```\n",
"\n",
"## Python packages\n",
"\n",
"We will make use of [VizTracer](https://github.com/gaogaotiantian/viztracer/) and [per4m](https://github.com/maartenbreddels/per4m)\n",
"```\n",
"$ pip install \"viztracer>=0.11.2\" \"per4m>=0.1,<0.2\"\n",
"```\n",
"\n"
]
},
{
"cell_type": "markdown",
"metadata": {},
"source": [
"# Track thread or process states via perf\n",
"\n",
"There is no way to get the GIL state in Python [^3] since there is no API for this. We can track it from the kernel, and the right tool for this under Linux is **perf**.\n",
"\n",
"Using the linux perf tool (aka perf_events), we can listen to the state changes for processes/threads (we only care about sleeping and running), and log them. Although perf may look scary, it is a powerful tool. If you want to know a bit more about perf, I recommend reading [Julia Evans' zine on perf](https://jvns.ca/blog/2018/04/16/new-perf-zine/) or [go through Brendan Gregg's website](http://www.brendangregg.com/perf.html).\n",
"\n",
"\n",
"To build our intuition, we will first run perf on a [very trivial program](https://github.com/maartenbreddels/per4m/blob/master/per4m/example0.py):\n",
"\n",
"[^3]: Except using polling https://github.com/chrisjbillington/gil_load/"
]
},
{
"cell_type": "code",
"execution_count": null,
"metadata": {},
"outputs": [],
"source": [
"# file per4m/example0.py\n",
"import time\n",
"from threading import Thread\n",
"\n",
"\n",
"def sleep_a_bit():\n",
" time.sleep(1)\n",
"\n",
"\n",
"def main():\n",
" t = Thread(target=sleep_a_bit)\n",
" t.start()\n",
" t.join()\n",
"\n",
"\n",
"main()"
]
},
{
"cell_type": "markdown",
"metadata": {},
"source": [
"We listen to just a few events to keep the noise down (note the use of wildcards):\n",
"```\n",
"$ perf record -e sched:sched_switch -e sched:sched_process_fork \\\n",
" -e 'sched:sched_wak*' -- python -m per4m.example0\n",
"[ perf record: Woken up 2 times to write data ]\n",
"[ perf record: Captured and wrote 0,032 MB perf.data (33 samples) ]\n",
"```\n",
"\n",
"And use the `perf script` command to write human/parsable output.\n",
"\n",
"```\n",
"$ perf script\n",
" :3040108 3040108 [032] 5563910.979408: sched:sched_waking: comm=perf pid=3040114 prio=120 target_cpu=031\n",
" :3040108 3040108 [032] 5563910.979431: sched:sched_wakeup: comm=perf pid=3040114 prio=120 target_cpu=031\n",
" python 3040114 [031] 5563910.995616: sched:sched_waking: comm=kworker/31:1 pid=2502104 prio=120 target_cpu=031\n",
" python 3040114 [031] 5563910.995618: sched:sched_wakeup: comm=kworker/31:1 pid=2502104 prio=120 target_cpu=031\n",
" python 3040114 [031] 5563910.995621: sched:sched_waking: comm=ksoftirqd/31 pid=198 prio=120 target_cpu=031\n",
" python 3040114 [031] 5563910.995622: sched:sched_wakeup: comm=ksoftirqd/31 pid=198 prio=120 target_cpu=031\n",
" python 3040114 [031] 5563910.995624: sched:sched_switch: prev_comm=python prev_pid=3040114 prev_prio=120 prev_state=R+ ==> next_comm=kworker/31:1 next_pid=2502104 next_prio=120\n",
" python 3040114 [031] 5563911.003612: sched:sched_waking: comm=kworker/32:1 pid=2467833 prio=120 target_cpu=032\n",
" python 3040114 [031] 5563911.003614: sched:sched_wakeup: comm=kworker/32:1 pid=2467833 prio=120 target_cpu=032\n",
" python 3040114 [031] 5563911.083609: sched:sched_waking: comm=ksoftirqd/31 pid=198 prio=120 target_cpu=031\n",
" python 3040114 [031] 5563911.083612: sched:sched_wakeup: comm=ksoftirqd/31 pid=198 prio=120 target_cpu=031\n",
" python 3040114 [031] 5563911.083613: sched:sched_switch: prev_comm=python prev_pid=3040114 prev_prio=120 prev_state=R ==> next_comm=ksoftirqd/31 next_pid=198 next_prio=120\n",
" python 3040114 [031] 5563911.108984: sched:sched_waking: comm=node pid=2446812 prio=120 target_cpu=045\n",
" python 3040114 [031] 5563911.109059: sched:sched_waking: comm=node pid=2446812 prio=120 target_cpu=045\n",
" python 3040114 [031] 5563911.112250: sched:sched_process_fork: comm=python pid=3040114 child_comm=python child_pid=3040116\n",
" python 3040114 [031] 5563911.112260: sched:sched_wakeup_new: comm=python pid=3040116 prio=120 target_cpu=037\n",
" python 3040114 [031] 5563911.112262: sched:sched_wakeup_new: comm=python pid=3040116 prio=120 target_cpu=037\n",
" python 3040114 [031] 5563911.112273: sched:sched_switch: prev_comm=python prev_pid=3040114 prev_prio=120 prev_state=S ==> next_comm=swapper/31 next_pid=0 next_prio=120\n",
" python 3040116 [037] 5563911.112418: sched:sched_waking: comm=python pid=3040114 prio=120 target_cpu=031\n",
" python 3040116 [037] 5563911.112450: sched:sched_waking: comm=python pid=3040114 prio=120 target_cpu=031\n",
" python 3040116 [037] 5563911.112473: sched:sched_wake_idle_without_ipi: cpu=31\n",
" swapper 0 [031] 5563911.112476: sched:sched_wakeup: comm=python pid=3040114 prio=120 target_cpu=031\n",
" python 3040114 [031] 5563911.112485: sched:sched_switch: prev_comm=python prev_pid=3040114 prev_prio=120 prev_state=S ==> next_comm=swapper/31 next_pid=0 next_prio=120\n",
" python 3040116 [037] 5563911.112485: sched:sched_waking: comm=python pid=3040114 prio=120 target_cpu=031\n",
" python 3040116 [037] 5563911.112489: sched:sched_waking: comm=python pid=3040114 prio=120 target_cpu=031\n",
" python 3040116 [037] 5563911.112496: sched:sched_switch: prev_comm=python prev_pid=3040116 prev_prio=120 prev_state=S ==> next_comm=swapper/37 next_pid=0 next_prio=120\n",
" swapper 0 [031] 5563911.112497: sched:sched_wakeup: comm=python pid=3040114 prio=120 target_cpu=031\n",
" python 3040114 [031] 5563911.112513: sched:sched_switch: prev_comm=python prev_pid=3040114 prev_prio=120 prev_state=S ==> next_comm=swapper/31 next_pid=0 next_prio=120\n",
" swapper 0 [037] 5563912.113490: sched:sched_waking: comm=python pid=3040116 prio=120 target_cpu=037\n",
" swapper 0 [037] 5563912.113529: sched:sched_wakeup: comm=python pid=3040116 prio=120 target_cpu=037\n",
" python 3040116 [037] 5563912.113595: sched:sched_waking: comm=python pid=3040114 prio=120 target_cpu=031\n",
" python 3040116 [037] 5563912.113620: sched:sched_waking: comm=python pid=3040114 prio=120 target_cpu=031\n",
" swapper 0 [031] 5563912.113697: sched:sched_wakeup: comm=python pid=3040114 prio=120 target_cpu=031\n",
"```\n"
]
},
{
"cell_type": "markdown",
"metadata": {},
"source": [
"Take a moment to digest the output. I can see a few things. Looking at the 4th column (time in seconds), we can see where the program slept (it skips 1 second). Here we see that we enter the sleeping state with a line like:\n",
"\n",
"`python 3040114 [031] 5563911.112513: sched:sched_switch: prev_comm=python prev_pid=3040114 prev_prio=120 prev_state=S ==> next_comm=swapper/31 next_pid=0 next_prio=120`\n",
"\n",
"\n",
"This means the kernel changed the state of the Python thread to `S` (=sleeping) state.\n",
"\n",
"A full second later, we see it being woken up:\n",
"\n",
"`swapper 0 [031] 5563912.113697: sched:sched_wakeup: comm=python pid=3040114 prio=120 target_cpu=031`\n",
"\n",
"Of course, you need to build some tooling around this, to really see what is happening. But one can imagine this output can be easily parsed and this is what [per4m](https://github.com/maartenbreddels/per4m/) does. However, before we go there, I'd first like to visualize the flow of a slightly more advanced program using [VizTracer](https://github.com/gaogaotiantian/viztracer/)."
]
},
{
"cell_type": "markdown",
"metadata": {},
"source": [
"# VizTracer\n",
"[VizTracer](https://github.com/gaogaotiantian/viztracer/) is a Python tracer that can visualize what your program does in the browser. Let us run it on a slightly [more advanced example](https://github.com/maartenbreddels/per4m/blob/master/per4m/example1.py) to see what it looks like."
]
},
{
"cell_type": "code",
"execution_count": null,
"metadata": {},
"outputs": [],
"source": [
"# file per4m/example1.py\n",
"import threading\n",
"import time\n",
"\n",
"\n",
"def some_computation():\n",
" total = 0 \n",
" for i in range(1_000_000):\n",
" total += i\n",
" return total\n",
"\n",
"\n",
"def main():\n",
" thread1 = threading.Thread(target=some_computation)\n",
" thread2 = threading.Thread(target=some_computation)\n",
" thread1.start()\n",
" thread2.start()\n",
" time.sleep(0.2)\n",
" for thread in [thread1, thread2]:\n",
" thread.join()\n",
"\n",
"\n",
"main()"
]
},
{
"cell_type": "markdown",
"metadata": {},
"source": [
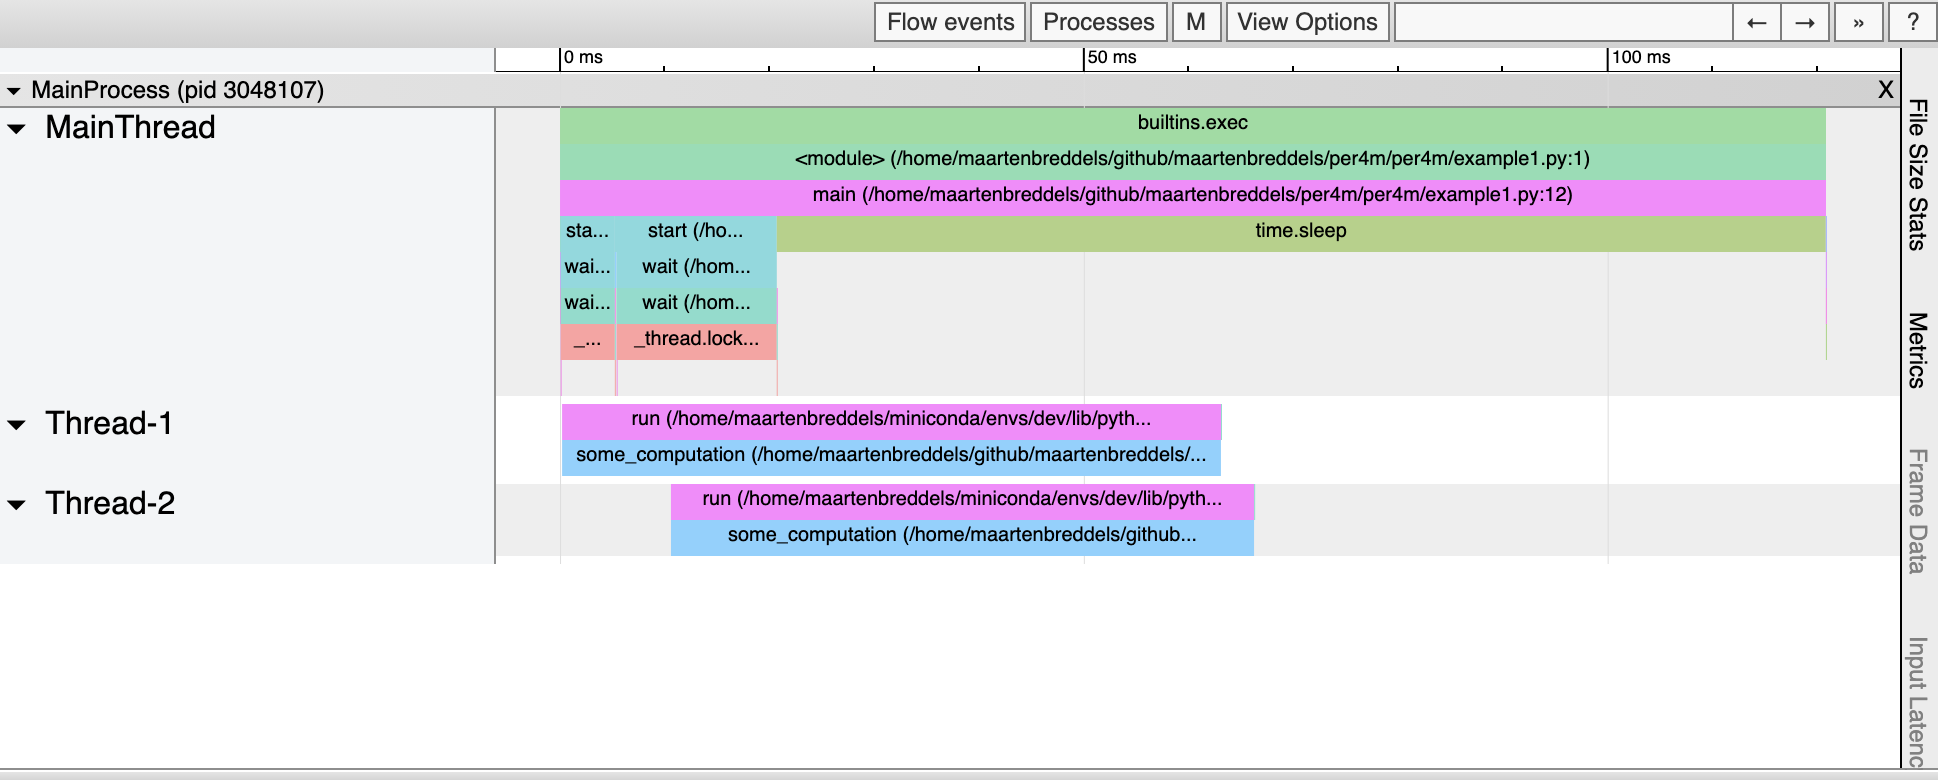
"Running viztracer gives output like:\n",
"```\n",
"$ viztracer -o example1.html --ignore_frozen -m per4m.example1\n",
"Loading finish \n",
"Saving report to /home/maartenbreddels/github/maartenbreddels/per4m/example1.html ...\n",
"Dumping trace data to json, total entries: 94, estimated json file size: 11.0KiB\n",
"Generating HTML report\n",
"Report saved.\n",
"```\n",
"\n",
"And the HTML should render as:\n",
"\n",
"\n",
"From this, it seems that `some_computation` seem to be executed in parallel (twice), while in fact, we know the GIL is preventing that. So what is really going on?"
]
},
{
"cell_type": "markdown",
"metadata": {},
"source": [
"\n",
"\n",
"# Mixing VizTracer and perf output\n",
"\n",
"Let us run `perf` on this, similarly to what we did to example0.py. However, we add the argument `-k CLOCK_MONOTONIC` so that we use [the same clock as VizTracer](https://github.com/gaogaotiantian/viztracer/blob/3321ba4024afe5623f938a601d7f7db3b08f534d/src/viztracer/modules/snaptrace.c#L91) and ask VizTracer to generate a JSON, instead of an HTML file:\n",
"\n",
"```\n",
"$ perf record -e sched:sched_switch -e sched:sched_process_fork -e 'sched:sched_wak*' \\\n",
" -k CLOCK_MONOTONIC -- viztracer -o viztracer1.json --ignore_frozen -m per4m.example1\n",
"```\n",
"\n",
"Then we use `per4m` to translate the perf script results into a JSON that VizTracer can read\n",
"\n",
"```\n",
"$ perf script | per4m perf2trace sched -o perf1.json\n",
"Wrote to perf1.json\n",
"```\n",
"\n",
"Next, use VizTracer to combine the two JSON files.\n",
"\n",
"```\n",
"$ viztracer --combine perf1.json viztracer1.json -o example1_state.html\n",
"Saving report to /home/maartenbreddels/github/maartenbreddels/per4m/example1.html ...\n",
"Dumping trace data to json, total entries: 131, estimated json file size: 15.4KiB\n",
"Generating HTML report\n",
"Report saved.\n",
"```\n",
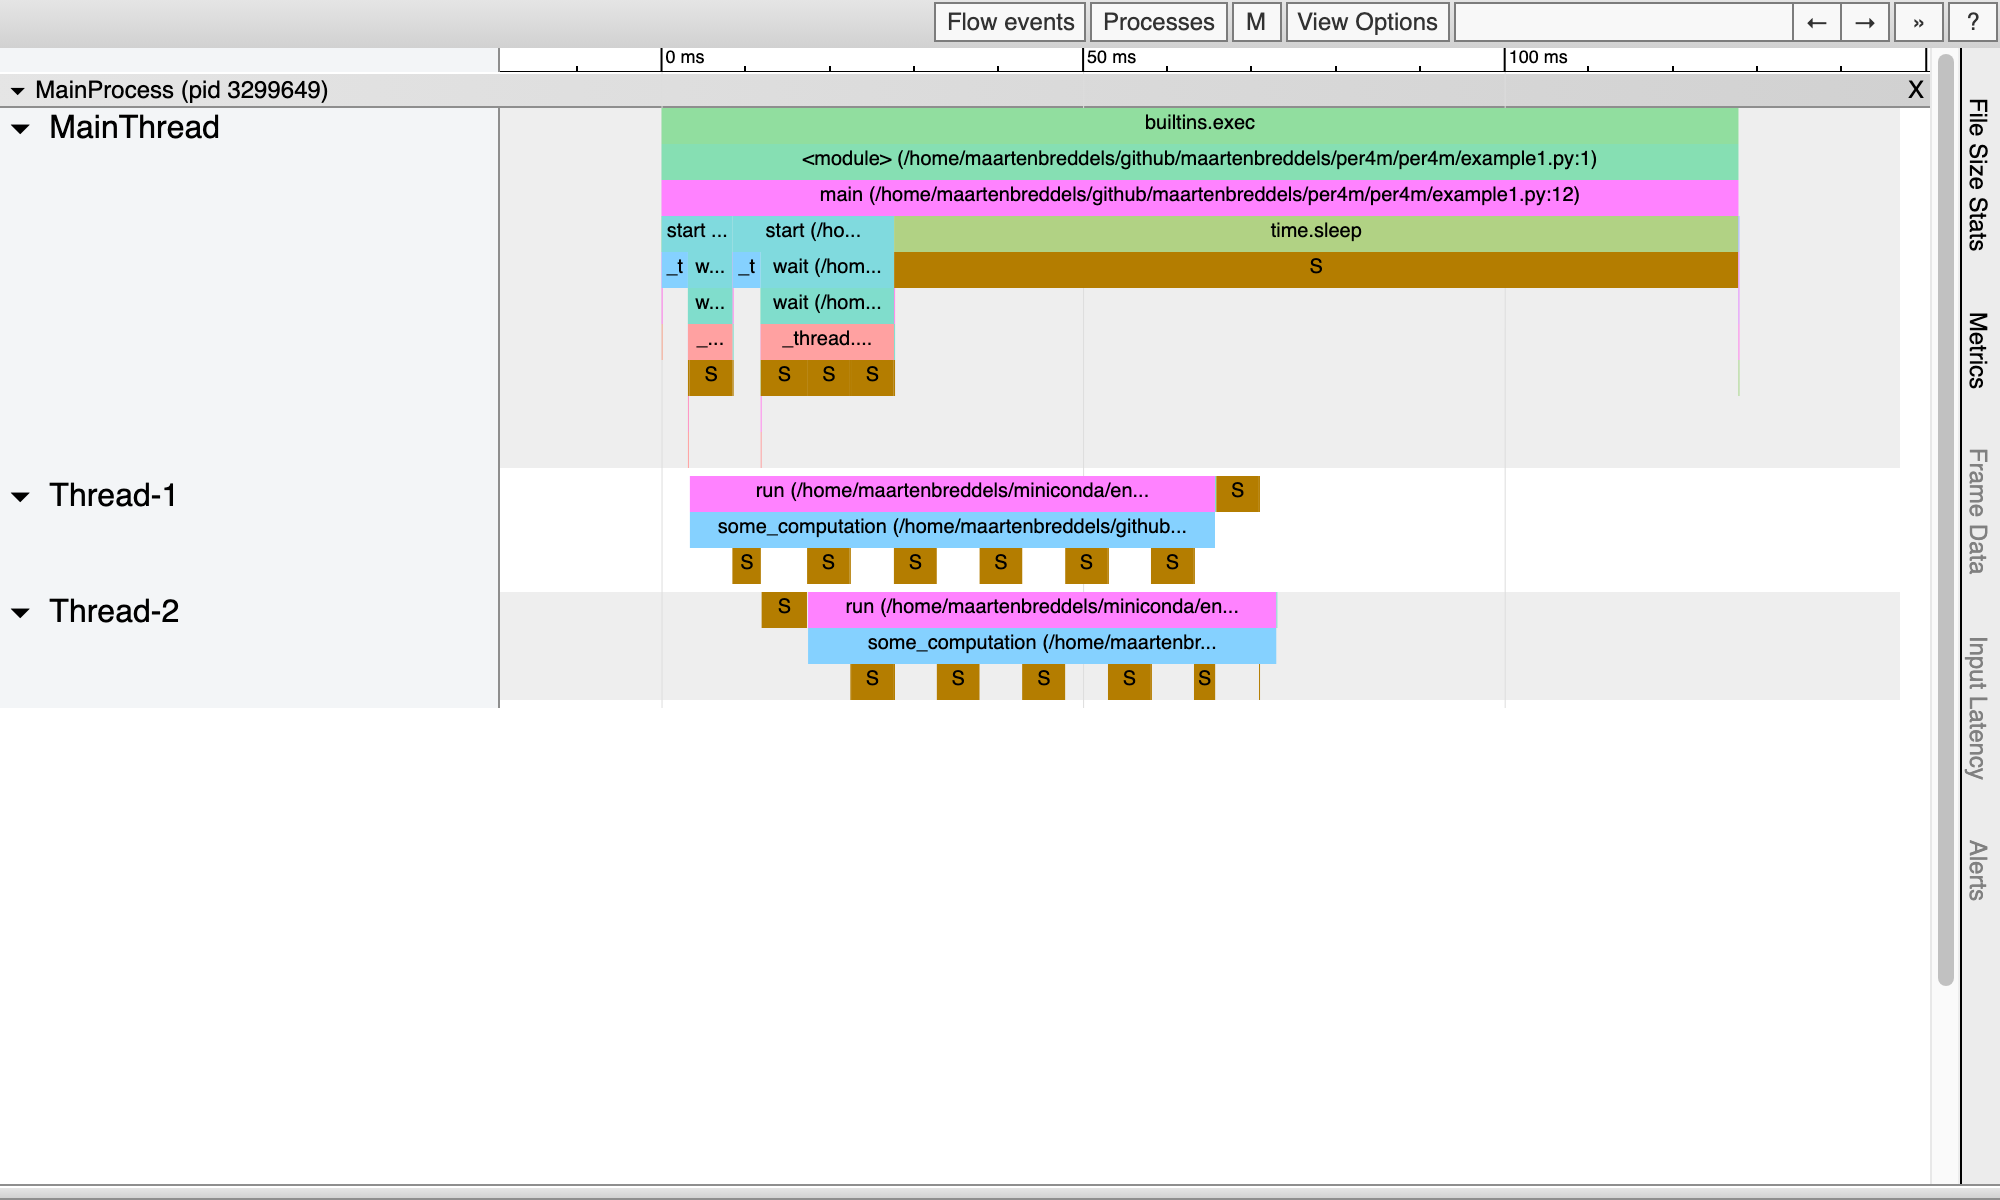
"This gives us:\n",
"\n",
"\n",
"From this visualization, it is clear the threads regularly enter a sleeping state due to the GIL and do not execute in parallel.\n",
"\n",
">Note: The length of the sleep phase is ~5ms, which corresponds to the default value of [sys.getswitchinterval](https://docs.python.org/3/library/sys.html#sys.getswitchinterval)"
]
},
{
"cell_type": "markdown",
"metadata": {},
"source": [
"# Detecting the GIL\n",
"We see our process sleeping, but we do not see any difference between the sleeping state being triggered by calling `time.sleep` and due to the GIL. There are multiple way to see the difference, and we will present two methods.\n",
"\n",
"## Via stack traces\n",
"Using `perf record -g` (or better `perf record --call-graph dwarf` which implies `-g`), we get stack traces for each event of perf.\n",
"\n",
"```\n",
"$ perf record -e sched:sched_switch -e sched:sched_process_fork -e 'sched:sched_wak*'\\\n",
" -k CLOCK_MONOTONIC --call-graph dwarf -- viztracer -o viztracer1-gil.json --ignore_frozen -m per4m.example1\n",
"Loading finish \n",
"Saving report to /home/maartenbreddels/github/maartenbreddels/per4m/viztracer1-gil.json ...\n",
"Dumping trace data to json, total entries: 94, estimated json file size: 11.0KiB\n",
"Report saved.\n",
"[ perf record: Woken up 3 times to write data ]\n",
"[ perf record: Captured and wrote 0,991 MB perf.data (164 samples) ]\n",
"```\n",
"\n",
"Looking at the output of `perf script` (where we add `--no-inline` for performance reasons), we get a load of information. Looking at a state change event, we can now see that [take_gil](https://github.com/python/cpython/blob/1a9f51ed12feb4d95ad6d0faf610a030c05b9f5e/Python/ceval_gil.h#L215) was called!\n",
"```\n",
"$ perf script --no-inline | less\n",
"...\n",
"viztracer 3306851 [059] 5614683.022539: sched:sched_switch: prev_comm=viztracer prev_pid=3306851 prev_prio=120 prev_state=S ==> next_comm=swapper/59 next_pid=0 next_prio=120\n",
" ffffffff96ed4785 __sched_text_start+0x375 ([kernel.kallsyms])\n",
" ffffffff96ed4785 __sched_text_start+0x375 ([kernel.kallsyms])\n",
" ffffffff96ed4b92 schedule+0x42 ([kernel.kallsyms])\n",
" ffffffff9654a51b futex_wait_queue_me+0xbb ([kernel.kallsyms])\n",
" ffffffff9654ac85 futex_wait+0x105 ([kernel.kallsyms])\n",
" ffffffff9654daff do_futex+0x10f ([kernel.kallsyms])\n",
" ffffffff9654dfef __x64_sys_futex+0x13f ([kernel.kallsyms])\n",
" ffffffff964044c7 do_syscall_64+0x57 ([kernel.kallsyms])\n",
" ffffffff9700008c entry_SYSCALL_64_after_hwframe+0x44 ([kernel.kallsyms])\n",
" 7f4884b977b1 pthread_cond_timedwait@@GLIBC_2.3.2+0x271 (/usr/lib/x86_64-linux-gnu/libpthread-2.31.so)\n",
" 55595c07fe6d take_gil+0x1ad (/home/maartenbreddels/miniconda/envs/dev/bin/python3.7)\n",
" 55595bfaa0b3 PyEval_RestoreThread+0x23 (/home/maartenbreddels/miniconda/envs/dev/bin/python3.7)\n",
" 55595c000872 lock_PyThread_acquire_lock+0x1d2 (/home/maartenbreddels/miniconda/envs/dev/bin/python3.7)\n",
" 55595bfe71f3 _PyMethodDef_RawFastCallKeywords+0x263 (/home/maartenbreddels/miniconda/envs/dev/bin/python3.7)\n",
" 55595bfe7313 _PyCFunction_FastCallKeywords+0x23 (/home/maartenbreddels/miniconda/envs/dev/bin/python3.7)\n",
" 55595c01d657 call_function+0x3b7 (/home/maartenbreddels/miniconda/envs/dev/bin/python3.7)\n",
" 55595c060d00 _PyEval_EvalFrameDefault+0x610 (/home/maartenbreddels/miniconda/envs/dev/bin/python3.7)\n",
" 55595bfb6db1 _PyEval_EvalCodeWithName+0x251 (/home/maartenbreddels/miniconda/envs/dev/bin/python3.7)\n",
" 55595bfd6b00 _PyFunction_FastCallKeywords+0x520 (/home/maartenbreddels/miniconda/envs/dev/bin/python3.7)\n",
" 55595c01d334 call_function+0x94 (/home/maartenbreddels/miniconda/envs/dev/bin/python3.7)\n",
" 55595c060d00 _PyEval_EvalFrameDefault+0x610 (/home/maartenbreddels/miniconda/envs/dev/bin/python3.7)\n",
" 55595bfd6766 _PyFunction_FastCallKeywords+0x186 (/home/maartenbreddels/miniconda/envs/dev/bin/python3.7)\n",
" 55595c060ae4 _PyEval_EvalFrameDefault+0x3f4 (/home/maartenbreddels/miniconda/envs/dev/bin/python3.7)\n",
" 55595bfb6db1 _PyEval_EvalCodeWithName+0x251 (/home/maartenbreddels/miniconda/envs/dev/bin/python3.7)\n",
" 55595c074e5d builtin_exec+0x33d (/home/maartenbreddels/miniconda/envs/dev/bin/python3.7)\n",
" 55595bfe7078 _PyMethodDef_RawFastCallKeywords+0xe8 (/home/maartenbreddels/miniconda/envs/dev/bin/python3.7)\n",
" 55595bfe7313 _PyCFunction_FastCallKeywords+0x23 (/home/maartenbreddels/miniconda/envs/dev/bin/python3.7)\n",
" 55595c066c39 _PyEval_EvalFrameDefault+0x6549 (/home/maartenbreddels/miniconda/envs/dev/bin/python3.7)\n",
" 55595bfb77e0 _PyEval_EvalCodeWithName+0xc80 (/home/maartenbreddels/miniconda/envs/dev/bin/python3.7)\n",
" 55595bfd6b62 _PyFunction_FastCallKeywords+0x582 (/home/maartenbreddels/miniconda/envs/dev/bin/python3.7)\n",
" 55595c01d334 call_function+0x94 (/home/maartenbreddels/miniconda/envs/dev/bin/python3.7)\n",
" 55595c060d00 _PyEval_EvalFrameDefault+0x610 (/home/maartenbreddels/miniconda/envs/dev/bin/python3.7)\n",
" 55595bfd6766 _PyFunction_FastCallKeywords+0x186 (/home/maartenbreddels/miniconda/envs/dev/bin/python3.7)\n",
" 55595c060ae4 _PyEval_EvalFrameDefault+0x3f4 (/home/maartenbreddels/miniconda/envs/dev/bin/python3.7)\n",
" 55595bfb6db1 _PyEval_EvalCodeWithName+0x251 (/home/maartenbreddels/miniconda/envs/dev/bin/python3.7)\n",
" 55595bfb81e2 PyEval_EvalCode+0x22 (/home/maartenbreddels/miniconda/envs/dev/bin/python3.7)\n",
" 55595c0c51d1 run_mod+0x31 (/home/maartenbreddels/miniconda/envs/dev/bin/python3.7)\n",
" 55595c0cf31d PyRun_FileExFlags+0x9d (/home/maartenbreddels/miniconda/envs/dev/bin/python3.7)\n",
" 55595c0cf50a PyRun_SimpleFileExFlags+0x1ba (/home/maartenbreddels/miniconda/envs/dev/bin/python3.7)\n",
" 55595c0d05f0 pymain_main+0x3e0 (/home/maartenbreddels/miniconda/envs/dev/bin/python3.7)\n",
" 55595c0d067b _Py_UnixMain+0x3b (/home/maartenbreddels/miniconda/envs/dev/bin/python3.7)\n",
" 7f48849bc0b2 __libc_start_main+0xf2 (/usr/lib/x86_64-linux-gnu/libc-2.31.so)\n",
" 55595c075100 _start+0x28 (/home/maartenbreddels/miniconda/envs/dev/bin/python3.7)\n",
"...\n",
"```\n",
"\n",
">Note: We also see that `pthread_cond_timedwait` is called, this is what https://github.com/sumerc/gilstats.py uses for a eBPF tool, in case you are interested in other mutexes.\n",
"\n",
">Note: Also note that we do not see Python stacktrace, but `_PyEval_EvalFrameDefault` etcetera instead. I plan to write how to inject Python stacktraces in a future article.\n",
"\n",
"\n",
"The `per4m perf2trace` convert tool understands this and will generate different output when `take_gil` is in the stacktrace:\n",
"\n",
"\n",
"```\n",
"$ perf script --no-inline | per4m perf2trace sched -o perf1-gil.json\n",
"Wrote to perf1-gil.json\n",
"$ viztracer --combine perf1-gil.json viztracer1-gil.json -o example1-gil.html\n",
"Saving report to /home/maartenbreddels/github/maartenbreddels/per4m/example1.html ...\n",
"Dumping trace data to json, total entries: 131, estimated json file size: 15.4KiB\n",
"Generating HTML report\n",
"Report saved.\n",
"```\n",
"\n",
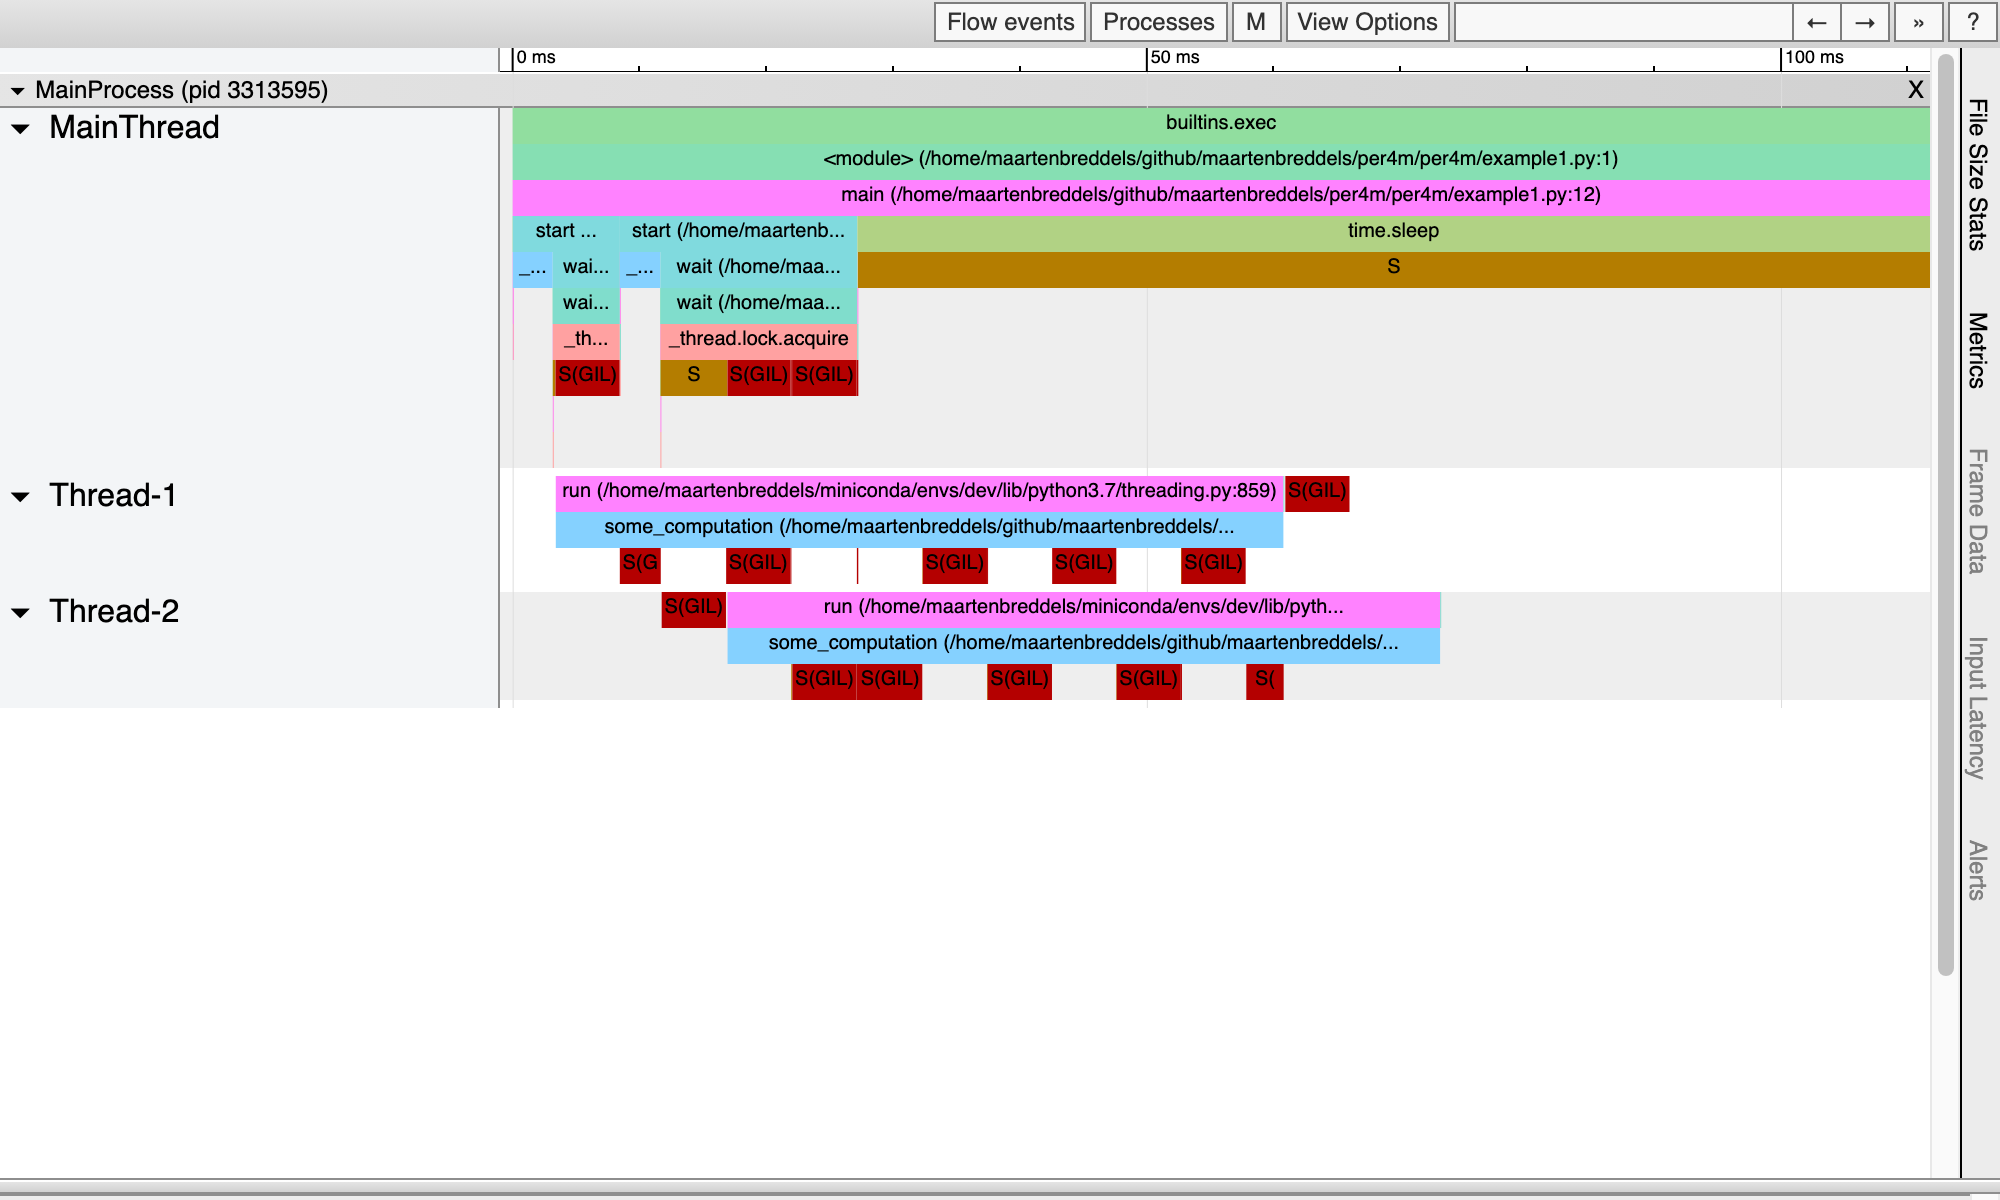
"This gives us:\n",
"\n",
"\n",
"Now we really see where the GIL plays a role!"
]
},
{
"cell_type": "markdown",
"metadata": {},
"source": [
"## Via probes (kprobes/uprobes)\n",
"We now know when processes are sleeping (due to the GIL or other reasons), but if we want to get a more detailed look at where the GIL is taken or dropped, we need to know where `take_gil` and `drop_gil` are being called as well as returned. This can be traced using uprobes via perf. Uprobes are probes in userland, the equivalent to kprobes, which as you may have guessed operate in kernel space. [Julia Evans](https://jvns.ca/blog/2017/07/09/linux-tracing-zine/) is again a great resource.\n",
"\n",
"Let us install the 4 uprobes:\n",
"```\n",
"sudo perf probe -f -x `which python` python:take_gil=take_gil\n",
"sudo perf probe -f -x `which python` python:take_gil=take_gil%return\n",
"sudo perf probe -f -x `which python` python:drop_gil=drop_gil\n",
"sudo perf probe -f -x `which python` python:drop_gil=drop_gil%return\n",
"\n",
"Added new events:\n",
" python:take_gil (on take_gil in /home/maartenbreddels/miniconda/envs/dev/bin/python3.7)\n",
" python:take_gil_1 (on take_gil in /home/maartenbreddels/miniconda/envs/dev/bin/python3.7)\n",
"\n",
"You can now use it in all perf tools, such as:\n",
"\n",
" perf record -e python:take_gil_1 -aR sleep 1\n",
"\n",
"Failed to find \"take_gil%return\",\n",
" because take_gil is an inlined function and has no return point.\n",
"Added new event:\n",
" python:take_gil__return (on take_gil%return in /home/maartenbreddels/miniconda/envs/dev/bin/python3.7)\n",
"\n",
"You can now use it in all perf tools, such as:\n",
"\n",
" perf record -e python:take_gil__return -aR sleep 1\n",
"\n",
"Added new events:\n",
" python:drop_gil (on drop_gil in /home/maartenbreddels/miniconda/envs/dev/bin/python3.7)\n",
" python:drop_gil_1 (on drop_gil in /home/maartenbreddels/miniconda/envs/dev/bin/python3.7)\n",
"\n",
"You can now use it in all perf tools, such as:\n",
"\n",
" perf record -e python:drop_gil_1 -aR sleep 1\n",
"\n",
"Failed to find \"drop_gil%return\",\n",
" because drop_gil is an inlined function and has no return point.\n",
"Added new event:\n",
" python:drop_gil__return (on drop_gil%return in /home/maartenbreddels/miniconda/envs/dev/bin/python3.7)\n",
"\n",
"You can now use it in all perf tools, such as:\n",
"\n",
" perf record -e python:drop_gil__return -aR sleep 1\n",
"\n",
"```\n",
"\n",
"It complains a bit and seems to add multiple probes/events because `drop_gil` and `take_gil` are inlined (which means the function is present multiple times in the binary), but it seems to work 🤷 (let me know in the comments if it does not work for you).\n",
"\n",
">Note: I may have been lucky, that the Python binary that I use (from conda-forge) is compiled in such a way that the relevant take_gil/drop_gil (and its return) that succeed are the relevant ones for this problem.\n",
"\n",
"\n",
"Note that the probes cause no performance hit, only when they are 'active' (like when we monitor them under perf) will the trigger a different code path. When monitored, the affected pages for the monitored process will be copied, and [breakpoints are inserted at the right locations](https://lwn.net/Articles/499190/) (INT3 for x86 CPUs). The breakpoint will trigger the event for perf, which causes a small overhead. In case you want to remove the probes, run:\n",
"\n",
"\n",
"```\n",
"$ sudo perf probe --del 'python*'\n",
"```\n",
"\n",
"Now `perf` understand new events that it can listen to, so let us run perf again with `-e 'python:*gil*'` as extra argument\n",
"\n",
"```\n",
"$ perf record -e sched:sched_switch -e sched:sched_process_fork -e 'sched:sched_wak*' -k CLOCK_MONOTONIC \\\n",
" -e 'python:*gil*' -- viztracer -o viztracer1-uprobes.json --ignore_frozen -m per4m.example1\n",
"```\n",
"\n",
">Note: we removed `--call-graph dwarf` otherwise perf cannot keep up, and we will lose events.\n",
"\n",
"\n",
"We then use `per4m perf2trace` to convert this to a JSON that VizTracer understands, while we also get some free statistics.\n",
"\n",
"\n",
"```\n",
"$ perf script --no-inline | per4m perf2trace gil -o perf1-uprobes.json\n",
"...\n",
"Summary of threads:\n",
"\n",
"PID total(us) no gil%✅ has gil%❗ gil wait%❌\n",
"-------- ----------- ----------- ------------ -------------\n",
"3353567* 164490.0 65.9 27.3 6.7\n",
"3353569 66560.0 0.3 48.2 51.5\n",
"3353570 60900.0 0.0 56.4 43.6\n",
"\n",
"High 'no gil' is good (✅), we like low 'has gil' (❗),\n",
" and we don't want 'gil wait' (❌). (* indicates main thread)\n",
"... \n",
"Wrote to perf1-uprobes.json\n",
"```\n",
"\n",
"Note that the `per4m perf2trace gil` subcommand also gives a [gil_load](https://github.com/chrisjbillington/gil_load) like output. From this output, we see that both threads are waiting for the GIL approximately 50% of the time, as expected.\n",
"\n",
"\n",
"Using the same `perf.data` file, that `perf record` generated, we can also generate the thread/process state information. However, because we ran without the stacktraces, we do not know if we are sleeping due to the GIL or not.\n",
"\n",
"```\n",
"$ perf script --no-inline | per4m perf2trace sched -o perf1-state.json\n",
"Wrote to perf1-state.json\n",
"```\n",
"\n",
"At last, we combine the three outputs:\n",
"```\n",
"$ viztracer --combine perf1-state.json perf1-uprobes.json viztracer1-uprobes.json -o example1-uprobes.html \n",
"Saving report to /home/maartenbreddels/github/maartenbreddels/per4m/example1-uprobes.html ...\n",
"Dumping trace data to json, total entries: 10484, estimated json file size: 1.2MiB\n",
"Generating HTML report\n",
"Report saved.\n",
"```\n",
"\n",
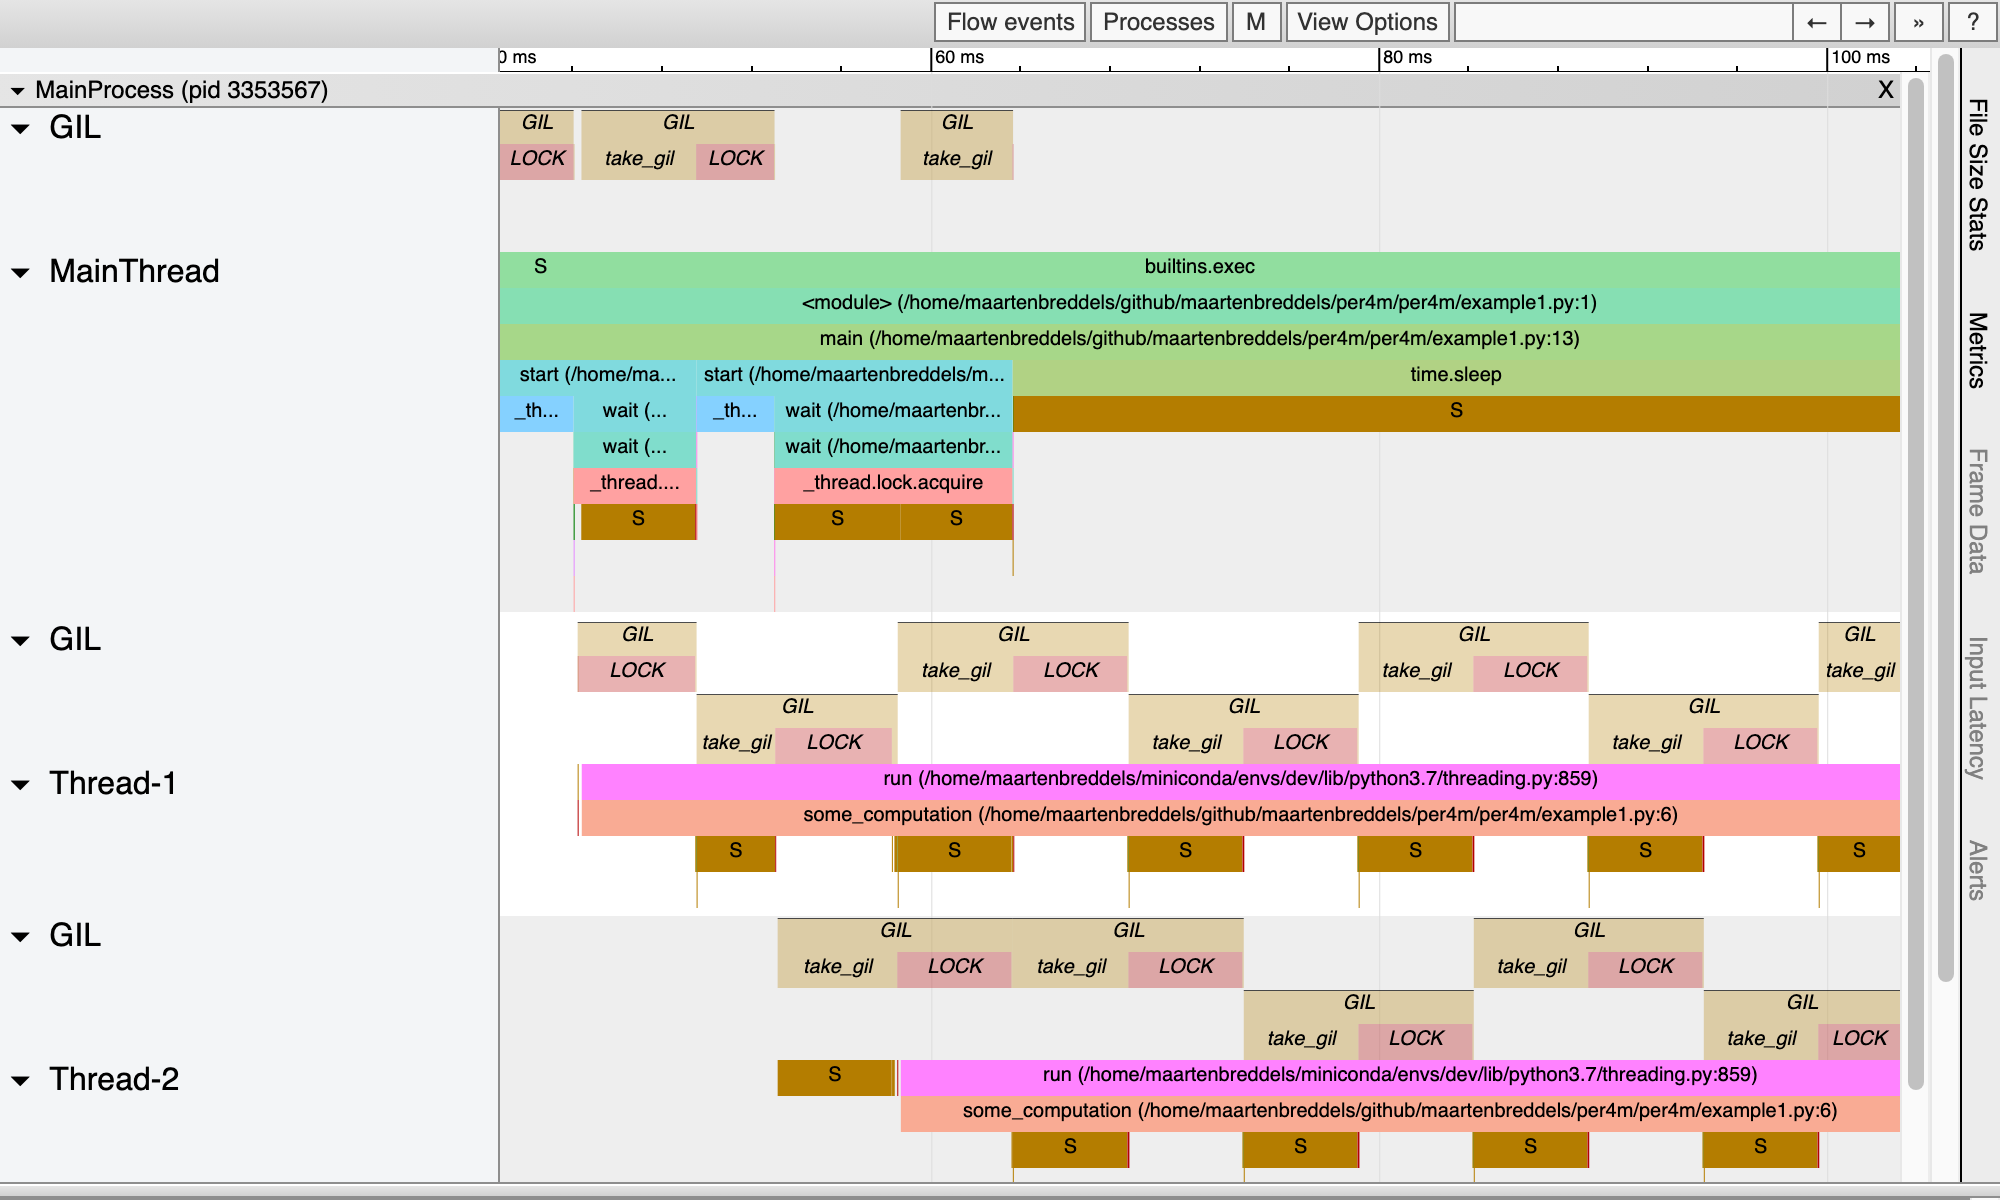
"Our VizTracer output gives us a good overview of who has, and wants the GIL:\n",
"\n",
"\n",
"Above each thread, we see when a thread/process wants to take the gil, and when it succeeded (marked by `LOCK`). Note that these periods overlap with the periods when the thread/process is *not* sleeping (so running!). Also note that we see only 1 thread/process in the running state, as expected due to the GIL.\n",
"\n",
"The time between each call to `take_gil`, and actually obtaining the lock (and thus leaving the sleeping state, or waking up), is exactly the time in the above table in the column `gil wait%❌`. The time each thread has the GIL, or the time spanned by `LOCK`, is the time in the column `has gil%❗`.\n"
]
},
{
"cell_type": "markdown",
"metadata": {},
"source": [
"# Releasing the Kraken... ehm GIL\n",
"\n",
"We saw a pure Python program, running multithreaded, where the GIL is limiting performance by letting only 1 thread/process run at a time [^1]. Let us now see what happens when the code releases the GIL, such as what happens when we execute NumPy functions.\n",
"\n",
"The second example execute `some_numpy_computation`, which calls a NumPy function `M=4` times, in parallel using 2 threads, while the main thread executes pure Python code.\n",
"\n",
"[^1]: Per Python process of course, and possibly in the future per (sub)interpreter. "
]
},
{
"cell_type": "code",
"execution_count": null,
"metadata": {},
"outputs": [],
"source": [
"# file per4m/example3.py\n",
"import threading\n",
"import time\n",
"import numpy as np\n",
"\n",
"N = 1024*1024*32\n",
"M = 4\n",
"x = np.arange(N, dtype='f8')\n",
"\n",
"\n",
"def some_numpy_computation():\n",
" total = 0\n",
" for i in range(M):\n",
" total += x.sum()\n",
" return total\n",
"\n",
"\n",
"\n",
"def main(args=None):\n",
" thread1 = threading.Thread(target=some_numpy_computation)\n",
" thread2 = threading.Thread(target=some_numpy_computation)\n",
" thread1.start()\n",
" thread2.start()\n",
" total = 0\n",
" for i in range(2_000_000):\n",
" total += i\n",
" for thread in [thread1, thread2]:\n",
" thread.join()\n",
"main()"
]
},
{
"cell_type": "markdown",
"metadata": {},
"source": [
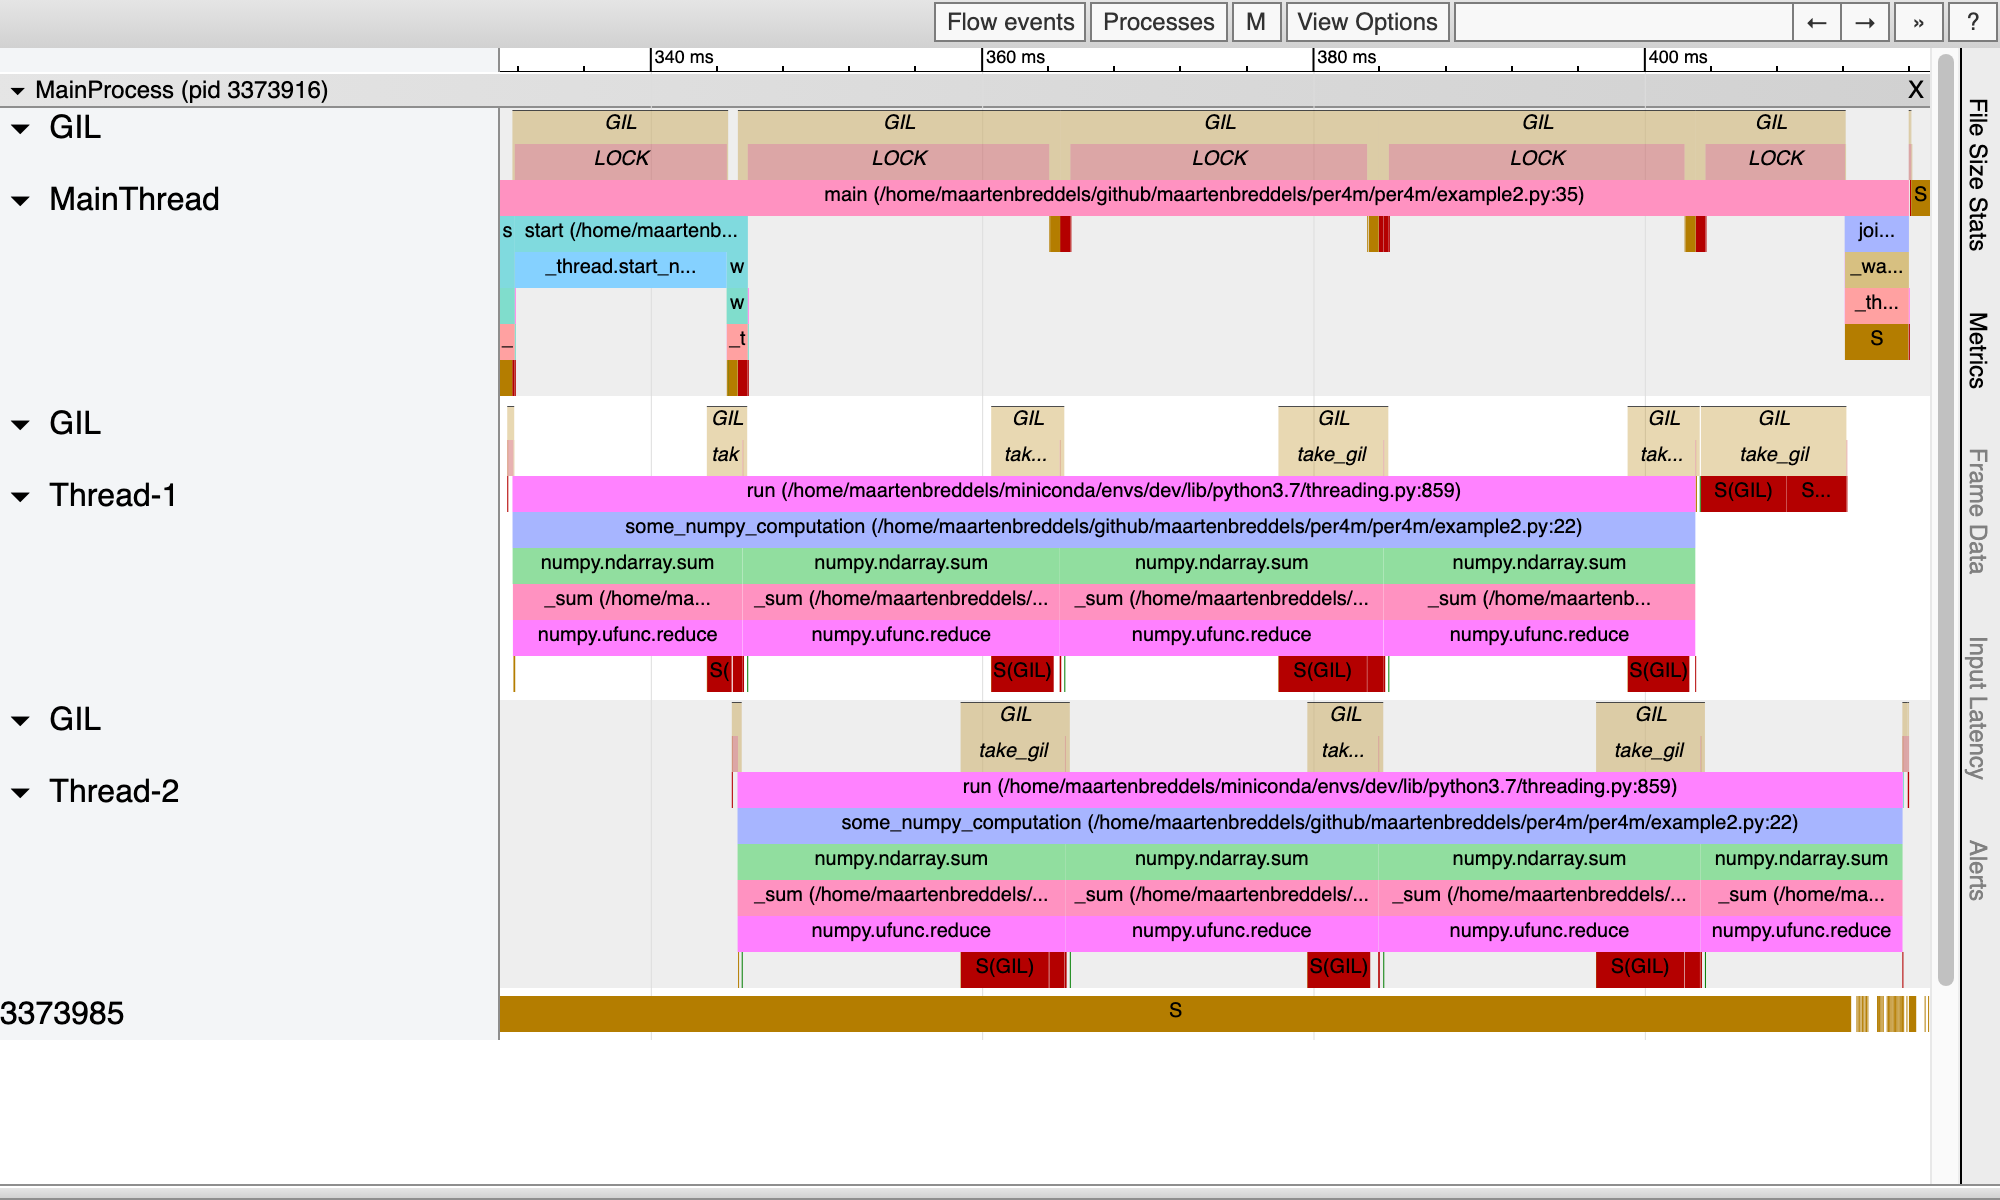
"Instead of running this script using perf and VizTracer, we now use the per4m `giltracer` util, which automates all the steps done above (in a slightly smarter way[^1]):\n",
"```\n",
"$ giltracer --state-detect -o example2-uprobes.html -m per4m.example2\n",
"...\n",
"\n",
"Summary of threads:\n",
"\n",
"PID total(us) no gil%✅ has gil%❗ gil wait%❌\n",
"-------- ----------- ----------- ------------ -------------\n",
"3373601* 1359990.0 95.8 4.2 0.1\n",
"3373683 60276.4 84.6 2.2 13.2\n",
"3373684 57324.0 89.2 1.9 8.9\n",
"\n",
"High 'no gil' is good (✅), we like low 'has gil' (❗),\n",
" and we don't want 'gil wait' (❌). (* indicates main thread)\n",
"...\n",
"Saving report to /home/maartenbreddels/github/maartenbreddels/per4m/example2-uprobes.html ...\n",
"...\n",
"```\n",
"\n",
"\n",
"\n",
"\n",
"We see that while the main thread is running Python code (it has the GIL, indicated by the `LOCK` above it), the threads are also running. Note that in the pure Python example we only had one thread/process running at a time. While here we see moments where 3 threads are truly running parallel). This is possible because the NumPy routines that enter into C/C++/Fortran, released the GIL.\n",
"\n",
"However, the threads are still hampered by the GIL, since once the NumPy function returns to Python land, it needs to obtain the GIL again as can be seen by the `take_gil` blocks taking a bit of time. This causes a 10% wait time for each thread. \n",
"\n",
"\n",
"[^1]: We actually start perf twice, once without stacktraces, once with, and we import the module/script before we execute its main function, to get rid of uninteresting tracing information, such as importing modules. This run fast enough that we do not lose events."
]
},
{
"cell_type": "markdown",
"metadata": {},
"source": [
"# Jupyter integration\n",
"Since my workflow often involves working from a MacBook laptop[^1] remotely connected to a Linux computer, I use the Jupyter notebook often to execute code remotely. Being a Jupyter developer, creating a cell magic to wrap this was mandatory.\n",
"\n",
"[^1]: Which does not run perf, but supports dtrace, but this is for another time."
]
},
{
"cell_type": "code",
"execution_count": null,
"metadata": {},
"outputs": [],
"source": [
"#\n",
"# this registers the giltracer cell magic\n",
"%load_ext per4m"
]
},
{
"cell_type": "code",
"execution_count": null,
"metadata": {},
"outputs": [
{
"name": "stdout",
"output_type": "stream",
"text": [
"Saving report to /tmp/tmpvi8zw9ut/viztracer.json ...\n",
"Dumping trace data to json, total entries: 117, estimated json file size: 13.7KiB\n",
"Report saved.\n",
"\n",
"[ perf record: Woken up 1 times to write data ]\n",
"[ perf record: Captured and wrote 0,094 MB /tmp/tmpvi8zw9ut/perf.data (244 samples) ]\n",
"\n",
"Wait for perf to finish...\n",
"perf script -i /tmp/tmpvi8zw9ut/perf.data --no-inline --ns | per4m perf2trace gil -o /tmp/tmpvi8zw9ut/giltracer.json -q -v \n",
"Saving report to /home/maartenbreddels/github/maartenbreddels/fastblog/_notebooks/giltracer.html ...\n",
"Dumping trace data to json, total entries: 849, estimated json file size: 99.5KiB\n",
"Generating HTML report\n",
"Report saved.\n"
]
},
{
"data": {
"text/html": [
"Download giltracer.html"
],
"text/plain": [
""
]
},
"metadata": {},
"output_type": "display_data"
},
{
"data": {
"text/html": [
"Open giltracer.html in new tab (might not work due to security issue)"
],
"text/plain": [
""
]
},
"metadata": {},
"output_type": "display_data"
}
],
"source": [
"%%giltracer\n",
"# this call the main define above, but this can also be a multiline code cell\n",
"main()"
]
},
{
"cell_type": "code",
"execution_count": null,
"metadata": {},
"outputs": [],
"source": []
},
{
"cell_type": "markdown",
"metadata": {},
"source": [
"# Conclusion\n",
"\n",
"Using perf, we can detect process/thread states which gives us an idea which thread/process has the GIL in Python. Using stacktraces, we can find out if the sleeping states are really due to the GIL, and not due to `time.sleep` for instance.\n",
"\n",
"Combining uprobes with perf, we can trace the calling and returning of the `take_gil` and `drop_gil` functions, getting an even better view on the effect of the GIL on your Python program.\n",
"\n",
"The `per4m` Python package, is an experimental package to do some of the `perf script` to VizTracer JSON format, and some orchestration tools to make this easier to work with.\n",
"\n",
"# TLDR\n",
"\n",
"If you just want to see where the GIL matters:\n",
"\n",
"Run this once:\n",
"```\n",
"sudo yum install perf\n",
"sudo sysctl kernel.perf_event_paranoid=-1\n",
"sudo mount -o remount,mode=755 /sys/kernel/debug\n",
"sudo mount -o remount,mode=755 /sys/kernel/debug/tracing\n",
"sudo perf probe -f -x `which python` python:take_gil=take_gil\n",
"sudo perf probe -f -x `which python` python:take_gil=take_gil%return\n",
"sudo perf probe -f -x `which python` python:drop_gil=drop_gil\n",
"sudo perf probe -f -x `which python` python:drop_gil=drop_gil%return\n",
"pip install \"viztracer>=0.11.2\" \"per4m>=0.1,<0.2\"\n",
"```\n",
"\n",
"Example usage:\n",
"```\n",
"# module\n",
"$ giltracer per4m/example2.py\n",
"# script\n",
"$ giltracer -m per4m.example2\n",
"# add thread/process state detection\n",
"$ giltracer --state-detect -m per4m.example2\n",
"# without uprobes (in case that fails)\n",
"$ giltracer --state-detect --no-gil-detect -m per4m.example2\n",
"```\n",
"\n",
"# Future plans\n",
"I wish I did not have to develop these tools, and hope I inspire other to build better tooling, that will deprecate mine. I want to write high-performance code, and focus on that.\n",
"\n",
"However, I do see some options that I plan to write about in the future:\n",
" * Expose hardware performance counter in VizTracer, to see for instance cache misses, or CPU stalling.\n",
" * Inject Python stacktraces into perf stacktraces, so we can combine them with tools from http://www.brendangregg.com/ .e.g. http://www.brendangregg.com/offcpuanalysis.html\n",
" * Repeat the same exercise using dtrace for usage under MacOS.\n",
" * Automatically detect which C function does *not* release the GIL (basically autodetect https://github.com/vaexio/vaex/pull/1114 https://github.com/apache/arrow/pull/7756 )\n",
" * Apply these to more issues, like in https://github.com/h5py/h5py/issues/1516\n",
"\n",
"If you have other ideas, want to pick some of this up, leave a message or contact me.\n",
"\n",
">Note: https://github.com/maartenbreddels/per4m is under a permissive MIT license, feel free to make use of that!"
]
},
{
"cell_type": "code",
"execution_count": null,
"metadata": {},
"outputs": [],
"source": []
}
],
"metadata": {
"keep_output": true,
"kernelspec": {
"display_name": "Python 3",
"language": "python",
"name": "python3"
},
"language_info": {
"codemirror_mode": {
"name": "ipython",
"version": 3
},
"file_extension": ".py",
"mimetype": "text/x-python",
"name": "python",
"nbconvert_exporter": "python",
"pygments_lexer": "ipython3",
"version": "3.7.8"
}
},
"nbformat": 4,
"nbformat_minor": 4
}