Beautiful, high-performance Graphs/Charts for React Native.
## About
**react-native-graph** is a Line Graph implementation based on the high performance 2D graphics rendering engine "Skia". It's used in the [Bamboo app](https://bambooassets.com) to power thousands of token graphs every day.
- 🏎️ Faster and smoother than react-native-svg graphs
- ⚡️ Native path interpolation in Skia
- 🐎 Up to 120 FPS animations
- 📈 Cubic bezier rendering for smoother edges
- 👍 Smooth pan/scrubbing gesture
- 💰 Made for crypto apps and Wallets
- ❌ Does not block navigation, press or scroll animations
## Installation
### Expo
The [Expo example](./example/) runs in Expo Go with Expo SDK 57. Install `react-native-graph` alongside the Expo SDK's compatible versions of Skia, Reanimated, Worklets, and Gesture Handler. Start the example from its `example` directory and open it in Expo Go to try the graph without building a custom development client.
## Usage
```tsx
import { LineGraph, type GraphPoint } from 'react-native-graph';
const priceHistory: GraphPoint[] = [
{ date: new Date('2026-08-27T00:00:00Z'), value: 3.44 },
{ date: new Date('2026-08-28T00:00:00Z'), value: 3.51 },
{ date: new Date('2026-08-29T00:00:00Z'), value: 3.49 },
];
function App() {
return (
);
}
```
`react-native-graph` does not fetch data or provide a `usePriceHistory` hook. Create the `GraphPoint[]` from your own API, state, or local data. Each point uses a `Date` for its horizontal position and a `number` for its vertical value; keep the points ordered from oldest to newest. Categorical string values are not supported on the x-axis.
## Configuration
`LineGraph` accepts the following props. It also accepts React Native [`ViewProps`](https://reactnative.dev/docs/view#props), which are forwarded to the root view.
| Prop | Type | Default | Availability | Description |
| ------------------------- | ------------------------------------------ | -------------------------------------------------- | ----------------- | -------------------------------------------------------------------------------------------------------------------------------------- |
| `animated` | `boolean` | `false` | Always | Uses the animated renderer when `true` and the lightweight static renderer when `false`. |
| `points` | `GraphPoint[]` | None. Required. | Always | The points to draw. Each point contains a numeric `value` and a `Date`. The graph scales to fit them unless `range` overrides an axis. |
| `color` | `string` | None. Required. | Always | The graph line color. |
| `range` | `GraphRange` | `undefined`. Both axes are inferred from `points`. | Always | Overrides all or part of the visible x-axis and y-axis ranges. |
| `gradientFillColors` | `Color[]` | `undefined`. No area fill is drawn. | `animated={true}` | Colors for the vertical gradient below the graph line. |
| `lineThickness` | `number` | `3` | Always | The graph line width in points. |
| `enableFadeInMask` | `boolean` | `false` | Always | Fades in the start of the graph line. |
| `enablePanGesture` | `boolean` | `false` | `animated={true}` | Lets the user press and scrub through graph points. |
| `panGestureDelay` | `number` | `300` | `animated={true}` | Time in milliseconds that a press must be held before scrubbing starts. Set it to `0` to start immediately. |
| `onGestureStart` | `() => void` | `undefined`. No callback runs. | `animated={true}` | Called when scrubbing starts. |
| `onPointSelected` | `(point: GraphPoint) => void` | `undefined`. No callback runs. | `animated={true}` | Called when scrubbing reaches a different point. |
| `onGestureEnd` | `() => void` | `undefined`. No callback runs. | `animated={true}` | Called when scrubbing ends. |
| `SelectionDot` | `ComponentType \| null` | Built-in `SelectionDot` | `animated={true}` | Renders the current scrub position. Pass `null` to hide it. |
| `selectionDotShadowColor` | `string` | `undefined` | `animated={true}` | Currently unused. This prop has no visual effect. |
| `horizontalPadding` | `number` | `10` when the indicator is enabled, otherwise `0` | `animated={true}` | Adds space to both horizontal edges of the drawing area. |
| `verticalPadding` | `number` | The value of `lineThickness` | `animated={true}` | Adds space to both vertical edges of the drawing area. |
| `enableIndicator` | `boolean` | `false` | `animated={true}` | Shows an indicator at the last graph point. |
| `indicatorPulsating` | `boolean` | `false` | `animated={true}` | Pulses the indicator while the graph is idle. Requires `enableIndicator`. |
| `TopAxisLabel` | `() => ReactElement \| null` | `undefined`. Nothing is rendered. | `animated={true}` | Renders a label above the graph. |
| `BottomAxisLabel` | `() => ReactElement \| null` | `undefined`. Nothing is rendered. | `animated={true}` | Renders a label below the graph. |
### Data types
```ts
interface GraphPoint {
value: number;
date: Date;
}
interface GraphRange {
x?: { min: Date; max: Date };
y?: { min: number; max: number };
}
```
You can provide either axis in `range` and let the graph infer the other one from `points`.
## Prop examples
### `animated`
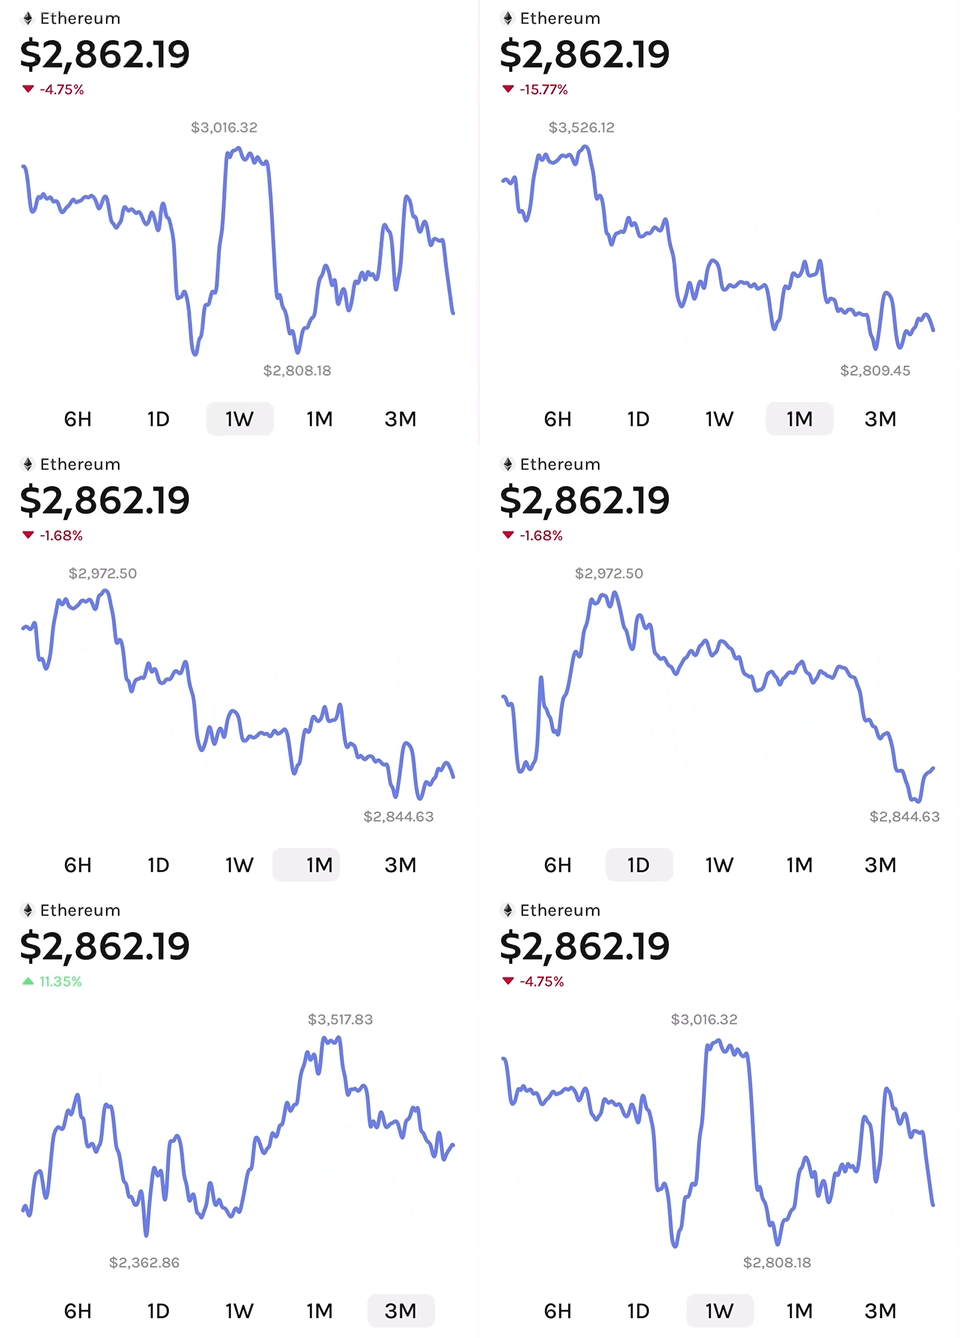
Whether to animate between data changes. Defaults to `false` when omitted.
Animations run using the [Skia animation system](https://shopify.github.io/react-native-skia/docs/animations/animations), with path interpolation handled on the UI thread.
If `animated` is `false`, the graph uses a lightweight static renderer. This is useful when displaying many graphs in a list.
Example:
```jsx
```
---
### `enablePanGesture`
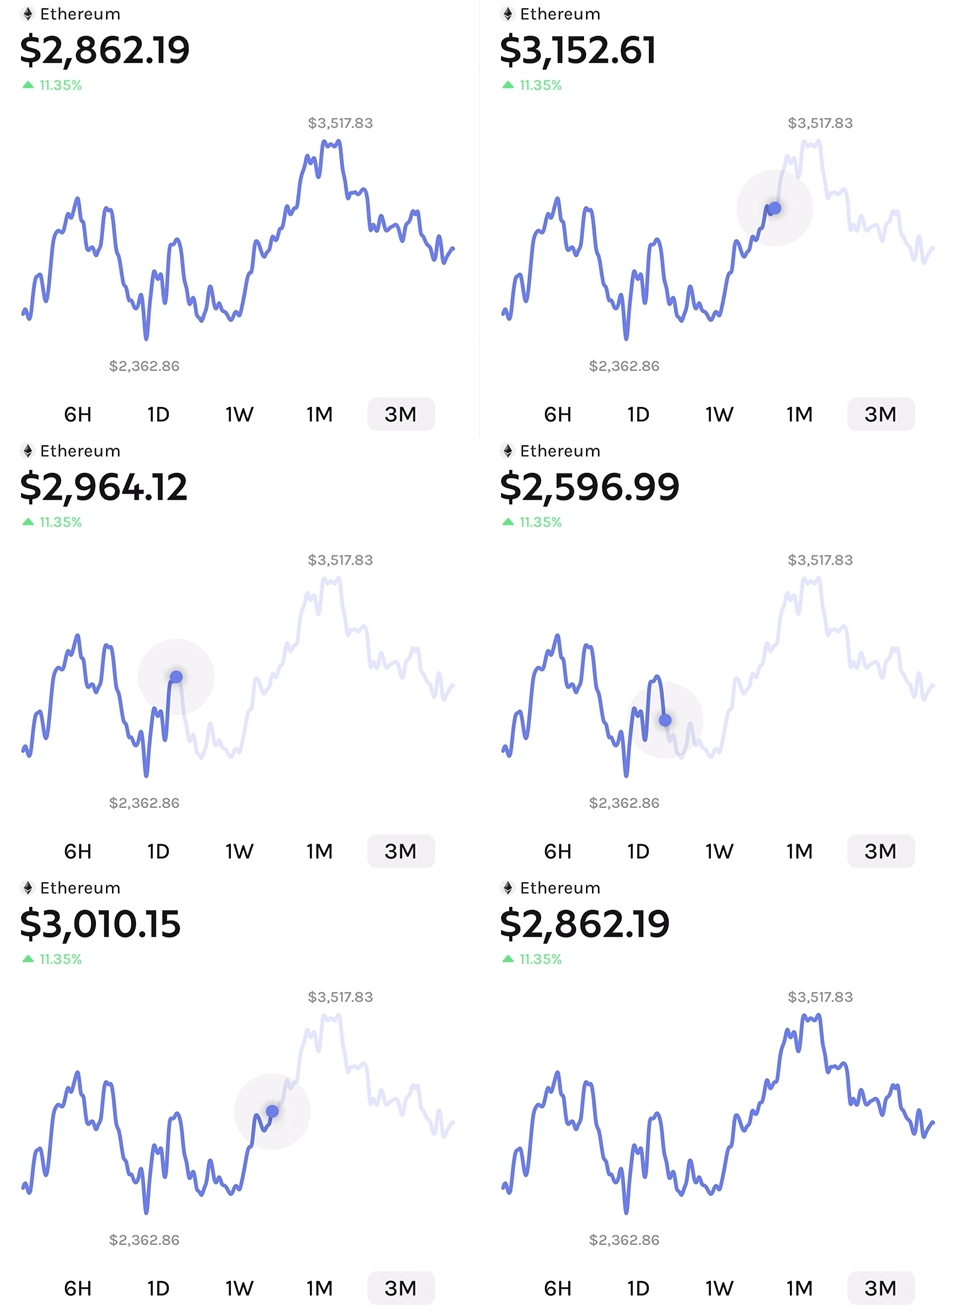
Whether to enable the pan gesture. Defaults to `false`.
> Requires `animated` to be `true`.
There are three events fired when the user interacts with the graph:
1. `onGestureStart`: Fires once the user presses and holds the graph. The pan gesture activates.
2. `onPointSelected`: Fires for each point the user pans through. Use it to update a label or highlight the selected value.
3. `onGestureEnd`: Fires once the user releases the graph. The pan gesture deactivates.
The pan gesture can be configured using these props:
- `panGestureDelay` controls how long the user must hold before the gesture activates. It defaults to `300` milliseconds. Set it to `0` to start immediately.
Example:
```jsx
hapticFeedback('impactLight')}
onPointSelected={(p) => updatePriceTitle(p)}
onGestureEnd={() => resetPriceTitle()}
/>
```
---
### `TopAxisLabel` / `BottomAxisLabel`
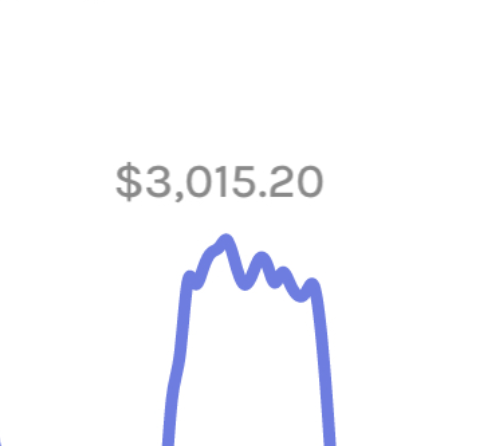
Renders labels above or below the graph. Both props default to `undefined`, so no labels are rendered.
> Requires `animated` to be `true`.
These labels usually show the maximum and minimum values. `AxisLabel` is not a component exported by this package: both props are callbacks that receive no arguments and render any React Native element you provide. The graph reserves a row above or below the canvas; positioning and styling inside that row belong to your label component.
Example:
```tsx
import { Text } from 'react-native';
function PriceGraph() {
const values = priceHistory.map((point) => point.value);
const maxValue = Math.max(...values);
const minValue = Math.min(...values);
return (
{`Max: ${maxValue.toFixed(2)}`}}
BottomAxisLabel={() => {`Min: ${minValue.toFixed(2)}`}}
/>
);
}
```
### `range`
Defines the visible range of the graph canvas. It defaults to `undefined`, which infers both axes from `points`.
Use a custom range to show a fixed time frame or value scale, even when the data does not cover the whole range. Points outside the x-axis range are not drawn.

 Whether to animate between data changes. Defaults to `false` when omitted.
Animations run using the [Skia animation system](https://shopify.github.io/react-native-skia/docs/animations/animations), with path interpolation handled on the UI thread.
If `animated` is `false`, the graph uses a lightweight static renderer. This is useful when displaying many graphs in a list.
Example:
```jsx
Whether to animate between data changes. Defaults to `false` when omitted.
Animations run using the [Skia animation system](https://shopify.github.io/react-native-skia/docs/animations/animations), with path interpolation handled on the UI thread.
If `animated` is `false`, the graph uses a lightweight static renderer. This is useful when displaying many graphs in a list.
Example:
```jsx
 Whether to enable the pan gesture. Defaults to `false`.
> Requires `animated` to be `true`.
There are three events fired when the user interacts with the graph:
1. `onGestureStart`: Fires once the user presses and holds the graph. The pan gesture activates.
2. `onPointSelected`: Fires for each point the user pans through. Use it to update a label or highlight the selected value.
3. `onGestureEnd`: Fires once the user releases the graph. The pan gesture deactivates.
The pan gesture can be configured using these props:
- `panGestureDelay` controls how long the user must hold before the gesture activates. It defaults to `300` milliseconds. Set it to `0` to start immediately.
Example:
```jsx
Whether to enable the pan gesture. Defaults to `false`.
> Requires `animated` to be `true`.
There are three events fired when the user interacts with the graph:
1. `onGestureStart`: Fires once the user presses and holds the graph. The pan gesture activates.
2. `onPointSelected`: Fires for each point the user pans through. Use it to update a label or highlight the selected value.
3. `onGestureEnd`: Fires once the user releases the graph. The pan gesture deactivates.
The pan gesture can be configured using these props:
- `panGestureDelay` controls how long the user must hold before the gesture activates. It defaults to `300` milliseconds. Set it to `0` to start immediately.
Example:
```jsx
 Renders labels above or below the graph. Both props default to `undefined`, so no labels are rendered.
> Requires `animated` to be `true`.
These labels usually show the maximum and minimum values. `AxisLabel` is not a component exported by this package: both props are callbacks that receive no arguments and render any React Native element you provide. The graph reserves a row above or below the canvas; positioning and styling inside that row belong to your label component.
Example:
```tsx
import { Text } from 'react-native';
function PriceGraph() {
const values = priceHistory.map((point) => point.value);
const maxValue = Math.max(...values);
const minValue = Math.min(...values);
return (
Renders labels above or below the graph. Both props default to `undefined`, so no labels are rendered.
> Requires `animated` to be `true`.
These labels usually show the maximum and minimum values. `AxisLabel` is not a component exported by this package: both props are callbacks that receive no arguments and render any React Native element you provide. The graph reserves a row above or below the canvas; positioning and styling inside that row belong to your label component.
Example:
```tsx
import { Text } from 'react-native';
function PriceGraph() {
const values = priceHistory.map((point) => point.value);
const maxValue = Math.max(...values);
const minValue = Math.min(...values);
return (
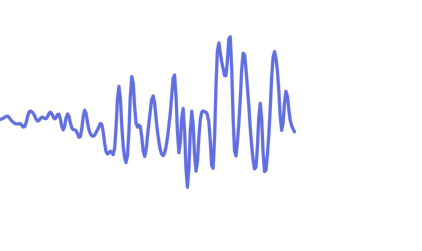 Defines the visible range of the graph canvas. It defaults to `undefined`, which infers both axes from `points`.
Use a custom range to show a fixed time frame or value scale, even when the data does not cover the whole range. Points outside the x-axis range are not drawn.
Defines the visible range of the graph canvas. It defaults to `undefined`, which infers both axes from `points`.
Use a custom range to show a fixed time frame or value scale, even when the data does not cover the whole range. Points outside the x-axis range are not drawn.
 Renders the selection dot. It defaults to the built-in `SelectionDot`. Pass `null` to hide it.
> Requires `animated` and `enablePanGesture` to be `true`.
A custom selection-dot component receives these props from `LineGraph`. They are all required and have no defaults when you render `SelectionDot` directly.
| Prop | Type | Default | Description |
| --------------- | ---------------------- | --------------- | ----------------------------------------------------------- |
| `isActive` | `SharedValue
Renders the selection dot. It defaults to the built-in `SelectionDot`. Pass `null` to hide it.
> Requires `animated` and `enablePanGesture` to be `true`.
A custom selection-dot component receives these props from `LineGraph`. They are all required and have no defaults when you render `SelectionDot` directly.
| Prop | Type | Default | Description |
| --------------- | ---------------------- | --------------- | ----------------------------------------------------------- |
| `isActive` | `SharedValue **react-native-graph** is sponsored by [Pink Panda](https://pinkpanda.io).
Download the Pink Panda mobile app to see react-native-graph in action!
## Community Discord
[Join the Margelo Community Discord](https://discord.gg/6CSHz2qAvA) to chat about react-native-graph or other Margelo libraries.
## Adopting at scale
react-native-graph was built at Margelo, an elite app development agency. For enterprise support or other business inquiries, contact us at hello@margelo.com!
## Thanks
Special thanks to [William Candillon](https://github.com/wcandillon) and [Christian Falch](https://github.com/chrfalch) for their amazing help and support for React Native Skia ❤️
**react-native-graph** is sponsored by [Pink Panda](https://pinkpanda.io).
Download the Pink Panda mobile app to see react-native-graph in action!
## Community Discord
[Join the Margelo Community Discord](https://discord.gg/6CSHz2qAvA) to chat about react-native-graph or other Margelo libraries.
## Adopting at scale
react-native-graph was built at Margelo, an elite app development agency. For enterprise support or other business inquiries, contact us at hello@margelo.com!
## Thanks
Special thanks to [William Candillon](https://github.com/wcandillon) and [Christian Falch](https://github.com/chrfalch) for their amazing help and support for React Native Skia ❤️