
Sampling frequency units can be specified for Axes.psd#
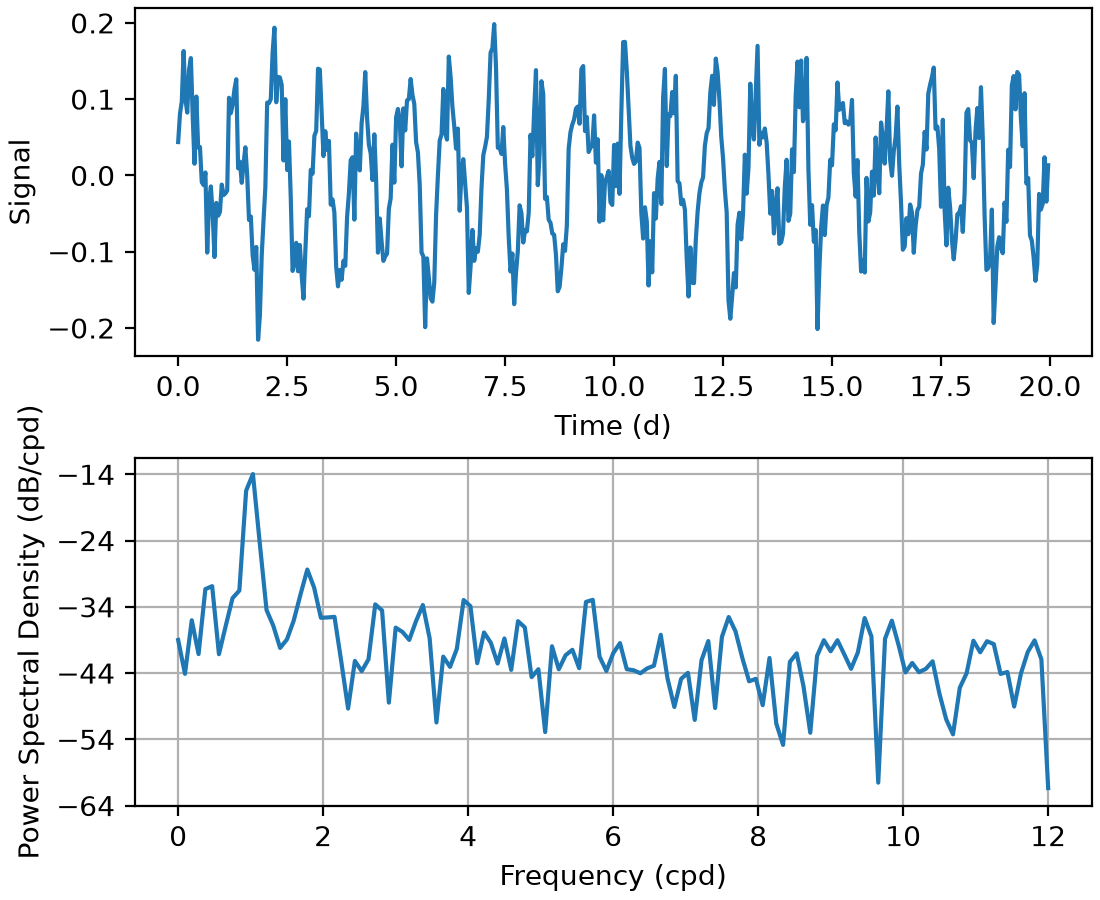
When creating a power spectral density (psd) plot, the units of the sampling frequency can be specified. (Units were previously always assumed to be Hz.)
# Sampling period in units of days
dt = 1/24

# Create example signal: sinusoid with red noise
np.random.seed(19680801)  # Fixing random state for reproducibility.
t = np.arange(0, 20, dt)
nse = np.random.randn(len(t))
r = np.exp(-t / 0.05)
cnse = np.convolve(nse, r) * dt
cnse = cnse[:len(t)]
s = 0.1 * np.sin(2 * np.pi * t) + cnse

# Show signal and power spectral density
fig, (ax0, ax1) = plt.subplots(2, 1, layout='constrained')
ax0.plot(t,s)
ax0.set(xlabel='Time (d)', ylabel='Signal')
ax1.psd(s, NFFT=256, Fs=1 / dt, Funits='cpd')
plt.show()
(Source code, 2x.png, png)