# simfinapi  [](https://lifecycle.r-lib.org/articles/stages.html#experimental) [](https://CRAN.R-project.org/package=simfinapi) [](https://www.repostatus.org/#active) [](https://github.com/matthiasgomolka/simfinapi/actions) [](https://app.codecov.io/gh/matthiasgomolka/simfinapi) [](https://cran.r-project.org/package=simfinapi)
## What does simfinapi do?
simfinapi wraps the Web-API to make ‘SimFin’ data easily available in R.
*To use the package, you need to register at and obtain a ‘SimFin’ API key.*
## Example
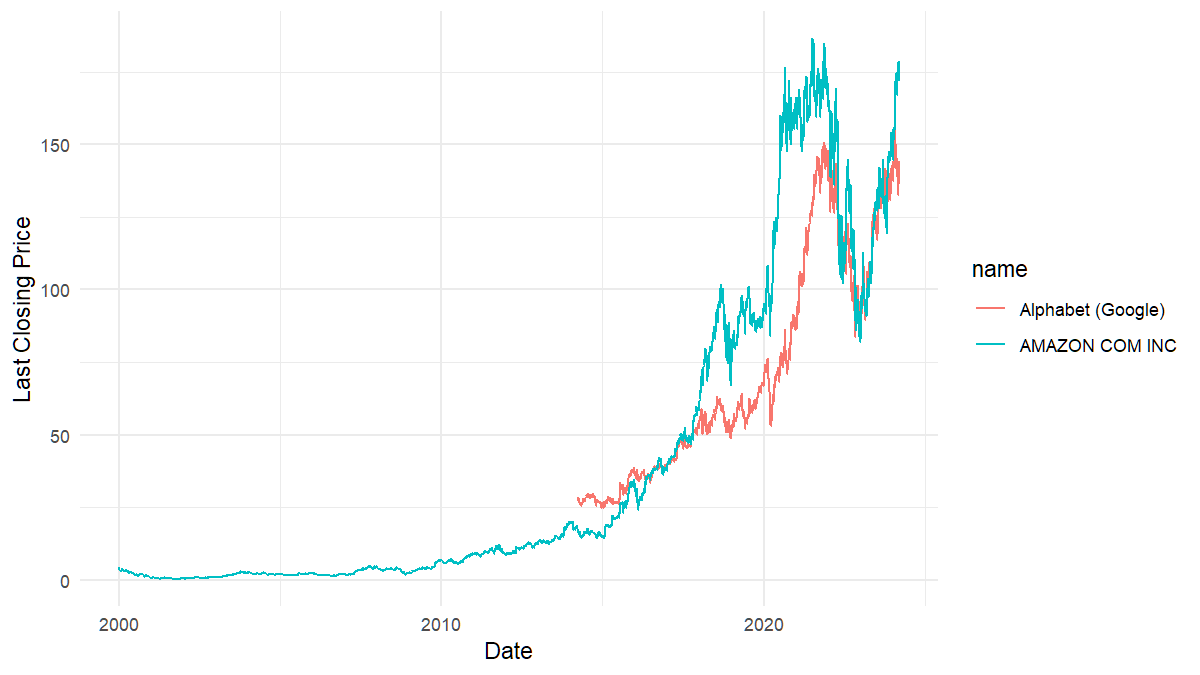
In this example, we download some stock price data and turn these into a simple plot.
``` r
# load package
# library(simfinapi)
devtools::load_all()
#> ℹ Loading simfinapi
# download stock price data
tickers <- c("AMZN", "GOOG") # Amazon, Google
prices <- sfa_load_shareprices(tickers)
```
Please note that all functions in simfinapi start with the prefix `sfa_`. This makes it easy to find all available functionality.
The downloaded data looks like this:
| name | id | ticker | currency | Date | Dividend Paid | Common Shares Outstanding | Last Closing Price | Adjusted Closing Price | Highest Price | Lowest Price | Opening Price | Trading Volume |
|:------------------|----:|:-------|:---------|:-----------|--------------:|--------------------------:|-------------------:|-----------------------:|--------------:|-------------:|--------------:|---------------:|
| Alphabet (Google) | 18 | GOOG | USD | 2014-03-27 | NA | 6721016620 | 27.92 | 27.92 | 28.40 | 27.65 | 28.40 | 262000 |
| Alphabet (Google) | 18 | GOOG | USD | 2014-03-28 | NA | 6721016620 | 28.00 | 28.00 | 28.32 | 27.93 | 28.06 | 822000 |
| Alphabet (Google) | 18 | GOOG | USD | 2014-03-31 | NA | 13489240000 | 27.85 | 27.85 | 28.35 | 27.85 | 28.34 | 216000 |
| Alphabet (Google) | 18 | GOOG | USD | 2014-04-01 | NA | 13489240000 | 28.36 | 28.36 | 28.42 | 27.94 | 27.94 | 158000 |
| Alphabet (Google) | 18 | GOOG | USD | 2014-04-02 | NA | 13489240000 | 28.35 | 28.35 | 30.24 | 28.11 | 28.26 | 2934000 |
| Alphabet (Google) | 18 | GOOG | USD | 2014-04-03 | NA | 13489240000 | 28.49 | 28.49 | 29.36 | 28.21 | 28.49 | 101704000 |
Let’s turn that into a simple plot.
``` r
# load ggplot2
library(ggplot2)
# create plot
ggplot(prices) +
aes(x = Date, y = `Last Closing Price`, color = name) +
geom_line()
```
[](https://lifecycle.r-lib.org/articles/stages.html#experimental) [](https://CRAN.R-project.org/package=simfinapi) [](https://www.repostatus.org/#active) [](https://github.com/matthiasgomolka/simfinapi/actions) [](https://app.codecov.io/gh/matthiasgomolka/simfinapi) [](https://cran.r-project.org/package=simfinapi)
## What does simfinapi do?
simfinapi wraps the Web-API to make ‘SimFin’ data easily available in R.
*To use the package, you need to register at and obtain a ‘SimFin’ API key.*
## Example
In this example, we download some stock price data and turn these into a simple plot.
``` r
# load package
# library(simfinapi)
devtools::load_all()
#> ℹ Loading simfinapi
# download stock price data
tickers <- c("AMZN", "GOOG") # Amazon, Google
prices <- sfa_load_shareprices(tickers)
```
Please note that all functions in simfinapi start with the prefix `sfa_`. This makes it easy to find all available functionality.
The downloaded data looks like this:
| name | id | ticker | currency | Date | Dividend Paid | Common Shares Outstanding | Last Closing Price | Adjusted Closing Price | Highest Price | Lowest Price | Opening Price | Trading Volume |
|:------------------|----:|:-------|:---------|:-----------|--------------:|--------------------------:|-------------------:|-----------------------:|--------------:|-------------:|--------------:|---------------:|
| Alphabet (Google) | 18 | GOOG | USD | 2014-03-27 | NA | 6721016620 | 27.92 | 27.92 | 28.40 | 27.65 | 28.40 | 262000 |
| Alphabet (Google) | 18 | GOOG | USD | 2014-03-28 | NA | 6721016620 | 28.00 | 28.00 | 28.32 | 27.93 | 28.06 | 822000 |
| Alphabet (Google) | 18 | GOOG | USD | 2014-03-31 | NA | 13489240000 | 27.85 | 27.85 | 28.35 | 27.85 | 28.34 | 216000 |
| Alphabet (Google) | 18 | GOOG | USD | 2014-04-01 | NA | 13489240000 | 28.36 | 28.36 | 28.42 | 27.94 | 27.94 | 158000 |
| Alphabet (Google) | 18 | GOOG | USD | 2014-04-02 | NA | 13489240000 | 28.35 | 28.35 | 30.24 | 28.11 | 28.26 | 2934000 |
| Alphabet (Google) | 18 | GOOG | USD | 2014-04-03 | NA | 13489240000 | 28.49 | 28.49 | 29.36 | 28.21 | 28.49 | 101704000 |
Let’s turn that into a simple plot.
``` r
# load ggplot2
library(ggplot2)
# create plot
ggplot(prices) +
aes(x = Date, y = `Last Closing Price`, color = name) +
geom_line()
```
 ## Installation
From [CRAN](https://CRAN.R-project.org/package=simfinapi):
``` r
install.packages("simfinapi")
```
If you want to try out the newest features you may want to give the development version a try and install it from [GitHub](https://github.com/matthiasgomolka/simfinapi):
``` r
remotes::install_github("https://github.com/matthiasgomolka/simfinapi")
```
## Setup
Using simfinapi is much more convenient if you set your API key and cache directory[^readme-1] globally before you start downloading data. See `?sfa_set_api_key` and `?sfa_set_cache_dir` for details.
[^readme-1]: simfinapi always caches the results from your API calls to obtain results quicker and to reduce the number of API calls. If you set the cache directory to a permanent directory (the default is `tempdir()`), simfinapi will be able to reuse this cache in subsequent R sessions.
## Code of Conduct
Please note that the ‘simfinapi’ project is released with a [Contributor Code of Conduct](https://github.com/matthiasgomolka/simfinapi/blob/master/.github/CODE_OF_CONDUCT.md). By contributing to this project, you agree to abide by its terms.
## Installation
From [CRAN](https://CRAN.R-project.org/package=simfinapi):
``` r
install.packages("simfinapi")
```
If you want to try out the newest features you may want to give the development version a try and install it from [GitHub](https://github.com/matthiasgomolka/simfinapi):
``` r
remotes::install_github("https://github.com/matthiasgomolka/simfinapi")
```
## Setup
Using simfinapi is much more convenient if you set your API key and cache directory[^readme-1] globally before you start downloading data. See `?sfa_set_api_key` and `?sfa_set_cache_dir` for details.
[^readme-1]: simfinapi always caches the results from your API calls to obtain results quicker and to reduce the number of API calls. If you set the cache directory to a permanent directory (the default is `tempdir()`), simfinapi will be able to reuse this cache in subsequent R sessions.
## Code of Conduct
Please note that the ‘simfinapi’ project is released with a [Contributor Code of Conduct](https://github.com/matthiasgomolka/simfinapi/blob/master/.github/CODE_OF_CONDUCT.md). By contributing to this project, you agree to abide by its terms.