| •
| •
| •
| •
| •
| •
|\n", " •
| •
| •
| •
| •
| •
| •
|\n", "\n", "**An investor solves the following (asset allocation) problem: given X dollars and N assets find the best possible way of breaking X into N pieces.** By \"best possible\" we mean maximizing our returns subject to minimizing the risk of our initial investment. In other words, we aim to consistently grow X irrespective of the overall state of the market. In what follows, we explore provocative insights by [Ray Dalio](https://en.wikipedia.org/wiki/Ray_Dalio) and others on portfolio construction.\n", "\n", "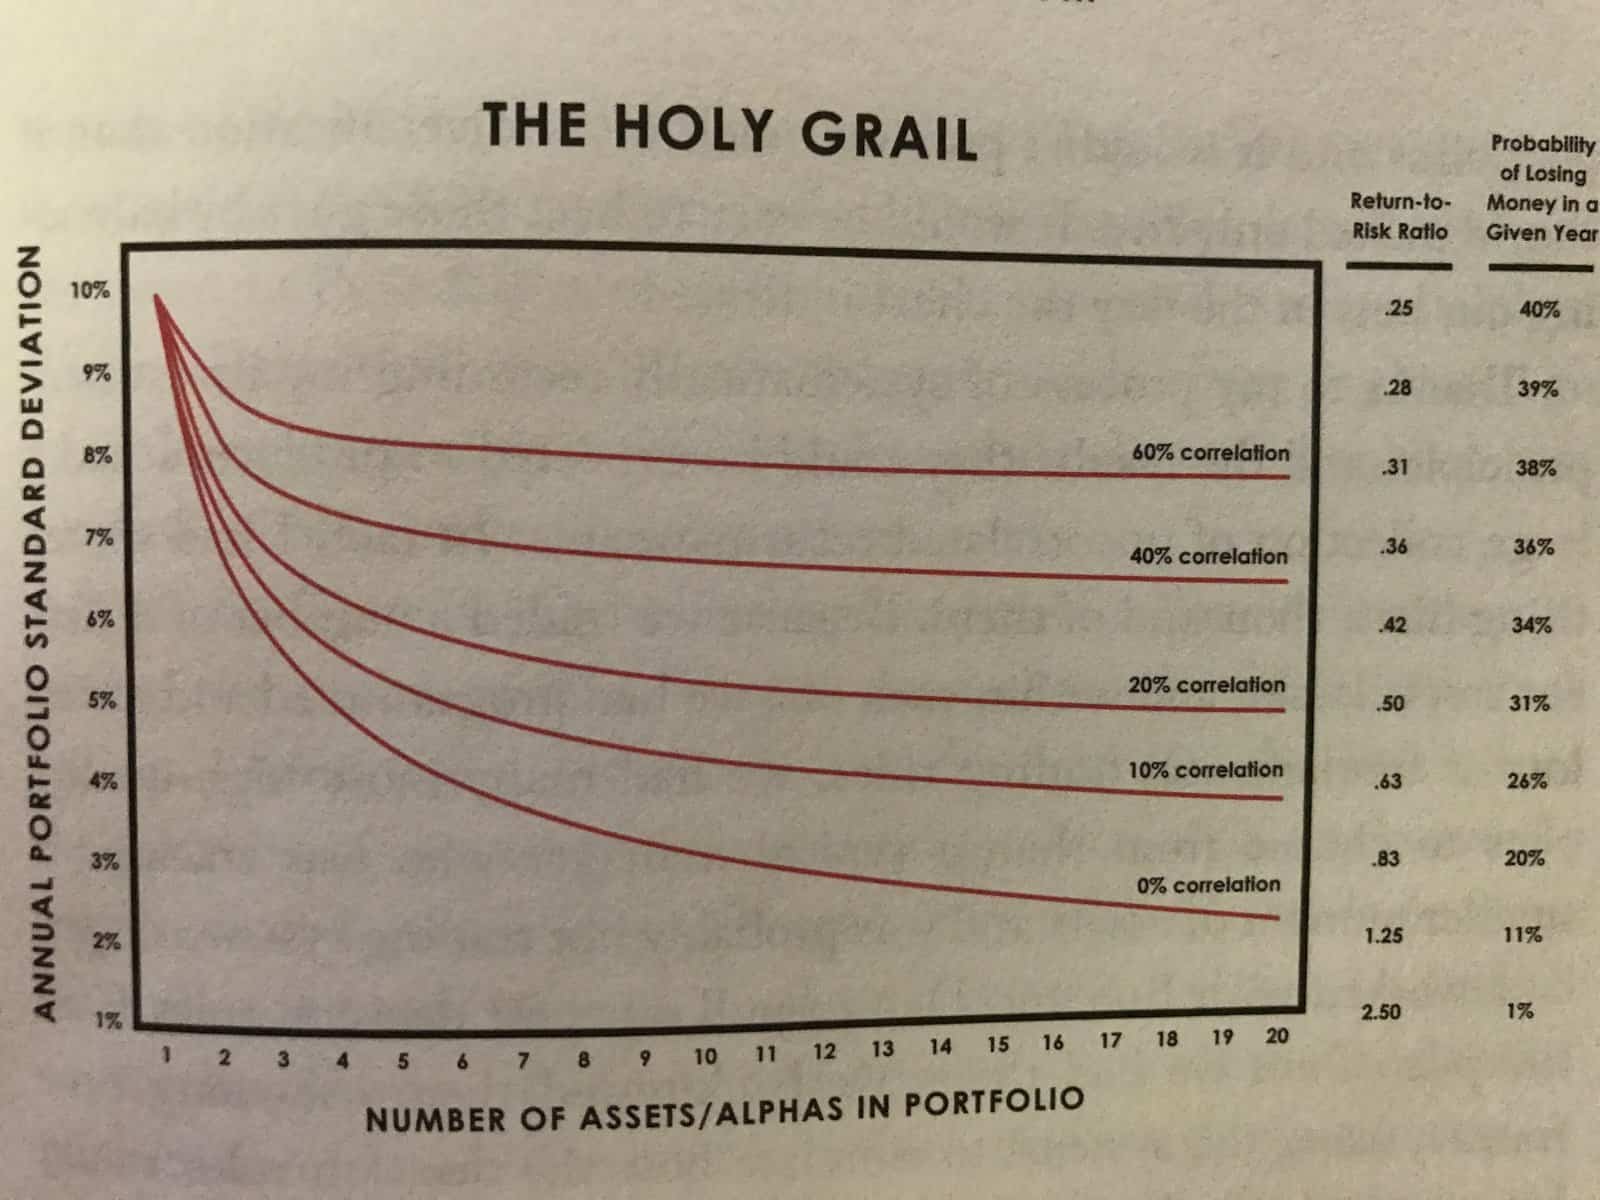\n", "Source: [Principles by Ray Dalio (Summary)](https://static1.squarespace.com/static/56f1d1777da24fd2594c0f51/t/5a35b71e652dea7bc2f59ef6/1513469734986/You+Exec+-+Principles+by+Ray+Dalio.pdf)\n", "\n", "The above chart depicts the behaviour of a portfolio with increasing diversification. Along the x-axis is the number of asset types. Along the y-axis is how \"spread out\" the annual returns are. A lower annual standard deviation indicates smaller fluctuations in each revenue stream, and in turn a diminished risk exposure. The \"Holy Grail\" so to speak, is to (1) find the largest number of assets that are the **least** correlated and (2) allocate X dollars to those assets such that the probability of losing money any given year is minimized. The underlying principle is this: the portfolio most robust against large market fluctuations and economic downturns is a portfolio with assets that are the **most independent** of eachother.\n", "\n", "# Exploratory Data Analysis and Cleaning\n", "\n", "Before we dive into the meat of our asset allocation model, we first explore, clean, and preprocess our historical price data for time-series analyses. In this section we complete the following.\n", "\n", "- Observe how many rows and columns are in our dataset and what they mean.\n", "- Observe the datatypes of the columns and update them if needed.\n", "- Take note of how the data is structured and what preprocessing will be necessary for time-series analyses.\n", "- Deal with any missing data accordingly.\n", "- Rename the stock tickers to the company names for readability." ] }, { "cell_type": "code", "execution_count": 1, "metadata": { "scrolled": true }, "outputs": [ { "data": { "text/html": [ "
| \n", " | Date | \n", "Open | \n", "High | \n", "Low | \n", "Close | \n", "Volume | \n", "Name | \n", "
|---|---|---|---|---|---|---|---|
| 0 | \n", "2006-01-03 | \n", "77.76 | \n", "79.35 | \n", "77.24 | \n", "79.11 | \n", "3117200 | \n", "MMM | \n", "
| 1 | \n", "2006-01-04 | \n", "79.49 | \n", "79.49 | \n", "78.25 | \n", "78.71 | \n", "2558000 | \n", "MMM | \n", "
| 2 | \n", "2006-01-05 | \n", "78.41 | \n", "78.65 | \n", "77.56 | \n", "77.99 | \n", "2529500 | \n", "MMM | \n", "
| 3 | \n", "2006-01-06 | \n", "78.64 | \n", "78.90 | \n", "77.64 | \n", "78.63 | \n", "2479500 | \n", "MMM | \n", "
| 4 | \n", "2006-01-09 | \n", "78.50 | \n", "79.83 | \n", "78.46 | \n", "79.02 | \n", "1845600 | \n", "MMM | \n", "
| \n", " | Date | \n", "Open | \n", "High | \n", "Low | \n", "Close | \n", "Volume | \n", "Name | \n", "
|---|---|---|---|---|---|---|---|
| 93607 | \n", "2017-12-22 | \n", "71.42 | \n", "71.87 | \n", "71.22 | \n", "71.58 | \n", "10979165 | \n", "AABA | \n", "
| 93608 | \n", "2017-12-26 | \n", "70.94 | \n", "71.39 | \n", "69.63 | \n", "69.86 | \n", "8542802 | \n", "AABA | \n", "
| 93609 | \n", "2017-12-27 | \n", "69.77 | \n", "70.49 | \n", "69.69 | \n", "70.06 | \n", "6345124 | \n", "AABA | \n", "
| 93610 | \n", "2017-12-28 | \n", "70.12 | \n", "70.32 | \n", "69.51 | \n", "69.82 | \n", "7556877 | \n", "AABA | \n", "
| 93611 | \n", "2017-12-29 | \n", "69.79 | \n", "70.13 | \n", "69.43 | \n", "69.85 | \n", "6613070 | \n", "AABA | \n", "
| \n", " | Open | \n", "High | \n", "Low | \n", "Close | \n", "Volume | \n", "Name | \n", "
|---|---|---|---|---|---|---|
| Date | \n", "\n", " | \n", " | \n", " | \n", " | \n", " | \n", " |
| 2014-12-24 | \n", "50.19 | \n", "50.92 | \n", "50.19 | \n", "50.65 | \n", "5962870 | \n", "Altaba | \n", "
| 2014-12-26 | \n", "50.65 | \n", "51.06 | \n", "50.61 | \n", "50.86 | \n", "5170048 | \n", "Altaba | \n", "
| 2014-12-29 | \n", "50.67 | \n", "51.01 | \n", "50.51 | \n", "50.53 | \n", "6624489 | \n", "Altaba | \n", "
| 2014-12-30 | \n", "50.35 | \n", "51.27 | \n", "50.35 | \n", "51.22 | \n", "10703455 | \n", "Altaba | \n", "
| 2014-12-31 | \n", "51.54 | \n", "51.68 | \n", "50.46 | \n", "50.51 | \n", "9305013 | \n", "Altaba | \n", "
| \n", " | Open | \n", "High | \n", "Low | \n", "Close | \n", "Volume | \n", "Name | \n", "
|---|---|---|---|---|---|---|
| Date | \n", "\n", " | \n", " | \n", " | \n", " | \n", " | \n", " |
| 2017-12-22 | \n", "71.42 | \n", "71.87 | \n", "71.22 | \n", "71.58 | \n", "10979165 | \n", "Altaba | \n", "
| 2017-12-26 | \n", "70.94 | \n", "71.39 | \n", "69.63 | \n", "69.86 | \n", "8542802 | \n", "Altaba | \n", "
| 2017-12-27 | \n", "69.77 | \n", "70.49 | \n", "69.69 | \n", "70.06 | \n", "6345124 | \n", "Altaba | \n", "
| 2017-12-28 | \n", "70.12 | \n", "70.32 | \n", "69.51 | \n", "69.82 | \n", "7556877 | \n", "Altaba | \n", "
| 2017-12-29 | \n", "69.79 | \n", "70.13 | \n", "69.43 | \n", "69.85 | \n", "6613070 | \n", "Altaba | \n", "
| Name | \n", "3M | \n", "Altaba | \n", "Amazon | \n", "American Express | \n", "Apple | \n", "Boeing | \n", "Caterpillar | \n", "Chevron | \n", "Cisco Systems | \n", "Coca-Cola | \n", "... | \n", "Microsoft | \n", "Nike | \n", "Pfizer | \n", "Procter & Gamble | \n", "Travelers | \n", "United Technologies | \n", "UnitedHealth | \n", "Verizon | \n", "Walmart | \n", "Walt Disney | \n", "
|---|---|---|---|---|---|---|---|---|---|---|---|---|---|---|---|---|---|---|---|---|---|
| Date | \n", "\n", " | \n", " | \n", " | \n", " | \n", " | \n", " | \n", " | \n", " | \n", " | \n", " | \n", " | \n", " | \n", " | \n", " | \n", " | \n", " | \n", " | \n", " | \n", " | \n", " | \n", " |
| 2015-01-02 | \n", "164.06 | \n", "50.17 | \n", "308.52 | \n", "93.02 | \n", "109.33 | \n", "129.95 | \n", "91.88 | \n", "112.58 | \n", "27.61 | \n", "42.14 | \n", "... | \n", "46.76 | \n", "47.52 | \n", "31.33 | \n", "90.44 | \n", "105.44 | \n", "115.04 | \n", "100.78 | \n", "46.96 | \n", "85.90 | \n", "93.75 | \n", "
| 2015-01-05 | \n", "160.36 | \n", "49.13 | \n", "302.19 | \n", "90.56 | \n", "106.25 | \n", "129.05 | \n", "87.03 | \n", "108.08 | \n", "27.06 | \n", "42.14 | \n", "... | \n", "46.32 | \n", "46.75 | \n", "31.16 | \n", "90.01 | \n", "104.17 | \n", "113.12 | \n", "99.12 | \n", "46.57 | \n", "85.65 | \n", "92.38 | \n", "
| 2015-01-06 | \n", "158.65 | \n", "49.21 | \n", "295.29 | \n", "88.63 | \n", "106.26 | \n", "127.53 | \n", "86.47 | \n", "108.03 | \n", "27.05 | \n", "42.46 | \n", "... | \n", "45.65 | \n", "46.48 | \n", "31.42 | \n", "89.60 | \n", "103.24 | \n", "111.52 | \n", "98.92 | \n", "47.04 | \n", "86.31 | \n", "91.89 | \n", "
| 2015-01-07 | \n", "159.80 | \n", "48.59 | \n", "298.42 | \n", "90.30 | \n", "107.75 | \n", "129.51 | \n", "87.81 | \n", "107.94 | \n", "27.30 | \n", "42.99 | \n", "... | \n", "46.23 | \n", "47.44 | \n", "31.85 | \n", "90.07 | \n", "105.00 | \n", "112.73 | \n", "99.93 | \n", "46.19 | \n", "88.60 | \n", "92.83 | \n", "
| 2015-01-08 | \n", "163.63 | \n", "50.23 | \n", "300.46 | \n", "91.58 | \n", "111.89 | \n", "131.80 | \n", "88.71 | \n", "110.41 | \n", "27.51 | \n", "43.51 | \n", "... | \n", "47.59 | \n", "48.53 | \n", "32.50 | \n", "91.10 | \n", "107.18 | \n", "114.65 | \n", "104.70 | \n", "47.18 | \n", "90.47 | \n", "93.79 | \n", "
5 rows × 31 columns
\n", "| \n", " | Open | \n", "High | \n", "Low | \n", "Close | \n", "Volume | \n", "Name | \n", "Close_Diff | \n", "
|---|---|---|---|---|---|---|---|
| Date | \n", "\n", " | \n", " | \n", " | \n", " | \n", " | \n", " | \n", " |
| 2006-01-03 | \n", "77.76 | \n", "79.35 | \n", "77.24 | \n", "79.11 | \n", "3117200 | \n", "3M | \n", "1.35 | \n", "
| 2006-01-04 | \n", "79.49 | \n", "79.49 | \n", "78.25 | \n", "78.71 | \n", "2558000 | \n", "3M | \n", "-0.78 | \n", "
| 2006-01-05 | \n", "78.41 | \n", "78.65 | \n", "77.56 | \n", "77.99 | \n", "2529500 | \n", "3M | \n", "-0.42 | \n", "
| 2006-01-06 | \n", "78.64 | \n", "78.90 | \n", "77.64 | \n", "78.63 | \n", "2479500 | \n", "3M | \n", "-0.01 | \n", "
| 2006-01-09 | \n", "78.50 | \n", "79.83 | \n", "78.46 | \n", "79.02 | \n", "1845600 | \n", "3M | \n", "0.52 | \n", "
| Name | \n", "3M | \n", "Altaba | \n", "Amazon | \n", "American Express | \n", "Apple | \n", "Boeing | \n", "Caterpillar | \n", "Chevron | \n", "Cisco Systems | \n", "Coca-Cola | \n", "... | \n", "Microsoft | \n", "Nike | \n", "Pfizer | \n", "Procter & Gamble | \n", "Travelers | \n", "United Technologies | \n", "UnitedHealth | \n", "Verizon | \n", "Walmart | \n", "Walt Disney | \n", "
|---|---|---|---|---|---|---|---|---|---|---|---|---|---|---|---|---|---|---|---|---|---|
| Date | \n", "\n", " | \n", " | \n", " | \n", " | \n", " | \n", " | \n", " | \n", " | \n", " | \n", " | \n", " | \n", " | \n", " | \n", " | \n", " | \n", " | \n", " | \n", " | \n", " | \n", " | \n", " |
| 2006-01-03 | \n", "79.11 | \n", "40.91 | \n", "47.58 | \n", "52.58 | \n", "10.68 | \n", "70.44 | \n", "57.80 | \n", "59.08 | \n", "17.45 | \n", "20.45 | \n", "... | \n", "26.84 | \n", "10.74 | \n", "23.78 | \n", "58.78 | \n", "45.99 | \n", "56.53 | \n", "61.73 | \n", "30.38 | \n", "46.23 | \n", "24.40 | \n", "
| 2006-01-04 | \n", "78.71 | \n", "40.97 | \n", "47.25 | \n", "51.95 | \n", "10.71 | \n", "71.17 | \n", "59.27 | \n", "58.91 | \n", "17.85 | \n", "20.41 | \n", "... | \n", "26.97 | \n", "10.69 | \n", "24.55 | \n", "58.89 | \n", "46.50 | \n", "56.19 | \n", "61.88 | \n", "31.27 | \n", "46.32 | \n", "23.99 | \n", "
| 2006-01-05 | \n", "77.99 | \n", "41.53 | \n", "47.65 | \n", "52.50 | \n", "10.63 | \n", "70.33 | \n", "59.27 | \n", "58.19 | \n", "18.35 | \n", "20.51 | \n", "... | \n", "26.99 | \n", "10.76 | \n", "24.58 | \n", "58.70 | \n", "46.95 | \n", "55.98 | \n", "61.69 | \n", "31.63 | \n", "45.69 | \n", "24.41 | \n", "
| 2006-01-06 | \n", "78.63 | \n", "43.21 | \n", "47.87 | \n", "52.68 | \n", "10.90 | \n", "69.35 | \n", "60.45 | \n", "59.25 | \n", "18.77 | \n", "20.70 | \n", "... | \n", "26.91 | \n", "10.72 | \n", "24.85 | \n", "58.64 | \n", "47.21 | \n", "56.16 | \n", "62.90 | \n", "31.35 | \n", "45.88 | \n", "24.74 | \n", "
| 2006-01-09 | \n", "79.02 | \n", "43.42 | \n", "47.08 | \n", "53.99 | \n", "10.86 | \n", "68.77 | \n", "61.55 | \n", "58.95 | \n", "19.06 | \n", "20.80 | \n", "... | \n", "26.86 | \n", "10.88 | \n", "24.85 | \n", "59.08 | \n", "47.23 | \n", "56.80 | \n", "61.40 | \n", "31.48 | \n", "45.71 | \n", "25.00 | \n", "
5 rows × 31 columns
\n", "| Name | \n", "3M | \n", "Altaba | \n", "Amazon | \n", "American Express | \n", "Apple | \n", "Boeing | \n", "Caterpillar | \n", "Chevron | \n", "Cisco Systems | \n", "Coca-Cola | \n", "... | \n", "Microsoft | \n", "Nike | \n", "Pfizer | \n", "Procter & Gamble | \n", "Travelers | \n", "United Technologies | \n", "UnitedHealth | \n", "Verizon | \n", "Walmart | \n", "Walt Disney | \n", "
|---|---|---|---|---|---|---|---|---|---|---|---|---|---|---|---|---|---|---|---|---|---|
| Date | \n", "\n", " | \n", " | \n", " | \n", " | \n", " | \n", " | \n", " | \n", " | \n", " | \n", " | \n", " | \n", " | \n", " | \n", " | \n", " | \n", " | \n", " | \n", " | \n", " | \n", " | \n", " |
| 2006-01-03 | \n", "NaN | \n", "NaN | \n", "NaN | \n", "NaN | \n", "NaN | \n", "NaN | \n", "NaN | \n", "NaN | \n", "NaN | \n", "NaN | \n", "... | \n", "NaN | \n", "NaN | \n", "NaN | \n", "NaN | \n", "NaN | \n", "NaN | \n", "NaN | \n", "NaN | \n", "NaN | \n", "NaN | \n", "
| 2006-01-04 | \n", "-0.40 | \n", "0.06 | \n", "-0.33 | \n", "-0.63 | \n", "0.03 | \n", "0.73 | \n", "1.47 | \n", "-0.17 | \n", "0.40 | \n", "-0.04 | \n", "... | \n", "0.13 | \n", "-0.05 | \n", "0.77 | \n", "0.11 | \n", "0.51 | \n", "-0.34 | \n", "0.15 | \n", "0.89 | \n", "0.09 | \n", "-0.41 | \n", "
| 2006-01-05 | \n", "-0.72 | \n", "0.56 | \n", "0.40 | \n", "0.55 | \n", "-0.08 | \n", "-0.84 | \n", "0.00 | \n", "-0.72 | \n", "0.50 | \n", "0.10 | \n", "... | \n", "0.02 | \n", "0.07 | \n", "0.03 | \n", "-0.19 | \n", "0.45 | \n", "-0.21 | \n", "-0.19 | \n", "0.36 | \n", "-0.63 | \n", "0.42 | \n", "
| 2006-01-06 | \n", "0.64 | \n", "1.68 | \n", "0.22 | \n", "0.18 | \n", "0.27 | \n", "-0.98 | \n", "1.18 | \n", "1.06 | \n", "0.42 | \n", "0.19 | \n", "... | \n", "-0.08 | \n", "-0.04 | \n", "0.27 | \n", "-0.06 | \n", "0.26 | \n", "0.18 | \n", "1.21 | \n", "-0.28 | \n", "0.19 | \n", "0.33 | \n", "
| 2006-01-09 | \n", "0.39 | \n", "0.21 | \n", "-0.79 | \n", "1.31 | \n", "-0.04 | \n", "-0.58 | \n", "1.10 | \n", "-0.30 | \n", "0.29 | \n", "0.10 | \n", "... | \n", "-0.05 | \n", "0.16 | \n", "0.00 | \n", "0.44 | \n", "0.02 | \n", "0.64 | \n", "-1.50 | \n", "0.13 | \n", "-0.17 | \n", "0.26 | \n", "
5 rows × 31 columns
\n", "| \n", " | 3M | \n", "Altaba | \n", "Amazon | \n", "American Express | \n", "Apple | \n", "Boeing | \n", "Caterpillar | \n", "Chevron | \n", "Cisco Systems | \n", "Coca-Cola | \n", "... | \n", "Microsoft | \n", "Nike | \n", "Pfizer | \n", "Procter & Gamble | \n", "Travelers | \n", "United Technologies | \n", "UnitedHealth | \n", "Verizon | \n", "Walmart | \n", "Walt Disney | \n", "
|---|---|---|---|---|---|---|---|---|---|---|---|---|---|---|---|---|---|---|---|---|---|
| 3M | \n", "1 | \n", "0.353645 | \n", "0.39234 | \n", "0.537989 | \n", "0.349158 | \n", "0.499624 | \n", "0.548548 | \n", "0.504802 | \n", "0.470029 | \n", "0.431732 | \n", "... | \n", "0.455552 | \n", "0.450839 | \n", "0.414834 | \n", "0.401242 | \n", "0.470891 | \n", "0.613992 | \n", "0.359024 | \n", "0.396697 | \n", "0.357485 | \n", "0.535781 | \n", "
| Altaba | \n", "0.353645 | \n", "1 | \n", "0.351135 | \n", "0.341589 | \n", "0.290445 | \n", "0.312507 | \n", "0.315713 | \n", "0.267452 | \n", "0.343121 | \n", "0.246817 | \n", "... | \n", "0.302109 | \n", "0.31163 | \n", "0.24649 | \n", "0.218293 | \n", "0.269813 | \n", "0.337054 | \n", "0.211276 | \n", "0.218758 | \n", "0.209349 | \n", "0.37071 | \n", "
| Amazon | \n", "0.39234 | \n", "0.351135 | \n", "1 | \n", "0.387674 | \n", "0.373537 | \n", "0.349593 | \n", "0.383719 | \n", "0.31787 | \n", "0.35512 | \n", "0.277101 | \n", "... | \n", "0.340249 | \n", "0.3993 | \n", "0.274551 | \n", "0.220758 | \n", "0.296325 | \n", "0.402777 | \n", "0.244168 | \n", "0.265955 | \n", "0.254739 | \n", "0.402439 | \n", "
| American Express | \n", "0.537989 | \n", "0.341589 | \n", "0.387674 | \n", "1 | \n", "0.351312 | \n", "0.468953 | \n", "0.472919 | \n", "0.423415 | \n", "0.455908 | \n", "0.383586 | \n", "... | \n", "0.441841 | \n", "0.450744 | \n", "0.421407 | \n", "0.354739 | \n", "0.476044 | \n", "0.535638 | \n", "0.328788 | \n", "0.393664 | \n", "0.373938 | \n", "0.505921 | \n", "
| Apple | \n", "0.349158 | \n", "0.290445 | \n", "0.373537 | \n", "0.351312 | \n", "1 | \n", "0.296182 | \n", "0.388631 | \n", "0.303327 | \n", "0.331026 | \n", "0.235683 | \n", "... | \n", "0.316923 | \n", "0.317469 | \n", "0.224457 | \n", "0.199562 | \n", "0.265335 | \n", "0.343254 | \n", "0.227484 | \n", "0.229273 | \n", "0.191001 | \n", "0.346844 | \n", "
5 rows × 31 columns
\n", "| \n", " | Buy In: 2014-12-31 | \n", "
|---|---|
| Name | \n", "\n", " |
| Amazon | \n", "310.35 | \n", "
| UnitedHealth | \n", "101.09 | \n", "
| Verizon | \n", "46.78 | \n", "
| Mcdonald's | \n", "93.70 | \n", "
| \n", " | Hedgecraft Returns | \n", "Hedgecraft MIS Returns | \n", "Efficient Frontier Returns | \n", "Dow Return Rates | \n", "S&P500 Return Rates | \n", "Hedgecraft Return Rates | \n", "Hedgecraft MIS Return Rates | \n", "Efficient Frontier Return Rates | \n", "
|---|---|---|---|---|---|---|---|---|
| 2015 | \n", "9.8% | \n", "19.3% | \n", "-1.8% | \n", "0.1% | \n", "-0.73% | \n", "9.8% | \n", "19.3% | \n", "-1.8% | \n", "
| 2016 | \n", "35.5% | \n", "58.9% | \n", "5.5% | \n", "16.28% | \n", "9.54% | \n", "25.7% | \n", "39.6% | \n", "7.3% | \n", "
| 2017 | \n", "85.4% | \n", "119.1% | \n", "30.5% | \n", "27.97% | \n", "19.42% | \n", "49.9% | \n", "60.2% | \n", "25.0% | \n", "
| \n", " | Hedgecraft | \n", "Hedgecraft MIS | \n", "Efficient Frontier | \n", "
|---|---|---|---|
| Avg Annual Rate of Returns | \n", "27.42% | \n", "38.7% | \n", "9.62% | \n", "
| Annual Volatility | \n", "14.58% | \n", "18.85% | \n", "16.36% | \n", "
| Maximum Drawdown | \n", "-12.29% | \n", "-12.22% | \n", "-20.32% | \n", "
| Annualized Sharpe Ratio | \n", "1.74 | \n", "1.95 | \n", "0.47 | \n", "
| Returns Over Maximum Drawdown | \n", "6.95 | \n", "9.75 | \n", "1.5 | \n", "
| Growth-Risk Ratio | \n", "3.33 | \n", "4.32 | \n", "0.69 | \n", "
| \n", " | Hedgecraft | \n", "Hedgecraft MIS | \n", "Efficient Frontier | \n", "
|---|---|---|---|
| probability of losing money from initial investement | \n", "1.59% | \n", "0.53% | \n", "33.77% | \n", "
| maximum loss | \n", "-2.39% | \n", "-2.13% | \n", "-15.99% | \n", "
| mean loss | \n", "-0.77% | \n", "-1.39% | \n", "-4.17% | \n", "
| Probability of falling bellow 30 day rolling avg | \n", "21.32% | \n", "25.17% | \n", "38.41% | \n", "
| Probability of falling bellow 50 day rolling avg | \n", "16.56% | \n", "19.07% | \n", "38.01% | \n", "
| Probability of falling bellow 90 day rolling avg | \n", "11.79% | \n", "15.5% | \n", "35.1% | \n", "