 #
 [Gigapipe: All-In-One Polyglot Observability](https://gigapipe.com)
> formerly known as _qryn_

 [](https://github.com/metrico/gigapipe/actions/workflows/build_release.yml)


:rocket: Gigapipe is a _lighweight, multi-standard, polyglot **observability** stack for **Logs, Metrics**, **Traces** and **Profiling**_
* **Polyglot**: All-in-one, drop-in compatible with **Loki**, **Prometheus**, **Tempo**, **Pyroscope**
* **Familiar**: Use stable & popular **LogQL**, **PromQL**, **TempoQL** languages to _query and visualize data_
* **Voracious**: Ingest using **OpenTelemetry, Loki, Prometheus, Tempo, Influx, Datadog, Elastic** _+ more_
* **Versatile**: Explore data with gigapipe's **built-in Explorer** and CLI or native **Grafana** datasource compatibility
* **Secure**: Retain total control of data, using **ClickHouse**, **DuckDB** or **GigAPI** with **S3** object storage
* **Independent**: Open source, community powered, anti lock-in alternative to vendor controlled stacks
# 🚀 Get Started
* Setup & Deploy **gigapipe** _opensource_ and get help in our [Matrix room](https://matrix.to/#/#qryn:matrix.org) :octocat:
* Looking for a quick test before installing? Signup for a free trial at [gigapipe.com](https://gigapipe.com)
## 📚 Documentation
- [Configuration & Docker](docs/configuration.md) — environment variables, Docker quickstart, cross-cluster setup
- [Table Ordering](docs/table-ordering.md) — ClickHouse sort keys, `ADVANCED_SAMPLES_ORDERING`, changing the ordering of an existing deployment
- [Profiling API](docs/profiling-api.md) — profiling endpoints, DOT format export, Graphviz visualization
- [OTLP Profiles Ingestion](docs/otlp-profiles.md) — OpenTelemetry profiles signal ingestion via `/v1development/profiles`
- [OTLP Metrics Ingestion](docs/otlp-metrics.md) — OpenTelemetry metrics signal ingestion via `/v1/metrics` (protobuf + JSON)
- [OTLP over gRPC](docs/otlp-grpc.md) — OTLP/gRPC receiver for traces, logs, metrics, and profiles
- [Contributing](docs/contributing.md) — development setup, testing, CLA requirement
- [Full Documentation](https://gigapipe.com/docs/oss) — hosted docs at gigapipe.com
- [](https://deepwiki.com/metrico/gigapipe)
## Features
💡 _**gigapipe** independently implements popular observability standards, protocols and query languages_
## ➡️ Ingestion
### 📚 OpenTelemetry
⚡ **gigapipe** is officially integrated with [OpenTelemetry](https://github.com/metrico/otel-collector) supports _any log, trace or metric format_
Ingested data can be queried using any of the available gigapipe APIs _(LogQL, PromQL, TraceQL)_
> 💡 _No modifications required to your OpenTelemetry instrumentation!_
### 📚 Native APIs
**gigapipe** supports [native ingestion](https://gigapipe.com/docs/api) for Loki, Prometheus, Tempo/Zipkin, Pyroscope and _[many other protocols](https://gigapipe.com/docs/api)_
With gigapipe integrators can _push and read data using any desired combination of APIs and formats_
> 💡 _No opentelemetry or any other middlewayre/proxy required!_
## ⬅️ Query
### 📚 Loki + LogQL
> Any Loki compatible client or application can be used with gigapipe out of the box
⚡ **gigapipe** implements the *Loki API* for transparent compatibility with **[LogQL](https://grafana.com/docs/loki/latest/query/)** clients
The Grafana Loki datasource can be used to natively browse and query _logs_ and display extracted _timeseries_
 > :tada: _No plugins needed_
> :eye: _No Grafana? No problem! Use View_
#### Index Stats & Enhanced Tail
**Index statistics**: Query stream metadata using `/loki/api/v1/index/stats` to retrieve stream count, entry count, byte volume, and chunk count. Supports LogQL stream selectors for filtering:
```
GET /loki/api/v1/index/stats?query={job="app"}&start=&end=
```
**Enhanced live-tail**: The Tail service now supports `limit` and `start` query parameters for controlling tail behavior. The `limit` parameter caps the number of entries returned, and `start` sets the starting timestamp (in nanoseconds). WebSocket responses include a `dropped_entries` field indicating when entries were dropped due to backpressure:
```json
{
"streams": [...],
"dropped_entries": []
}
```
### 📈 Prometheus + PromQL
> Any Prometheus compatible client or application can be used with gigapipe out of the box
⚡ **gigapipe** implements the *Prometheus API* for transparent **[PromQL](https://prometheus.io/docs/prometheus/latest/querying/basics/)** compatibility using WASM 🏆
The Grafana Prometheus datasource can be used to natively to query _metrics_ and display _timeseries_
 > :tada: _No plugins needed_
> :eye: _No Grafana? No problem! Use View_
### 🕛 Tempo + TraceQL
⚡ **gigapipe** implements the **Tempo API** for transparent compatibility with **[TraceQL](https://grafana.com/docs/tempo/latest/traceql/)** clients.
> Any Tempo/OpenTelemetry compatible client or application can be used with gigapipe out of the box
The Tempo datasource can be used to natively query _traces_ including _**TraceQL**_ and supporting _service graphs_
 > :tada: _No plugins needed_
> :eye: _No Grafana? No problem! Use View_
#### TraceQL Metrics
**gigapipe** supports TraceQL metrics endpoints for calculating metrics from trace data. Calculate error rates, latency distributions, and throughput directly from traces using TraceQL queries.
**Metrics endpoints**:
- `/api/metrics/query_range` - range queries over a time window
- `/api/metrics/query` - instant queries at a specific time
**Parameters**:
- `q` or `query` - TraceQL query string (required)
- `start` - start timestamp (unix seconds, nanoseconds, or RFC3339)
- `end` - end timestamp (same format as start)
- `since` - relative time duration (e.g., "1h", "30m") - alternative to start/end
- `step` - query resolution (e.g., "15s", "1m") - auto-calculated if not specified
**Example**:
```
GET /api/metrics/query_range?q={span.http.status_code=200}&since=1h&step=1m
```
This query calculates span counts for successful HTTP requests over the last hour with 1-minute resolution.
### 🔥 Pyroscope + Phlare
⚡ **gigapipe** implements the **Pyroscope API** for transparent compatibility with **Pyroscope SDK** clients.
> Any Pyroscope SDK client or Pyroscope compatible agent can be used with gigapipe out of the box for **continuous profiling**
 #### OTLP Profiles Ingestion
⚡ **gigapipe** also ingests the **OpenTelemetry profiles signal** (`profiles/v1development`) directly from OpenTelemetry collectors:
```
POST /v1development/profiles Content-Type: application/x-protobuf
```
> 💡 _No collector code changes required — point an `otlphttp` exporter at gigapipe and profiles flow in._
OTLP profiles land in the same ClickHouse `profiles` tables as Pyroscope data and are queryable through the existing Pyroscope-compatible API (flamegraph, series, stacktraces). See [docs/otlp-profiles.md](docs/otlp-profiles.md) for details.
#### DOT Graph Rendering
The Render endpoint (`/render?format=dot`) generates Graphviz DOT format graphs for profiling visualization with enhanced readability:
**Features**:
- **`maxNodes` parameter**: Limit the number of nodes displayed in DOT graphs (0 = unlimited). Use this to control graph complexity for large profiles.
```
GET /render?query=...&from=...&until=...&format=dot&maxNodes=50
```
- **Human-readable values**: Automatically formats values based on unit type (e.g., "1.23s" for durations, "1.23 MB" for memory)
- **Variable font sizes**: Node font size scales from 8pt to 24pt based on self-sample percentage, creating visual hierarchy where hotter code paths are more prominent
### :eye: Built-In Explorer
**gigapipe** ships with **view** - our zero dependency, lightweight data explorer for **Logs, Metrics** and **Traces**

### 📚 Vendors Compatibility
**gigapipe** can ingest data using formats from [Grafana, InfluxDB, DataDog, Elastic](https://gigapipe.com/docs) and other vendors.
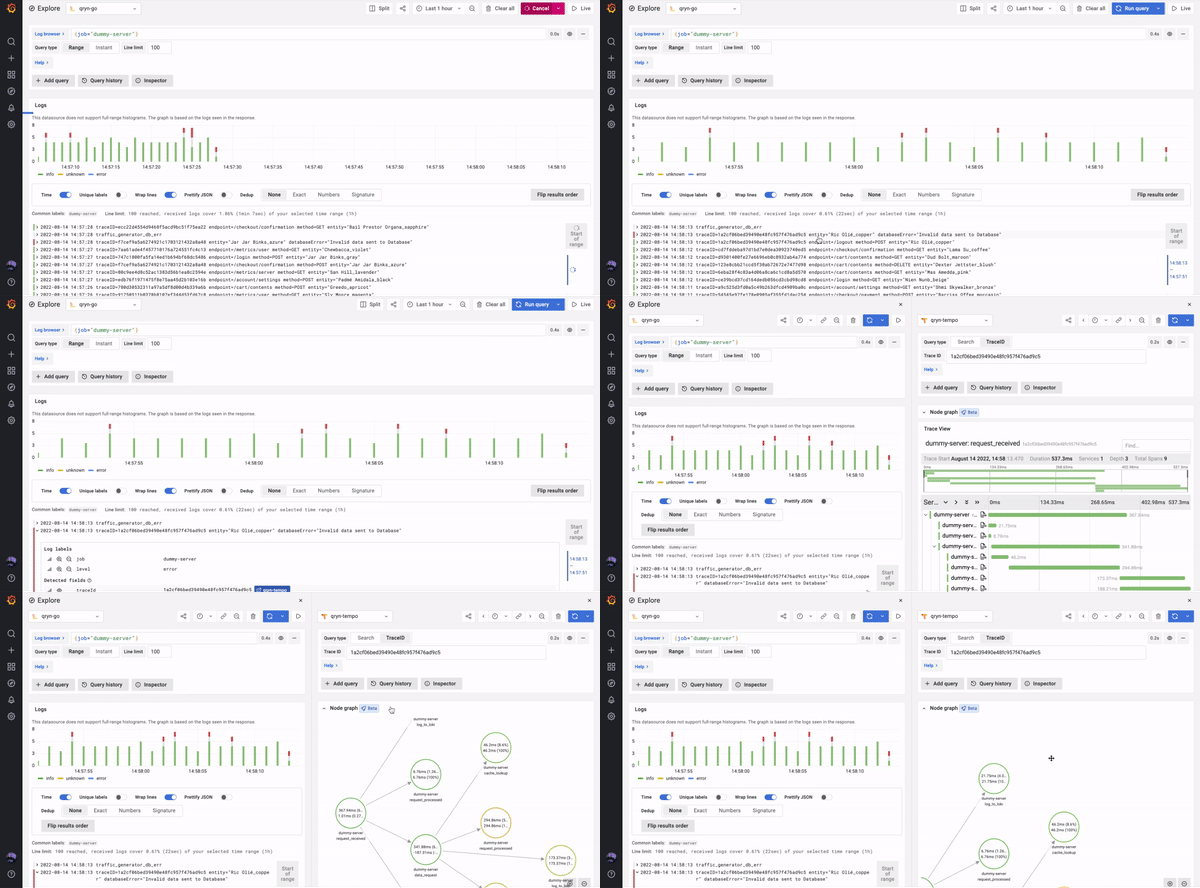
With **gigapipe** and **Grafana** everything _just works_ right out of the box:
- Native datasource support without any plugin or extension
- Advanced Correlation between Logs, Metrics and Traces
- Service Graphs and Service Status Panels, and all the cool features
------------
📚 Follow our team _behind the scenes_ on the [gigapipe blog](https://blog.gigapipe.com)
------------
#### Contributions
Whether it's code, documentation or grammar, we ❤️ all contributions. See [docs/contributing.md](docs/contributing.md) to get started.
- Join our [Matrix Channel](https://matrix.to/#/#qryn:matrix.org), and ask us any questions.
- Have a PR or idea? Request a session / code walkthrough with our team for guidance.
#### Contributors
[](https://github.com/metrico/gigapipe/graphs/contributors)
[](https://github.com/metrico/gigapipe/stargazers)
[](https://github.com/metrico/gigapipe/network/members)
#### License
 ©️ HEPVEST BV, All Rights Reserves. Released under the GNU Affero General Public License v3.0
[^1]: Gigapipe is a 100% clear-room api implementation and does not fork, use or derivate from Grafana code or design concepts.[^1]
[^2]: Gigapipe is not affiliated or endorsed by Grafana Labs or ClickHouse Inc. All rights belong to their respective owners.[^2]
[^3]: Grafana®, Loki™ and Tempo® are a Trademark of Raintank, Grafana Labs. ClickHouse® is a trademark of ClickHouse Inc.[^3]
[^4]: Prometheus is a trademark of The Linux Foundation.[^4]