# UI components
!!! note alert alert-light "Key"
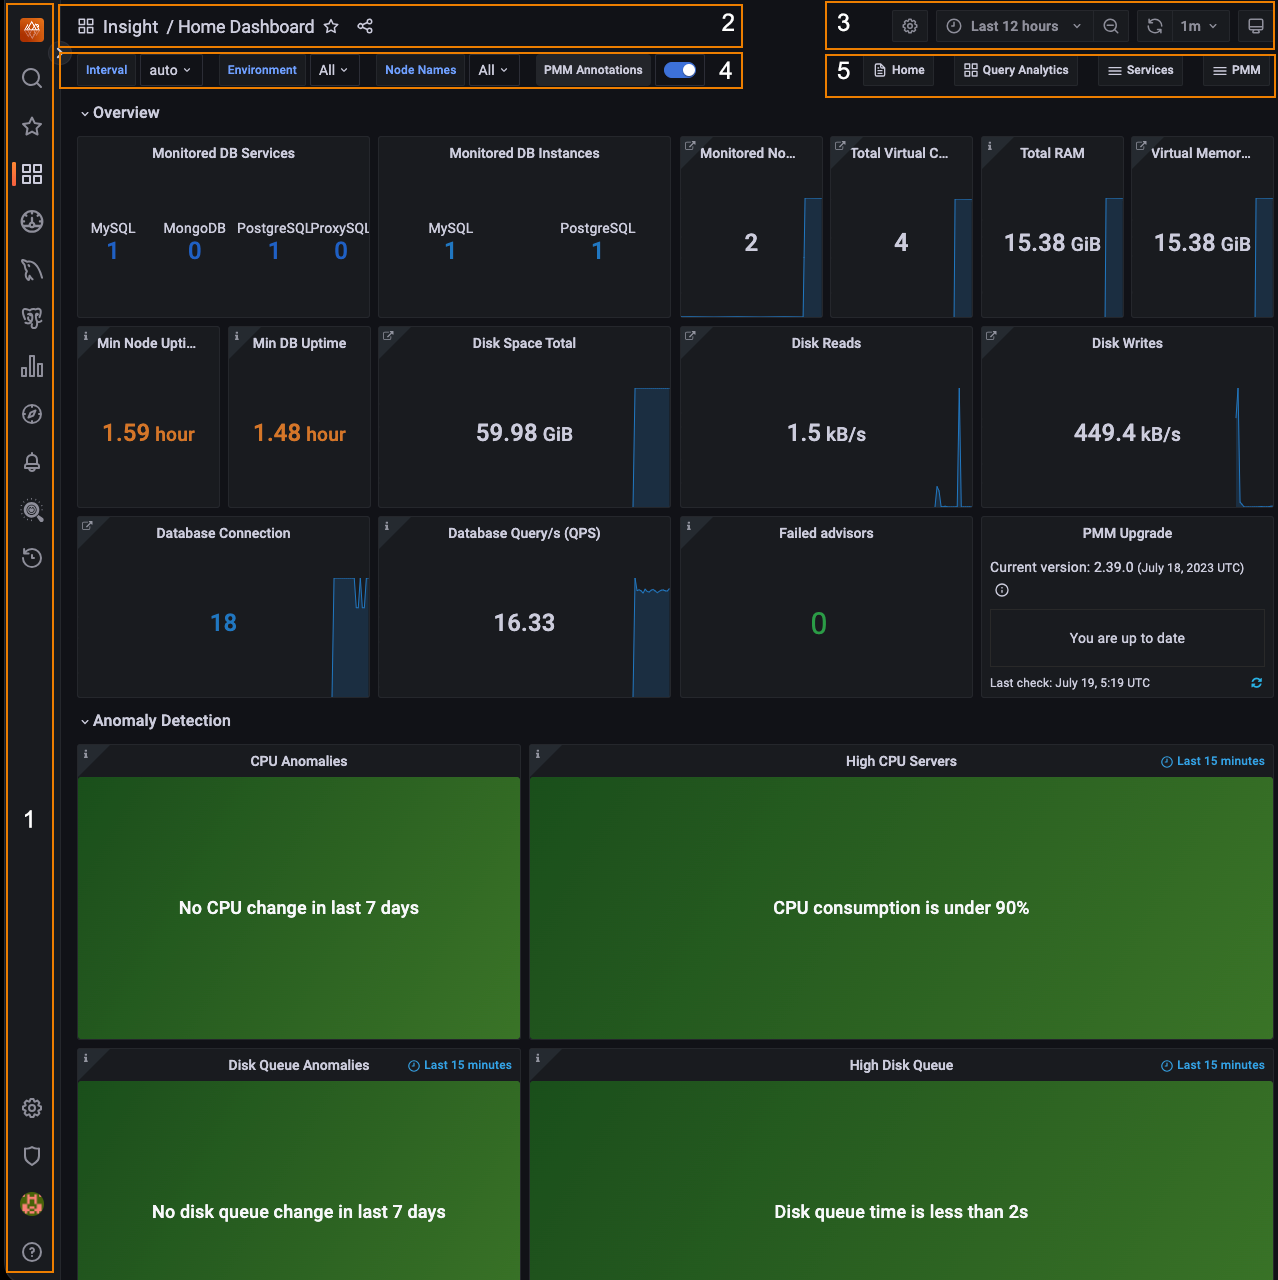
1. [Main menu](#main-menu) (also *Grafana menu*, *side menu*)
2. [Navigation bar](#navigation-bar)
3. [View controls](#view-controls)
4. [View selectors](#view-selectors) (dynamic contents)
5. [Shortcut menu](#shortcut-menu) (dynamic contents)
## Main menu
The main menu is part of the Grafana framework and is visible on every page.
| Item (Top) | Name | Description
|:----------------------------------:|----------------------|-------------------------------
|  | Home | Link to home dashboard.
| | Search | Search dashboards by name.
| | Starred | Mark your favorite dashboards.
| | Dashboards | Create dashboards or [folders][Folders], manage dashboards, import dashboards, create playlists, manage snapshots.
|  | Operating System (OS) | Operating System dashboard
|  | MySQL | MySQL dashboard
|  | MongoDB | MongoDB dashboard
|  | PostgreSQL | PostgreSQL dashboard
|  | ProxySQL | ProxySQL dashboard
|  | HAproxy | HAproxy dashboard
| | Query Analytics (QAN) | Query Analytics
| | Explore | Run queries with [PromQL].
| | Percona Alerting | [Alerting](../get-started/alerting.md), Create new alerts and manage your alert rules and alert templates.
| {{icon.configuration}} | Configuration |
|  | Entitlements |This tab is displayed after connecting PMM to Percona Portal, and shows all your Percona Platform account information.
|  | Support Tickets | Shows the list of tickets opened across your organization. This tab is only available after you connect PMM to Percona Platform.
|  | Environment Overview | This tab is displayed after connecting PMM to Percona Portal. Shows the name and email of the Customer Success Manager assigned to your organization, who can help with any PMM queries. This tab will soon be populated with more useful information about your PMM environment.
| | Server Admin |
| | Backup Management | [Backup management and storage location configuration][BACKUP].
| {{icon.checks}} | PMM Advisor Checks | Run health assessment checks against your connected databases and check any failed checks.
| | DBaaS |
!!! hint alert alert-success "Tip"
The DBaaS icon appears only if a server feature flag has been set.
The Backup Management icon appears when *Backup Management* is activated in {{icon.configuration}} *Configuration* → *Settings* → *Advanced Settings*.
| Icon (Bottom) | Description |
|:----------------------------------------:|-------------|
| (Profile icon) | User menu |
| | Help |
## Navigation bar

| Item (left) | Description
|-----------------------------------|-------------------------
| | (Display only.)
| (Name) / | (Optional) Folder name.
| (Name) | Dashboard name.
| | Mark as favorite.
| | Share dashboard.
## View controls
| Item (right) | Description
|-------------------------------------------------| --------------------
| {{icon.configuration}} | Dashboard settings.
| | Cycle view mode.
| (time range) | Time range selector.
| | Time range zoom out.
| | Refresh dashboard.
| (Time interval) | Refresh period.
## View selectors
This menu bar is context-sensitive; it changes according to the page you are on. (With wide menus on small screens, items may wrap to the next row.)

| Item | Description
|-------------------------------|-------------------------------------------
| Interval | Data interval.
| Region | Filter by region.
| Environment | Filter by environment.
| Cluster | Filter by cluster.
| Replication Set | Filter by replication set.
| Node Name | Filter by node name.
| Service Name | Filter by service name.
| PMM Annotations | View [annotations](../how-to/annotate.md).
## Shortcut menu
This menu contains shortcuts to other dashboards. The list changes according to the page you're on.
!!! note alert alert-primary ""
This menu will be removed in future releases. Its function will be replaced by the {{icon.dashboards}} *PMM Dashboards* main menu entry.
| Item | Description
|----------------------------------------------| ------------------------------
| Home | Home dashboard.
| Query Analytics | Query Analytics.
| Compare | Nodes compare.
| (Service Type) | Service type menu (see [Services menu](#services-menu)).
| HA | HA dashboards.
| Services | Services menu.
| PMM | PMM menu.
!!! hint alert alert-success "Tip"
The *Compare* menu links to the Instances Overview dashboard for the current service type.
### Services menu
The *Services* menu choice determines the Service Type menu.
| Menu | Item | Service type menu | Description
|-----------|--------------------------------|-----------------------------------------|-----------------------
| Services | | |
| | MongoDB Instances Overview | MongoDB | MongoDB dashboards.
| | MySQL Instances Overview | MySQL | MySQL dashboards.
| | Nodes Overview | OS | OS dashboards.
| | PostgreSQL Instances Overview | PostgreSQL | PostgreSQL dashboards.
!!! hint alert alert-success "Note"
- You can easily access all dashboards for monitored services from the *Main menu* via *Other Dashboards* in the *Services* sub menu.
- Only the services being monitored by PMM will appear on the main menu.
### PMM menu
This item lists shortcuts to utility pages.
| Menu | Item
|------|---------------------
| PMM |
| | PMM Add Instance
| | PMM Advisor Checks
| | PMM Inventory
| | PMM Settings
[Folders]: https://grafana.com/docs/grafana/latest/dashboards/dashboard_folders/
[PromQL]: https://grafana.com/blog/2020/02/04/introduction-to-promql-the-prometheus-query-language/
[BACKUP]: ../get-started/backup/index.md