# PostgreSQL
How to set up PMM to monitor a [PostgreSQL] or [Percona Distribution for PostgreSQL] database instance.
!!! summary alert alert-info "Summary"
- [Create PMM account and set permissions.](#create-a-database-account-for-pmm)
- [Choose, install and configure an extension](#choose-and-configure-an-extension):
- [`pg_stat_statements`](#pg_stat_statements), or,
- [`pg_stat_monitor`](#pg_stat_monitor).
- [Add service.](#add-service)
- [Check the service](#check-the-service).
## Before you start
Check that:
- [PMM Server is installed](../server/index.md) and running with a known IP address accessible from the client node.
- [PMM Client is installed](index.md) and the [node is registered with PMM Server](index.md#register).
- You have superuser (root) access on the client host.
- You have superuser access to any database servers that you want to monitor.
(PMM follows [PostgreSQL's end-of-life policy][POSTGRESQL_VERSIONING]. For specific details on supported platforms and versions, see [Percona’s Software Platform Lifecycle page][PERCONA_LIFECYCLE].)
## Create a database account for PMM
We recommend creating a PMM database account that can connect to the `postgres` database with the `SUPERUSER` role.
1. Create a user. This example uses `pmm`. (Replace `******` with a strong password of your choice.)
```sql
CREATE USER pmm WITH SUPERUSER ENCRYPTED PASSWORD '******';
```
If your database runs on Amazon RDS / Aurora PostgreSQL, The SUPERUSER cannot be assigned.
So we have to create the user first and then grant the `rds_superuser` role to it.
```sql
CREATE USER pmm WITH ENCRYPTED PASSWORD '******';
GRANT rds_superuser TO pmm;
```
Optionally, you can also set up a connection limit (only if the user is not a SUPERUSER):
```sql
ALTER USER pmm CONNECTION LIMIT 10;
```
2. PMM must be able to log in locally as this user to the PostgreSQL instance. To enable this, edit the `pg_hba.conf` file. If not already enabled by an existing rule, add:
```conf
local all pmm md5
# TYPE DATABASE USER ADDRESS METHOD
```
(Ignore the second line. It is a comment to show field alignment.)
3. Reload the configuration:
```sh
su - postgres
psql -c "select pg_reload_conf()"
```
4. Check local login.
```sh
psql postgres pmm -c "\conninfo"
```
5. Enter the password for the `pmm` user when prompted.
## Choose and configure an extension
Decide which database extension to use, and configure your database server for it. The choices are:
1. [`pg_stat_statements`](#pg_stat_statements), the original extension created by PostgreSQL, part of the `postgresql-contrib` package available on Linux.
2. [`pg_stat_monitor`](#pg_stat_monitor) is a new extension created by Percona. `pg_stat_monitor` has all the features of `pg_stat_statements` but adds *bucket-based data aggregation*, provides more accurate data, and can expose Query Examples.
Here are the benefits and drawbacks of each.
| | Benefits | Drawbacks
|----------------------|------------------------------------------------|---------------------------------------------------
| `pg_stat_statements` | 1. Part of official `postgresql-contrib` package. | 1. No aggregated statistics or histograms
2. No query examples
3. No plan execution information
| `pg_stat_monitor` | 1. Builds on `pg_stat_monitor` features.
2. Bucket-based aggregation. |
For a more detailed comparison of extensions, see [Comparison with pg_stat_statements](https://docs.percona.com/pg-stat-monitor/comparison.html) in the `pg_stat_monitor` documentation.
!!! note alert alert-primary "Bucket-based data aggregation"
`pg_stat_monitor` collects statistics and aggregates data in a data collection unit called a *bucket*. These are linked together to form a *bucket chain*.
You can specify:
- the number of buckets (the length of the chain);
- how much space is available for all buckets;
- a time limit for each bucket's data collection (the *bucket expiry*).
When a bucket's expiration time is reached, accumulated statistics are reset and data is stored in the next available bucket in the chain.
When all buckets in the chain have been used, the first bucket is reused and its contents are overwritten.
If a bucket fills before its expiration time is reached, data is discarded.
### `pg_stat_statements`
#### Install
- Debian/Ubuntu
!!! hint "Root permissions"
```sh
apt install -y postgresql-contrib
```
- Red Hat/CentOS
!!! hint "Root permissions"
```sh
yum install -y postgresql-contrib
```
#### Configure
1. Add these lines to your `postgresql.conf` file:
```conf
shared_preload_libraries = 'pg_stat_statements'
track_activity_query_size = 2048 # Increase tracked query string size
pg_stat_statements.track = all # Track all statements including nested
track_io_timing = on # Capture read/write stats
```
2. Restart the database server. After the restart, the extension starts capturing statistics from every database.
3. Install the extension.
```sh
psql postgres postgres -c "CREATE EXTENSION pg_stat_statements SCHEMA public"
```
This command creates the view where you can access the collected statistics.
!!! note alert alert-primary ""
We recommend that you create the extension for the `postgres` database. In this case, you receive access to the statistics collected from every database.
You can now [add the service](#add-service).
### `pg_stat_monitor`
`pg_stat_monitor` has been tested with:
- PostgreSQL versions 11, 12, 13, 14, 15.
- Percona Distribution for PostgreSQL versions 11, 12, 13, 14, 15.
#### Install
- If you use *Percona Distribution for PostgreSQL*, you can install the extension with your Linux package manager. See [Installing Percona Distribution for PostgreSQL][PERCONA_POSTGRESQL_INSTALL].
- If you use *PostgreSQL* you can install by downloading and compiling the source code. See [Installing `pg_stat_monitor`][PG_STAT_MONITOR_INSTALL].
#### Configure
1. Set or change the value for `shared_preload_library`.
In your `postgresql.conf` file:
```ini
shared_preload_libraries = 'pg_stat_monitor'
```
!!! caution alert alert-warning
If you use both `pg_stat_statements` and `pg_stat_monitor`, set ``pg_stat_monitor`` **after** `pg_stat_statements`:
```ini
shared_preload_libraries = 'pg_stat_statements, pg_stat_monitor'
```
2. Set configuration values.
In your `postgresql.conf` file:
```ini
pg_stat_monitor.pgsm_query_max_len = 2048
```
!!! caution alert alert-warning
It is important to set maximal length of query to 2048 characters or more for PMM to work properly.
You can get a list of other available settings with `SELECT * FROM pg_settings WHERE name LIKE 'pg_stat_monitor.%';`.
Other important parameters are:
```ini
pg_stat_monitor.pgsm_normalized_query
```
and
```ini
pg_stat_monitor.pgsm_enable_query_plan
```
If the value for `pg_stat_monitor.pgsm_normalized_query` is set to 1, the actual query values are replaced by placeholders. If the value is 0, the examples are given in QAN. Examples can be found in QAN details tab example.
If `pg_stat_monitor.pgsm_enable_query_plan` is enabled, the query plans are captured and will be available in the `Plan` tab on the Query Analytics dashboard.
!!! note alert alert-primary ""
See [`pg_stat_monitor` online documentation](https://docs.percona.com/pg-stat-monitor/configuration.html) for details about available parameters.
3. Start or restart your PostgreSQL instance. The extension starts capturing statistics from every database.
4. In a `psql` session:
```sql
CREATE EXTENSION pg_stat_monitor;
```
This command creates the view where you can access the collected statistics.
!!! note alert alert-primary ""
We recommend that you create the extension for the `postgres` database. In this case, you receive the access to the statistics, collected from every database.
5. Check the version.
```sql
SELECT pg_stat_monitor_version();
```
## Add service
When you have configured your database server, you can add a PostgreSQL service with the user interface or on the command line.
### With the user interface
1. Select {{icon.configuration}} *Configuration* → {{icon.inventory}} *Inventory* → {{icon.addinstance}} *Add Service*.
2. Select *PostgreSQL -- Add a remote instance*.
3. Enter or select values for the fields.
4. Click *Add service*.
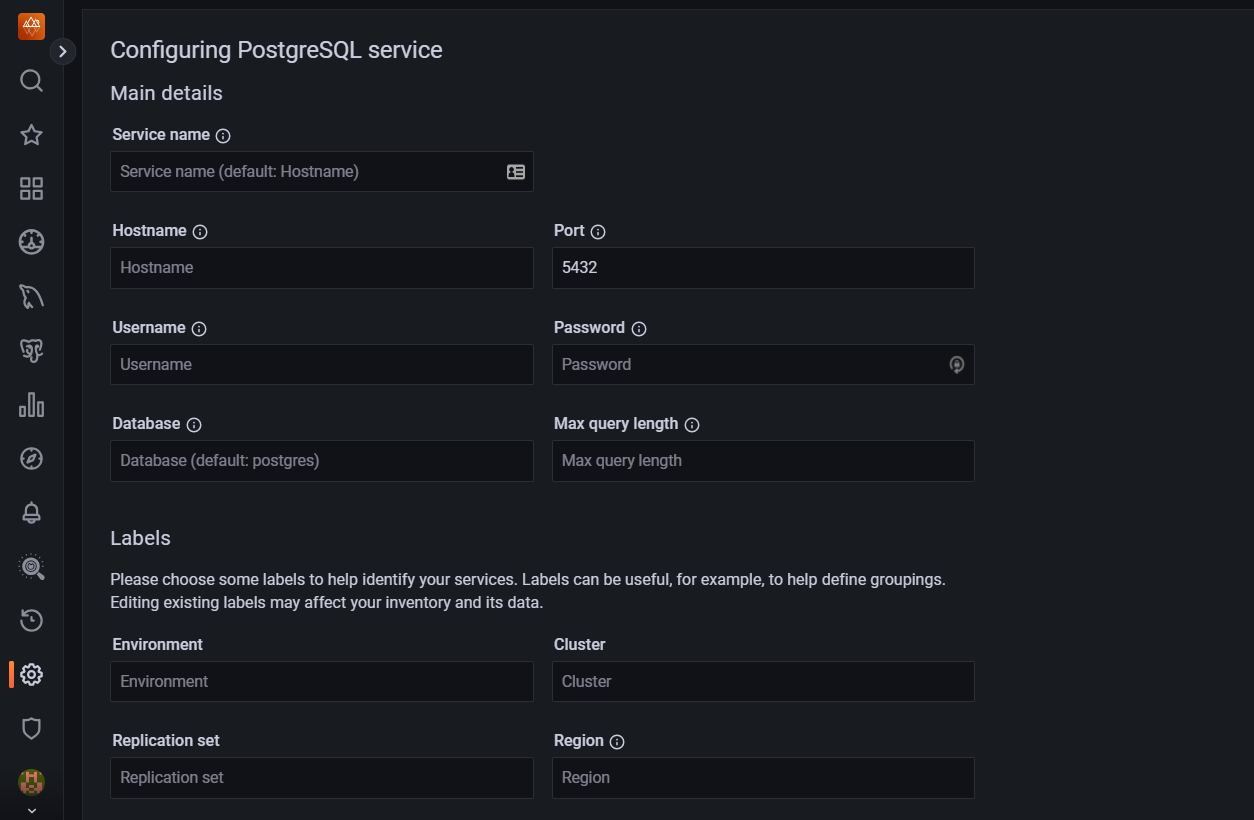
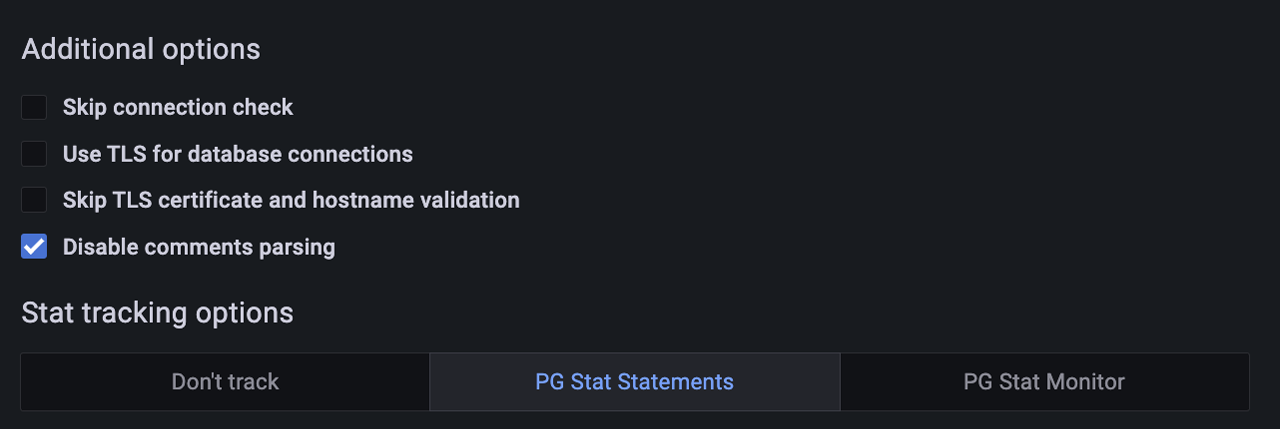
If your PostgreSQL instance is configured to use TLS, click on the *Use TLS for database connections* check box and fill in your TLS certificates and key.
!!! hint alert alert-success "Note"
For TLS connection to work SSL needs to be configured in your PostgreSQL instance. Make sure SSL is enabled in the server configuration file `postgresql.conf`, and that hosts are allowed to connect in the client authentication configuration file `pg_hba.conf`. (See PostgreSQL documentation on [Secure TCP/IP Connections with SSL].)
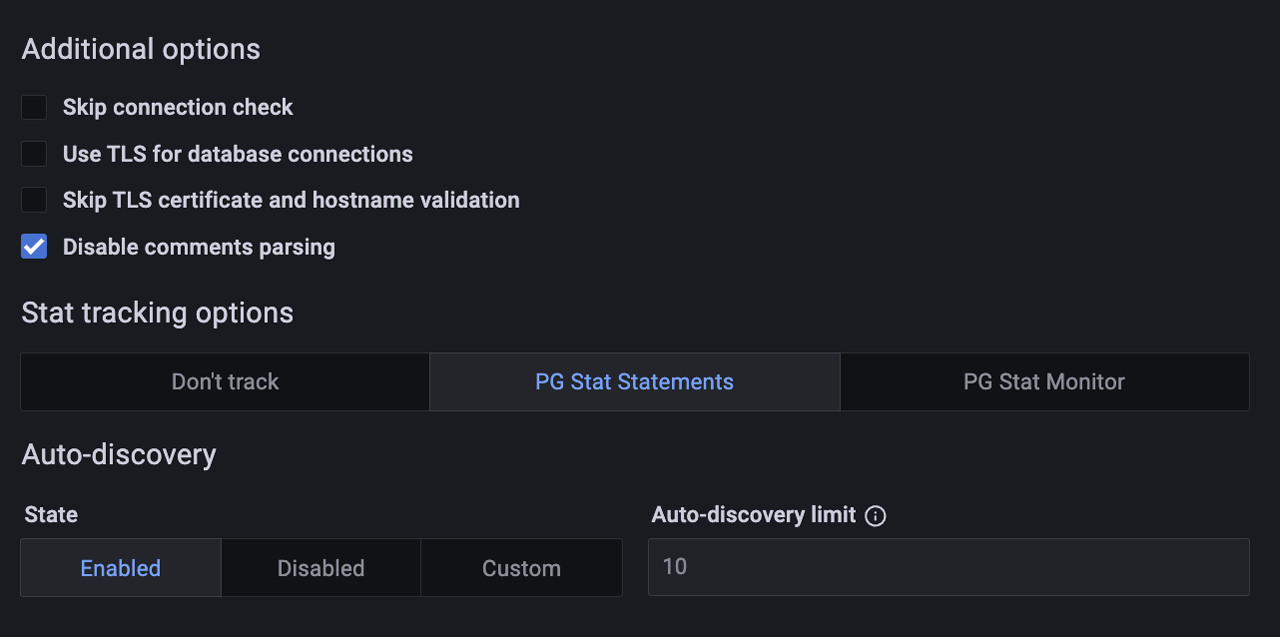
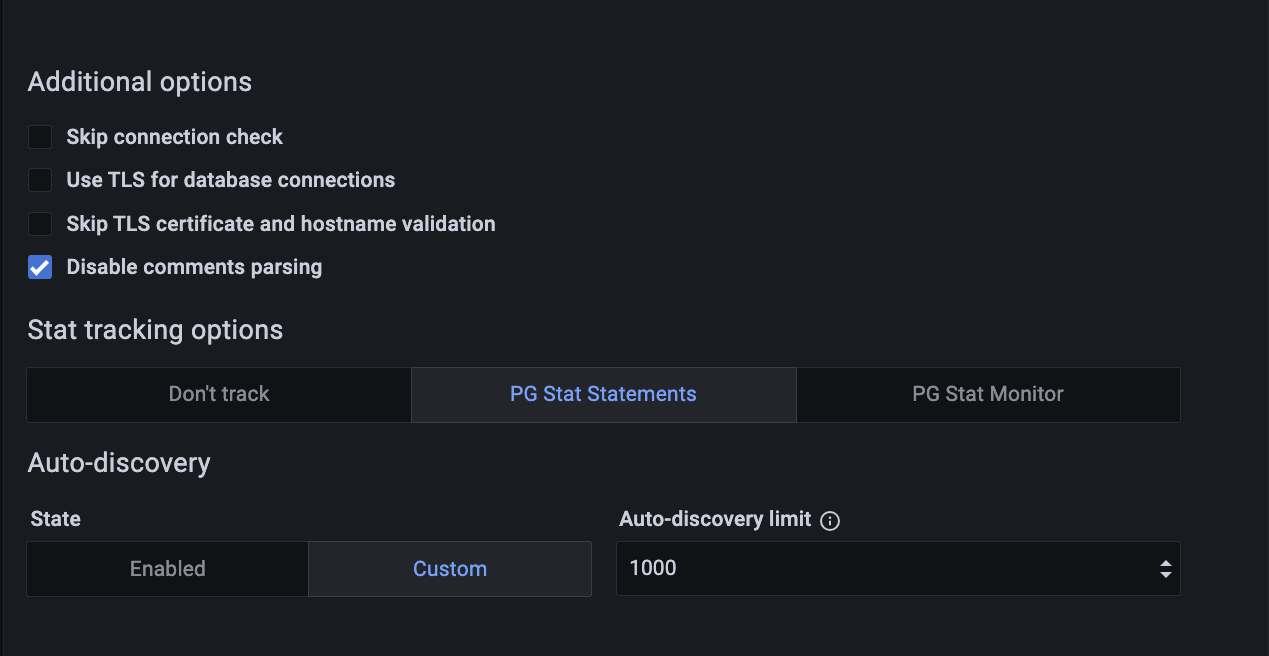
### Auto-discovery limit
Starting with PMM 2.41.0 you can set a limit for **Auto-discovery** in PostgreSQL, a feature that dynamically discovers all databases in your PostgreSQL instance.
Limiting **Auto-discovery** reduces connections and prevents high CPU and RAM usage caused by multiple databases.
!!! caution alert alert-warning
Limiting auto-discovery may result in fewer metrics being captured from the non-primary databases. Ensure that you set the limit appropriately:
- Setting a high limit may impact performance adversely.
- Setting a low limit might result in some missing metrics due to Auto-discovery being disabled.
By default, **Auto-discovery** is enabled (server defined with a limit 10).
When you select **Disabled**, the **Auto-discovery limit** will be set to `-1`.
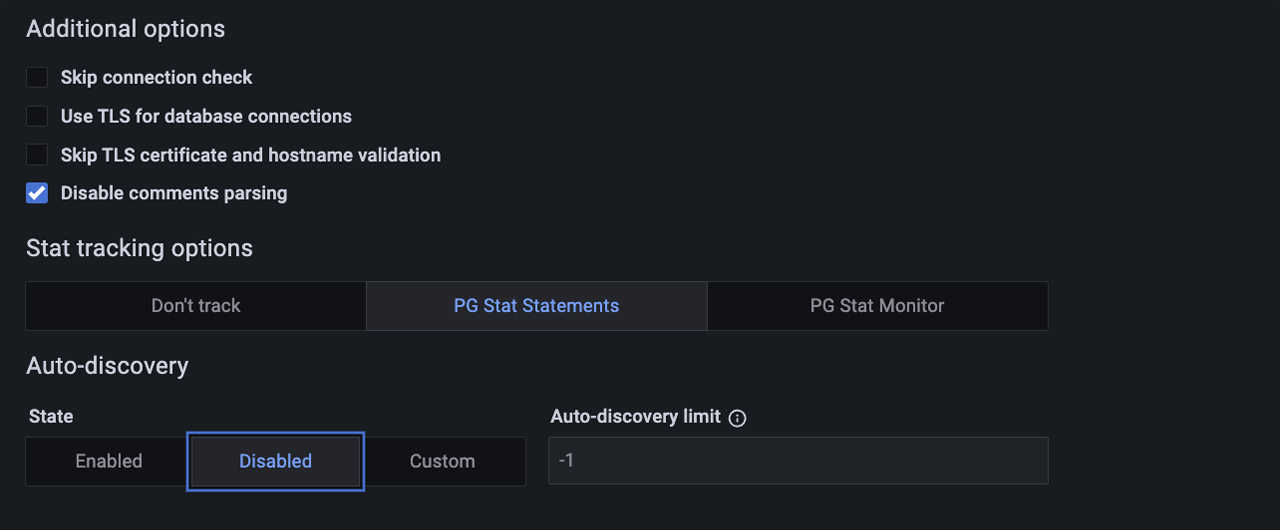
For a custom value, select **Custom** and enter or choose your preferred value from the **Auto-discovery limit** field.
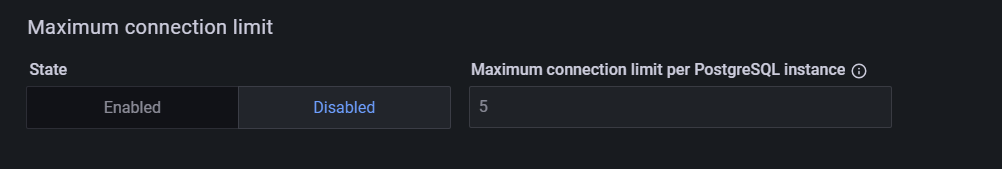
### Maximum connection limit
Starting with PMM 2.42.0, you can set a maximum limit on the number of connections that the PostgreSQL exporter can open to the same PostgreSQL instance.
By setting a maximum connection limit, you can prevent excessive connections during concurrent operations, and ensure that connections are closed promptly to avoid idle connections.
When adjusting the maximum number of connections, consider the following:
- higher values might be needed for larger or busier instances.
- setting the limit too high can impact performance.
- if no limit is specified or the option is disabled, the server will manage the connection limits automatically.
### On the command line
Add the database server as a service using one of these example commands. If successful, PMM Client will print `PostgreSQL Service added` with the service's ID and name. Use the `--environment` and `-custom-labels` options to set tags for the service to help identify them.
### Examples
Add instance with default service name (`-postgresql`).
```sh
pmm-admin add postgresql \
--username=pmm \
--password=password \
--server-url=https://admin:admin@X.X.X.X:443 \
--server-insecure-tls
```
- ``: The PostgreSQL PMM user
- ``: The PostgreSQL user credentials.
The service name will be automatically chosen.
Add instance with specified service name.
```sh
pmm-admin add postgresql \
--username=pmm \
--password=password \
--server-url=https://admin:admin@X.X.X.X:443 \
--server-insecure-tls \
--service-name=SERVICE-NAME
```
Add instance to connect with a UNIX socket.
```sh
pmm-admin add postgresql --socket=/var/run/postgresql
```
where:
- `SOCKET`: directory containing the socket
#### Connecting via SSL/TLS
```sh
pmm-admin add postgresql --tls \
--tls-cert-file=PATHTOCERT \
--tls-ca-file=PATHTOCACERT \
--tls-key-file=PATHTOKEY \
--host=HOST \
--port=PORT \
--username=USER \
--service-name=SERVICE-NAME
```
where:
- `PATHTOCERT`: Path to client certificate file.
- `PATHTOCACERT`: Path to certificate authority file.
- `PATHTOKEY`: Path to client key file.
- `HOST`: Instance hostname or IP.
- `PORT`: PostgreSQL service port number.
- `USER`: Database user allowed to connect via TLS. Should match the common name (CN) used in the client certificate.
- `SERVICE`: Name to give to the service within PMM.
#### Automatic discovery limit via CLI
Starting with PMM 2.41.0, there is a new flag in `pmm-admin` to limit Auto-discovery:
`--auto-discovery-limit=XXX`
- If number of databases > Auto-discovery limit, then auto discovery is **OFF**
- If number of databases <= Auto-discovery limit, then auto discovery is **ON**
- If the Auto-discovery limit is not defined, it takes the default value, which is 0 (server defined with limit 10), and Auto-discovery is **ON**(if you do not have more than 10 databases).
- If Auto-discovery limit < 0 then auto discovery is **OFF**.
Example:
If you set the limit to 10 and your PostgreSQL instance has 11 databases, automatic discovery will be disabled.
`pmm-admin add postgresql --username="pmm-agent" --password="pmm-agent-password" --auto-discovery-limit=10`
## Check the service
### Check service - PMM user interface
1. Select {{icon.configuration}} *Configuration* → {{icon.inventory}} *Inventory*.
2. In the *Services* tab, verify the *Service name*, *Address* and any other relevant details.
3. In the *Options* column, expand the *Details* section and check that the Agents are using the desired data source.
### Check service - Command line
Look for your service in the output of this command.
```sh
pmm-admin inventory list services
```
!!! hint alert alert-success ""
If using Docker, use `docker exec pmm-client pmm-admin inventory list services`
### Check data
1. Open the *PostgreSQL Instance Summary* dashboard.
2. Set the *Service Name* to the newly-added service.
### Running custom queries
The PostgreSQL exporter can run custom queries to add new metrics not provided by default.
Those custom queries must be defined in the `/usr/local/percona/pmm2/collectors/custom-queries/postgresql` in the same host where the exporter is
running. There are 3 directories inside it:
- high-resolution/ - every 5 seconds
- medium-resolution/ - every 10 seconds
- low-resolution/ - every 60 seconds
Depending on the desired resolution for your custom queries, you can place a file with the queries definition.
The file is a yaml where each query can have these fields:
```yml
query_name:
query: the query definition
master: boolean to specify if the query should be executed only in the master
metrics:
- metric name:
usage: GAUGE, LABEL, COUNTER, MAPPEDMETRIC or DURATION
description: a human readable description
```
#### Example
```yml
pg_postmaster_uptime:
query: "select extract(epoch from current_timestamp - pg_postmaster_start_time()) as seconds"
master: true
metrics:
- seconds:
usage: "GAUGE"
description: "Service uptime"
```
Check the see also section for a more detailed description on MySQL custom queries with more examples about how to use custom queries in dashboards.
!!! seealso alert alert-info "See also"
- [`pmm-admin` man page for `pmm-admin add postgresql`](../../details/commands/pmm-admin.md#postgresql)
- [Configuring Percona Repositories with percona-release][PERCONA_RELEASE]
- [Percona Blog -- Running Custom MySQL Queries in Percona Monitoring and Management][BLOG_CUSTOM_QUERIES_MYSQL]
[PostgreSQL]: https://www.postgresql.org/
[Percona Distribution for PostgreSQL]: https://www.percona.com/software/postgresql-distribution
[POSTGRESQL_VERSIONING]: https://www.postgresql.org/support/versioning/
[PERCONA_LIFECYCLE]: https://www.percona.com/services/policies/percona-software-platform-lifecycle/
[PERCONA_RELEASE]: https://www.percona.com/doc/percona-repo-config/percona-release.html
[PERCONA_POSTGRESQL_INSTALL]: https://www.percona.com/doc/postgresql/LATEST/installing.html
[PG_STAT_MONITOR_INSTALL]: https://github.com/percona/pg_stat_monitor#installation
[PMM_ADMIN]: ../../details/pmm-admin.md
[Secure TCP/IP Connections with SSL]: https://www.postgresql.org/docs/current/ssl-tcp.html
[BLOG_CUSTOM_QUERIES_MYSQL]: https://www.percona.com/blog/2020/06/10/running-custom-queries-in-percona-monitoring-and-management/