
# PG EXPORTER
[](https://pigsty.io/docs/pg_exporter)
[](https://hub.docker.com/r/pgsty/pg_exporter)
[](https://github.com/pgsty/pg_exporter/releases/tag/v1.4.1)
[](https://github.com/pgsty/pg_exporter/blob/main/LICENSE)
[](https://star-history.com/#pgsty/pg_exporter&Date)
[](https://goreportcard.com/report/github.com/pgsty/pg_exporter)
> **Advanced [PostgreSQL](https://www.postgresql.org) & [pgBouncer](https://www.pgbouncer.org/) metrics [exporter](https://prometheus.io/docs/instrumenting/exporters/) for [Prometheus](https://prometheus.io/)**
PG Exporter brings ultimate monitoring experience to your PostgreSQL with **declarative config**, **dynamic planning**, and **customizable collectors**.
It provides **600+** metrics and ~3K time series per instance, covers everything you'll need for PostgreSQL observability.
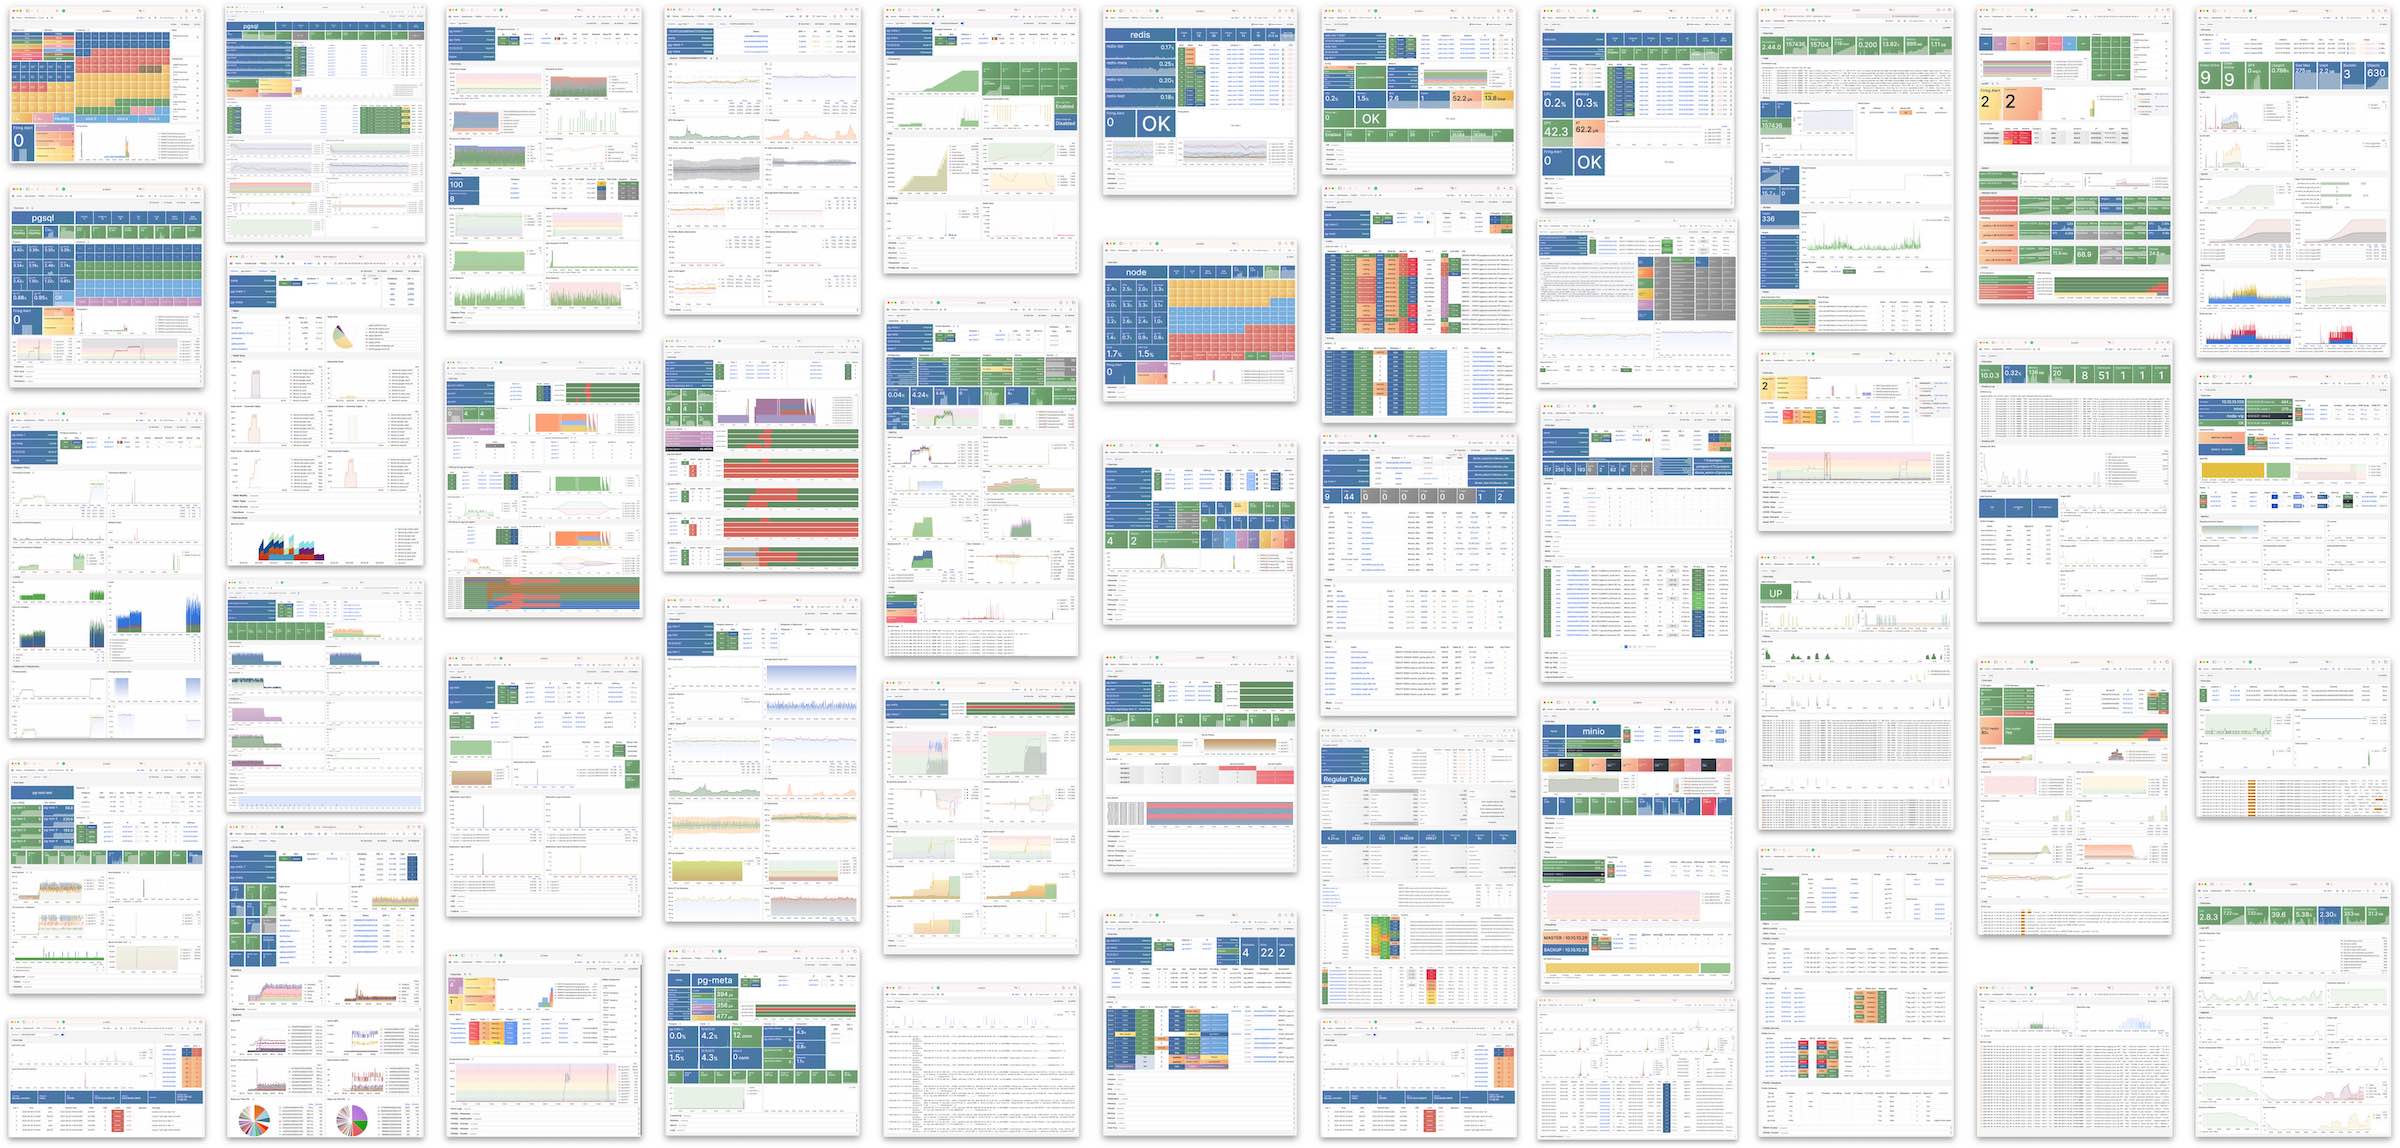
Check [**https://demo.pigsty.io**](https://demo.pigsty.io/ui/) for live demo, which is built upon this exporter by [**Pigsty**](https://pigsty.io).
[](https://demo.pigsty.io)
--------
## Features
- **Highly Customizable**: Define almost all metrics through declarative YAML configs
- **Full Coverage**: Monitor PostgreSQL (10-19+) and pgBouncer (1.8-1.25+) in a single exporter
- **Fine-grained Control**: Configure timeout, caching, skip conditions, and fatality per collector
- **Dynamic Planning**: Define multiple query branches based on different conditions
- **Self-monitoring**: Rich metrics about pg_exporter [itself](https://demo.pigsty.io/d/pgsql-exporter) for complete observability
- **Production-Ready**: Battle-tested in real-world environments across 12K+ cores for 6+ years
- **Auto-discovery**: Automatically discover and monitor multiple databases within an instance
- **Health Check APIs**: Comprehensive HTTP endpoints for service health and traffic routing
- **Extension Support**: `timescaledb`, `citus`, `pg_stat_statements`, `pg_wait_sampling`,...
- **Local-first URL behavior**: Built for on-host deployment, with implicit local target fallback and automatic `sslmode=disable` when omitted
> Also support PG 9.x with [legacy config bundle](legacy/).
--------
## Quick Start
RPM / DEB / Tarball available in the GitHub [release page](https://github.com/pgsty/pg_exporter/releases), and Pigsty's YUM / APT [Infra Repo](https://pigsty.io/docs/repo/infra).
To run this exporter, you need to pass the postgres/pgbouncer URL via env or arg:
```bash
PG_EXPORTER_URL='postgres://user:pass@host:port/postgres' pg_exporter
curl http://localhost:9630/metrics # access metrics
```
There are built-in metrics such as `pg_up`, `pg_version`, `pg_in_recovery`, `pg_exporter_build_info`, and exporter self-metrics under `pg_exporter_*` (disable with `--disable-intro`).
**All other metrics are defined in the [`pg_exporter.yml`](pg_exporter.yml) config file**.
There are two monitoring dashboards in the [`monitor/`](monitor/) directory.
You can use [**Pigsty**](https://pigsty.io) to monitor existing PostgreSQL cluster or RDS, it will setup pg_exporter for you.
--------
## Usage
```bash
usage: pg_exporter []
Flags:
-h, --[no-]help Show context-sensitive help (also try --help-long and --help-man).
-u, --url=URL postgres target url
-c, --config=CONFIG path to config dir or file
--web.listen-address=:9630 ...
Addresses on which to expose metrics and web interface.
--web.config.file="" Path to configuration file that can enable TLS or authentication.
-l, --label="" constant lables:comma separated list of label=value pair ($PG_EXPORTER_LABEL)
-t, --tag="" tags,comma separated list of server tag ($PG_EXPORTER_TAG)
-C, --[no-]disable-cache force not using cache ($PG_EXPORTER_DISABLE_CACHE)
-m, --[no-]disable-intro disable internal/exporter self metrics ($PG_EXPORTER_DISABLE_INTRO)
-a, --[no-]auto-discovery automatically scrape all database for given server ($PG_EXPORTER_AUTO_DISCOVERY)
-x, --exclude-database="template0,template1,postgres"
excluded databases when enabling auto-discovery ($PG_EXPORTER_EXCLUDE_DATABASE)
-i, --include-database="" included databases when enabling auto-discovery ($PG_EXPORTER_INCLUDE_DATABASE)
-n, --namespace="" prefix of built-in metrics, (pg|pgbouncer) by default ($PG_EXPORTER_NAMESPACE)
-f, --[no-]fail-fast fail fast instead of waiting during start-up ($PG_EXPORTER_FAIL_FAST)
-T, --connect-timeout=100 connect timeout in ms, 100 by default ($PG_EXPORTER_CONNECT_TIMEOUT)
-P, --web.telemetry-path="/metrics"
URL path under which to expose metrics. ($PG_EXPORTER_TELEMETRY_PATH)
-D, --[no-]dry-run dry run and print raw configs
-E, --[no-]explain explain server planned queries
--log.level="info" log level: debug|info|warn|error]
--log.format="logfmt" log format: logfmt|json
--[no-]version Show application version.
```
Parameters could be given via command-line args or environment variables.
| CLI Arg | Environment Variable | Default Value |
|------------------------|--------------------------------|----------------------------------|
| `--url` | `PG_EXPORTER_URL` | `postgresql:///?sslmode=disable` |
| `--config` | `PG_EXPORTER_CONFIG` | `pg_exporter.yml` |
| `--label` | `PG_EXPORTER_LABEL` | |
| `--tag` | `PG_EXPORTER_TAG` | |
| `--auto-discovery` | `PG_EXPORTER_AUTO_DISCOVERY` | `true` |
| `--disable-cache` | `PG_EXPORTER_DISABLE_CACHE` | `false` |
| `--fail-fast` | `PG_EXPORTER_FAIL_FAST` | `false` |
| `--exclude-database` | `PG_EXPORTER_EXCLUDE_DATABASE` | |
| `--include-database` | `PG_EXPORTER_INCLUDE_DATABASE` | |
| `--namespace` | `PG_EXPORTER_NAMESPACE` | `pg\|pgbouncer` |
| `--connect-timeout` | `PG_EXPORTER_CONNECT_TIMEOUT` | `100` |
| `--dry-run` | | `false` |
| `--explain` | | `false` |
| `--log.level` | | `info` |
| `--log.format` | | `logfmt` |
| `--web.listen-address` | | `:9630` |
| `--web.config.file` | | `""` |
| `--web.telemetry-path` | `PG_EXPORTER_TELEMETRY_PATH` | `/metrics` |
### Connection URL Defaults
- If `--url` / `PG_EXPORTER_URL` is not provided, pg_exporter falls back to a local-first default URL: `postgresql:///?sslmode=disable`.
- If `sslmode` is not explicitly set in the URL, pg_exporter injects `sslmode=disable` by default.
- This is an intentional design choice for common on-host deployments (`pg_exporter` and PostgreSQL/PgBouncer on the same machine), where loopback TLS adds overhead with little practical gain.
- If you need TLS for remote targets, provide `sslmode` explicitly in the connection URL (for example: `sslmode=require`, `verify-ca`, `verify-full`).
------
## API
PG Exporter provides a rich set of HTTP endpoints:
Here are `pg_exporter` REST APIs
```bash
# Fetch metrics (customizable)
curl localhost:9630/metrics
# Reload configuration
curl -X POST localhost:9630/reload
# Explain configuration
curl localhost:9630/explain
# Print Statistics
curl localhost:9630/stat
# Aliveness health check (200 up, 503 down)
curl localhost:9630/up
curl localhost:9630/health
curl localhost:9630/liveness
curl localhost:9630/readiness
# traffic route health check
### 200 if not in recovery, 404 if in recovery, 503 if server is down
curl localhost:9630/primary
curl localhost:9630/leader
curl localhost:9630/master
curl localhost:9630/read-write
curl localhost:9630/rw
### 200 if in recovery, 404 if not in recovery, 503 if server is down
curl localhost:9630/replica
curl localhost:9630/standby
curl localhost:9630/read-only
curl localhost:9630/ro
### 200 if server is ready for read traffic (including primary), 503 if server is down
curl localhost:9630/read
```
--------
## Build
To build a static stand-alone binary for docker scratch
```bash
CGO_ENABLED=0 GOOS=linux go build -a -ldflags '-extldflags "-static"' -o pg_exporter
```
Or [download](https://github.com/pgsty/pg_exporter/releases) the latest prebuilt binaries from release pages.
We also have pre-packaged RPM / DEB packages in the [Pigsty Infra Repo](https://pigsty.io/docs/repo/infra/)
--------
## Docker
You can find pre-built amd64/arm64 docker images here: [pgsty/pg_exporter](https://hub.docker.com/r/pgsty/pg_exporter)
Build a local development image from the canonical [`Dockerfile`](Dockerfile):
```bash
make docker
# Override the image repository when needed:
make docker DOCKER_REPO=example/pg_exporter
```
Multi-architecture release images are built by [GoReleaser](.goreleaser.yml) together with the other release artifacts.
--------
## Deployment
Redhat rpm and Debian/Ubuntu deb packages are made with `nfpm` for `x86/arm64`:
* `/usr/bin/pg_exporter`: the pg_exporter binary.
* [`/etc/pg_exporter.yml`](pg_exporter.yml): the config file
* [`/usr/lib/systemd/system/pg_exporter.service`](package/pg_exporter.service): systemd service file
* [`/etc/default/pg_exporter`](package/pg_exporter.default): systemd service envs & options
Which is also available on Pigsty's [Infra Repo](https://pigsty.io/docs/repo/infra).
------
## Collectors
Configs lie in the core of `pg_exporter`. Actually, this project contains more lines of YAML than go.
* A monolith battery-included config file: [`pg_exporter.yml`](pg_exporter.yml)
* Separated metrics definition in [`config/`](config/)
* Example of how to write a config file: [`doc.yml`](config/0000-doc.yml)
* Authoritative Histogram design: [`docs/design/histogram.md`](docs/design/histogram.md)
* Legacy config bundle for PostgreSQL 9.1 - 9.6: [`legacy/`](legacy/) ([`legacy/README.md`](legacy/README.md))
Current `pg_exporter` ships 58 collector definition files in [`config/`](config/). They are merged into [`pg_exporter.yml`](pg_exporter.yml) by `make conf`.
| File | Collector namespace(s) | Scope / requirement |
|-------------------------------------------------------------------|---------------------------------------|---------------------------------------------------------------------------------------------------------------------------------|
| [0000-doc.yml](config/0000-doc.yml) | config reference | YAML schema and collector authoring guide; not an installed collector |
| [0110-pg.yml](config/0110-pg.yml) | `pg` | PostgreSQL basic information, with primary and replica branches |
| [0120-pg_meta.yml](config/0120-pg_meta.yml) | `pg_meta` | PostgreSQL cluster metadata; PG13+ includes `primary_conninfo` |
| [0130-pg_setting.yml](config/0130-pg_setting.yml) | `pg_setting` | Shared PostgreSQL settings and capacity limits |
| [0210-pg_repl.yml](config/0210-pg_repl.yml) | `pg_repl` | Replication sender statistics |
| [0220-pg_sync_standby.yml](config/0220-pg_sync_standby.yml) | `pg_sync_standby` | Synchronous standby status |
| [0230-pg_downstream.yml](config/0230-pg_downstream.yml) | `pg_downstream` | Downstream replication client counts |
| [0240-pg_slot.yml](config/0240-pg_slot.yml) | `pg_slot` | Replication slots; PG16+ branches also work on standbys, and PG17+ recognizes the PG19 `idle_timeout` invalidation reason |
| [0250-pg_recv.yml](config/0250-pg_recv.yml) | `pg_recv` | Replica WAL receiver metrics; PG13+ branch recognizes the PG19 `connecting` status |
| [0260-pg_sub.yml](config/0260-pg_sub.yml) | `pg_sub` | Subscription stats; PG19 branch covers table/sequence sync errors and logical replication conflict counters |
| [0270-pg_origin.yml](config/0270-pg_origin.yml) | `pg_origin` | Replication origin status; disabled by default and may need extra privileges |
| [0300-pg_io.yml](config/0300-pg_io.yml) | `pg_io` | `pg_stat_io` metrics for PG16+, with PG18+ branch |
| [0310-pg_size.yml](config/0310-pg_size.yml) | `pg_size` | Database, WAL, and log size metrics |
| [0320-pg_archiver.yml](config/0320-pg_archiver.yml) | `pg_archiver` | Archiver process statistics |
| [0330-pg_bgwriter.yml](config/0330-pg_bgwriter.yml) | `pg_bgwriter` | Background writer statistics, with PG17+ branch |
| [0331-pg_checkpointer.yml](config/0331-pg_checkpointer.yml) | `pg_checkpointer` | Checkpointer statistics, with PG18+ `num_done` and `slru_written` metrics |
| [0340-pg_ssl.yml](config/0340-pg_ssl.yml) | `pg_ssl` | SSL client connection counts |
| [0350-pg_checkpoint.yml](config/0350-pg_checkpoint.yml) | `pg_checkpoint` | Checkpoint information from `pg_control_checkpoint` |
| [0355-pg_timeline.yml](config/0355-pg_timeline.yml) | `pg_timeline` | Current timeline ID on primary or replica |
| [0360-pg_recovery.yml](config/0360-pg_recovery.yml) | `pg_recovery`, `pg_recovery_prefetch` | Replica recovery and recovery-prefetch metrics |
| [0370-pg_recovery_state.yml](config/0370-pg_recovery_state.yml) | `pg_recovery_state` | PG19 replica-only recovery state from `pg_stat_recovery` |
| [0380-pg_slru.yml](config/0380-pg_slru.yml) | `pg_slru` | SLRU cache statistics for PG13+ |
| [0390-pg_shmem.yml](config/0390-pg_shmem.yml) | `pg_shmem` | Shared memory allocation metrics; disabled by default and requires `schema:monitor` |
| [0400-pg_wal.yml](config/0400-pg_wal.yml) | `pg_wal` | WAL statistics for PG14+; PG19 branch adds full-page-image byte metrics |
| [0410-pg_activity.yml](config/0410-pg_activity.yml) | `pg_activity` | Backend activity counts by database and state |
| [0420-pg_wait.yml](config/0420-pg_wait.yml) | `pg_wait` | Backend wait counts by wait-event type |
| [0430-pg_backend.yml](config/0430-pg_backend.yml) | `pg_backend` | Backend process counts grouped by `backend_type` |
| [0440-pg_xact.yml](config/0440-pg_xact.yml) | `pg_xact` | Transaction snapshot boundaries and active transaction count |
| [0450-pg_xact_age.yml](config/0450-pg_xact_age.yml) | `pg_xact_age` | PG10+ cluster-wide open-transaction and idle-in-transaction age snapshot histograms per database |
| [0460-pg_lock.yml](config/0460-pg_lock.yml) | `pg_lock` | Lock distribution by database and mode |
| [0470-pg_lock_stat.yml](config/0470-pg_lock_stat.yml) | `pg_lock_stat` | PG19 cluster-wide lock waits, wait time, and fast-path overflow counts by lock type |
| [0480-pg_query.yml](config/0480-pg_query.yml) | `pg_query` | Query metrics from `pg_stat_statements`; requires `extension:pg_stat_statements` |
| [0510-pg_vacuuming.yml](config/0510-pg_vacuuming.yml) | `pg_vacuuming` | Primary-only VACUUM progress; PG18+ branch includes `delay_time` |
| [0520-pg_indexing.yml](config/0520-pg_indexing.yml) | `pg_indexing` | Primary-only `CREATE INDEX` progress |
| [0530-pg_clustering.yml](config/0530-pg_clustering.yml) | `pg_clustering` | Primary-only `CLUSTER` / `VACUUM FULL` progress |
| [0540-pg_backup.yml](config/0540-pg_backup.yml) | `pg_backup` | Base backup progress for PG13+ |
| [0610-pg_db.yml](config/0610-pg_db.yml) | `pg_db` | Database statistics; PG18+ branch includes parallel-worker launch counters |
| [0620-pg_db_confl.yml](config/0620-pg_db_confl.yml) | `pg_db_confl` | Replica database conflict counters; PG16+ branch uses an explicit column list |
| [0640-pg_pubrel.yml](config/0640-pg_pubrel.yml) | `pg_pubrel` | Publication and publication-relation counts |
| [0650-pg_subrel.yml](config/0650-pg_subrel.yml) | `pg_subrel` | Subscription relation counts grouped by state |
| [0660-pg_vacuum_score.yml](config/0660-pg_vacuum_score.yml) | `pg_vacuum_score` | PG19 current-database autovacuum score summary from `pg_stat_autovacuum_scores` |
| [0700-pg_table.yml](config/0700-pg_table.yml) | `pg_table` | Per-table statistics; PG18+ branch includes vacuum/analyze time and new-page update counters |
| [0710-pg_index.yml](config/0710-pg_index.yml) | `pg_index` | Per-index statistics |
| [0720-pg_func.yml](config/0720-pg_func.yml) | `pg_func` | Function execution statistics |
| [0730-pg_seq.yml](config/0730-pg_seq.yml) | `pg_seq` | Sequence metrics |
| [0740-pg_relkind.yml](config/0740-pg_relkind.yml) | `pg_relkind` | Relation counts by relation kind |
| [0750-pg_defpart.yml](config/0750-pg_defpart.yml) | `pg_defpart` | Default partition tuple counts |
| [0810-pg_table_size.yml](config/0810-pg_table_size.yml) | `pg_table_size` | Per-table size metrics; can be slow on large schemas |
| [0820-pg_table_bloat.yml](config/0820-pg_table_bloat.yml) | `pg_table_bloat` | Table bloat metrics; disabled by default and requires auxiliary view `pg_table_bloat` |
| [0830-pg_index_bloat.yml](config/0830-pg_index_bloat.yml) | `pg_index_bloat` | B-tree index bloat metrics; disabled by default and requires auxiliary view `pg_index_bloat` |
| [0910-pgbouncer_list.yml](config/0910-pgbouncer_list.yml) | `pgbouncer_list` | PgBouncer list metrics from the admin database |
| [0920-pgbouncer_database.yml](config/0920-pgbouncer_database.yml) | `pgbouncer_database` | PgBouncer database metrics, with version-specific branches |
| [0930-pgbouncer_stat.yml](config/0930-pgbouncer_stat.yml) | `pgbouncer_stat` | PgBouncer per-database stats, with version-specific branches |
| [0940-pgbouncer_pool.yml](config/0940-pgbouncer_pool.yml) | `pgbouncer_pool` | PgBouncer pool metrics, with version-specific branches |
| [1000-pg_wait_event.yml](config/1000-pg_wait_event.yml) | `pg_wait_event`, `pg_wait_event_1s` | Wait-event sampling; requires `extension:pg_wait_sampling` |
| [1800-pg_tsdb_hypertable.yml](config/1800-pg_tsdb_hypertable.yml) | `pg_tsdb_hypertable` | TimescaleDB hypertable overview; disabled by default and requires `extension:timescaledb` plus `schema:timescaledb_information` |
| [1900-pg_citus.yml](config/1900-pg_citus.yml) | `pg_citus_node` | Citus worker/coordinator node inventory; requires `extension:citus` |
| [2000-pg_heartbeat.yml](config/2000-pg_heartbeat.yml) | `pg_heartbeat` | Monitor heartbeat table; disabled by default and requires `dbname:postgres` plus `schema:monitor` |
> #### Note
>
> Supported version: PostgreSQL 10, 11, 12, 13, 14, 15, 16, 17, 18, 19+
>
> But you can still get PostgreSQL 9.1 - 9.6 support by switching to the [`legacy/pg_exporter.yml`](legacy/pg_exporter.yml) config
`pg_exporter` will generate approximately 600 metrics for a completely new database cluster.
For a real-world database with 10 ~ 100 tables, it may generate several 1k ~ 10k metrics.
You may need to modify or disable some database-level metrics on a database with several thousand or more tables to complete the scrape in time.
Config files are using YAML format, there are lots of examples in the [config](https://github.com/pgsty/pg_exporter/tree/main/config) dir. and here is a [sample](config/0000-doc.yml) config.
```
#==============================================================#
# 1. Config File
#==============================================================#
# The configuration file for pg_exporter is a YAML file.
# Default configurations are retrieved via following precedence:
# 1. command line args: --config=
# 2. environment variables: PG_EXPORTER_CONFIG=
# 3. pg_exporter.yml (Current directory)
# 4. /etc/pg_exporter.yml (config file)
# 5. /etc/pg_exporter (config dir)
#==============================================================#
# 2. Config Format
#==============================================================#
# pg_exporter config could be a single YAML file, or a directory containing a series of separated YAML files.
# Each YAML config file consists of one or more metrics Collector definition, which are top-level objects.
# If a directory is provided, all YAML files in that directory (non-recursive; subdirectories are ignored) will be merged in alphabetic order.
# Collector definition examples are shown below.
#==============================================================#
# 3. Collector Example
#==============================================================#
# # Here is an example of a metrics collector definition
# pg_primary_only: # Collector branch name. Must be UNIQUE among the entire configuration
# name: pg # Collector namespace, used as METRIC PREFIX, set to branch name by default, can be override
# # the same namespace may contain multiple collector branches. It`s the user`s responsibility
# # to make sure that AT MOST ONE collector is picked for each namespace.
#
# desc: PostgreSQL basic information (on primary) # Collector description
# query: | # Metrics Query SQL
#
# SELECT extract(EPOCH FROM CURRENT_TIMESTAMP) AS timestamp,
# pg_current_wal_lsn() - '0/0' AS lsn,
# pg_current_wal_insert_lsn() - '0/0' AS insert_lsn,
# pg_current_wal_lsn() - '0/0' AS write_lsn,
# pg_current_wal_flush_lsn() - '0/0' AS flush_lsn,
# extract(EPOCH FROM now() - pg_postmaster_start_time()) AS uptime,
# extract(EPOCH FROM now() - pg_conf_load_time()) AS conf_reload_time,
# pg_is_in_backup() AS is_in_backup,
# extract(EPOCH FROM now() - pg_backup_start_time()) AS backup_time;
#
# # [OPTIONAL] metadata fields, control collector behavior
# ttl: 10 # Cache TTL: in seconds, how long will pg_exporter cache this collector`s query result.
# timeout: 0.1 # Query Timeout: in seconds, queries that exceed this limit will be canceled.
# min_version: 100000 # minimal supported version, boundary IS included. In server version number format,
# max_version: 130000 # maximal supported version, boundary NOT included, In server version number format
# fatal: false # Collector marked `fatal` fails, the entire scrape will abort immediately and marked as failed
# skip: false # Collector marked `skip` will not be installed during the planning procedure
#
# tags: [cluster, primary] # Collector tags, used for planning and scheduling
#
# # tags are list of strings, which could be:
# # * `cluster` marks this query as cluster level, so it will only execute once for the same PostgreSQL Server
# # * `primary` or `master` mark this query can only run on a primary instance (WILL NOT execute if pg_is_in_recovery())
# # * `standby` or `replica` mark this query can only run on a replica instance (WILL execute if pg_is_in_recovery())
# # some special tag prefix have special interpretation:
# # * `dbname:` means this query will ONLY be executed on database with name ``
# # * `username:` means this query will only be executed when connect with user ``
# # * `extension:` means this query will only be executed when extension `` is installed
# # * `schema:` means this query will only by executed when schema `` exist
# # * `not:` means this query WILL NOT be executed when exporter is tagged with ``
# # * `` means this query WILL be executed when exporter is tagged with ``
# # ( could not be cluster,primary,standby,master,replica,etc...)
#
# # One or more "predicate queries" may be defined for a metric query. These
# # are run before the main metric query (after any cache hit check). If all
# # of them, when run sequentially, return a single row with a single column
# # boolean true result, the main metric query is executed. If any of them
# # return false or return zero rows, the main query is skipped. If any
# # predicate query returns more than one row, a non-boolean result, or fails
# # with an error, the whole query is marked failed. Predicate queries can be
# # used to check for the presence of specific functions, tables, extensions,
# # settings, and vendor-specific pg features before running the main query.
#
# predicate_queries:
# - name: predicate query name
# predicate_query: |
# SELECT EXISTS (SELECT 1 FROM information_schema.routines WHERE routine_schema = 'pg_catalog' AND routine_name = 'pg_backup_start_time');
#
# metrics: # List of returned columns, each column must have a `name` and `usage`, `rename` and `description` are optional
# - timestamp: # Column name, should be exactly the same as returned column name
# usage: GAUGE # Metric type, `usage` could be
# * DISCARD: completely ignoring this field
# * LABEL: use columnName=columnValue as a label in metric
# * GAUGE: Mark column as a gauge metric, full name will be `_`
# * COUNTER: Same as above, except it is a counter rather than a gauge.
# * HISTOGRAM: Aggregate one observation per SQL row into a snapshot distribution.
# rename: ts # [OPTIONAL] Alias, optional, the alias will be used instead of the column name
# description: xxxx # [OPTIONAL] Description of the column, will be used as a metric description
# default: 0 # [OPTIONAL] Default value, will be used when column is NULL
# scale: 1000 # [OPTIONAL] Scale the value by this factor
# - lsn:
# usage: COUNTER
# description: log sequence number, current write location (on primary)
# - insert_lsn:
# usage: COUNTER
# description: primary only, location of current wal inserting
# - write_lsn:
# usage: COUNTER
# description: primary only, location of current wal writing
# - flush_lsn:
# usage: COUNTER
# description: primary only, location of current wal syncing
# - uptime:
# usage: GAUGE
# description: seconds since postmaster start
# - conf_reload_time:
# usage: GAUGE
# description: seconds since last configuration reload
# - is_in_backup:
# usage: GAUGE
# description: 1 if backup is in progress
# - backup_time:
# usage: GAUGE
# description: seconds since the current backup start. null if don`t have one
#
# .... # you can also use rename & scale to customize the metric name and value:
# - checkpoint_write_time:
# rename: write_time
# usage: COUNTER
# scale: 1e-3
# description: Total amount of time that has been spent in the portion of checkpoint processing where files are written to disk, in seconds
# - xact_age_seconds:
# usage: HISTOGRAM
# bucket: [1, 3, 10, 30, 100, 300, 1000, 3000] # finite increasing upper bounds
# description: Open transaction age snapshot in seconds
#
# # HISTOGRAM is rebuilt from the current SQL result whenever the query actually executes.
# # It emits cumulative `_bucket{le=...}`, `_count`, and `_sum` Gauge series,
# # which may increase or decrease between snapshots. Query them directly with histogram_quantile():
# # histogram_quantile(0.95, sum by (datname, le) (pg_xact_age_seconds_bucket))
# # +Inf is automatic; the first finite bucket implicitly contains every lower value.
# # Signed domains should configure finite negative boundaries and zero; do not configure -Inf.
# # Do NOT apply rate(), irate(), or increase() to snapshot Histogram series.
# # See docs/design/histogram.md for the authoritative contract.
#==============================================================#
# 4. Collector Presets
#==============================================================#
# pg_exporter is shipped with a series of preset collectors (already numbered and ordered by filename)
#
# 1xx Basic metrics: basic info, metadata, settings
# 2xx Replication metrics: replication, walreceiver, downstream, sync standby, slots, subscription
# 3xx Persist metrics: size, wal, background writer, checkpointer, ssl, checkpoint, recovery, slru cache, shmem usage
# 4xx Activity metrics: backend count group by state, wait event, locks, xacts, queries
# 5xx Progress metrics: clustering, vacuuming, indexing, basebackup, copy
# 6xx Database metrics: pg_database, publication, subscription
# 7xx Object metrics: pg_class, table, index, function, sequence, default partition
# 8xx Optional metrics: optional metrics collector (disable by default, slow queries)
# 9xx Pgbouncer metrics: metrics from pgbouncer admin database `pgbouncer`
#
# 100-599 Metrics for entire database cluster (scrape once)
# 600-899 Metrics for single database instance (scrape for each database ,except for pg_db itself)
#==============================================================#
# 5. Cache TTL
#==============================================================#
# Cache can be used for reducing query overhead, it can be enabled by setting a non-zero value for `ttl`
# It is highly recommended to use cache to avoid duplicate scrapes. Especially when you got multiple Prometheus
# scraping the same instance with slow monitoring queries. Setting `ttl` to zero or leaving blank will disable
# result caching, which is the default behavior
#
# TTL has to be smaller than your scrape interval. 15s scrape interval and 10s TTL is a good start for
# production environment. Some expensive monitoring queries (such as size/bloat check) will have longer `ttl`
# which can also be used as a mechanism to achieve `different scrape frequency`
#==============================================================#
# 6. Query Timeout
#==============================================================#
# Collectors can be configured with an optional Timeout. If the collector's query executes more than that
# timeout, it will be canceled immediately. Setting the `timeout` to 0 or leaving blank will reset it to
# default timeout 0.1 (100ms). Setting it to any negative number will disable the query timeout feature.
# All queries have a default timeout of 100ms, if exceeded, the query will be canceled immediately to avoid
# avalanche. You can explicitly overwrite that option. but beware: in some extreme cases, if all your
# timeouts sum up greater your scrape/cache interval (usually 15s), the queries may still be jammed.
# or, you can just disable potential slow queries.
#==============================================================#
# 7. Version Compatibility
#==============================================================#
# Each collector has two optional version compatibility parameters: `min_version` and `max_version`.
# These two parameters specify the version compatibility of the collector. If target postgres/pgbouncer's
# version is less than `min_version`, or higher than `max_version`, the collector will not be installed.
# These two parameters are using PostgreSQL server version number format, which is a 6-digit integer
# format as :.
# For example, 090600 stands for 9.6, and 120100 stands for 12.1
# And beware that version compatibility range is left-inclusive right exclusive: [min, max), set to zero or
# leaving blank will affect as -inf or +inf
#==============================================================#
# 8. Fatality
#==============================================================#
# If a collector is marked with `fatal` falls, the entire scrape operation will be marked as fail and key metrics
# `pg_up` / `pgbouncer_up` will be reset to 0. It is always a good practice to set up AT LEAST ONE fatal
# collector for pg_exporter. `pg.pg_primary_only` and `pgbouncer_list` are the default fatal collector.
#
# If a collector without `fatal` flag fails, it will increase global fail counters. But the scrape operation
# will carry on. The entire scrape result will not be marked as faile, thus will not affect the `_up` metric.
#==============================================================#
# 9. Skip
#==============================================================#
# Collector with `skip` flag set to true will NOT be installed.
# This could be a handy option to disable collectors
#==============================================================#
# 10. Tags and Planning
#==============================================================#
# Tags are designed for collector planning & schedule. It can be handy to customize which queries run
# on which instances. And thus you can use one-single monolith config for multiple environments
#
# Tags are a list of strings, each string could be:
# Pre-defined special tags
# * `cluster` marks this collector as cluster level, so it will ONLY BE EXECUTED ONCE for the same PostgreSQL Server
# * `primary` or `master` mark this collector as primary-only, so it WILL NOT work iff pg_is_in_recovery()
# * `standby` or `replica` mark this collector as replica-only, so it WILL work iff pg_is_in_recovery()
# Special tag prefix which have different interpretation:
# * `dbname:` means this collector will ONLY work on database with name ``
# * `username:` means this collector will ONLY work when connect with user ``
# * `extension:` means this collector will ONLY work when extension `` is installed
# * `schema:` means this collector will only work when schema `` exists
# Customized positive tags (filter) and negative tags (taint)
# * `not:` means this collector WILL NOT work when exporter is tagged with ``
# * `` means this query WILL work if exporter is tagged with `` (special tags not included)
#
# pg_exporter will trigger the Planning procedure after connecting to the target. It will gather database facts
# and match them with tags and other metadata (such as supported version range). Collector will only
# be installed if and only if it is compatible with the target server.
```
--------------------
## About
Author: [Vonng](https://vonng.com/en) ([rh@vonng.com](mailto:rh@vonng.com))
Contributors: https://github.com/pgsty/pg_exporter/graphs/contributors
License: [Apache-2.0](LICENSE)
Copyright: 2018-2026 rh@vonng.com