

| Previous | Up | Next |
![]()
Navigation
- Acknowledgements
- Installing PISM
- PISM User’s Manual
- Getting started: a Greenland ice sheet example
- Ice dynamics, the PISM view
- Initialization and bootstrapping
- Modeling choices
- Practical usage
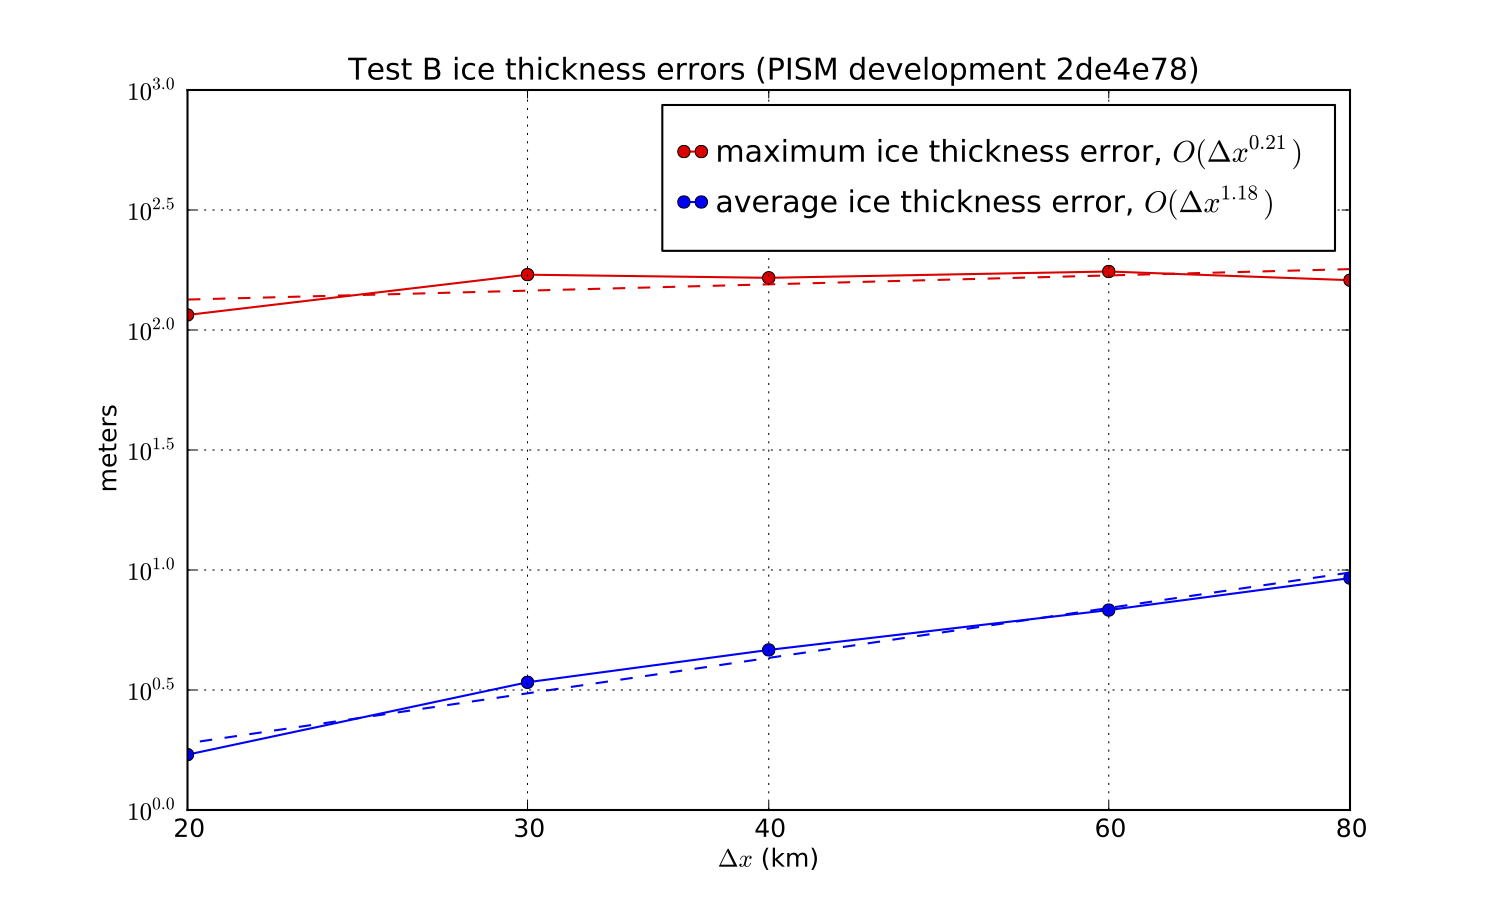
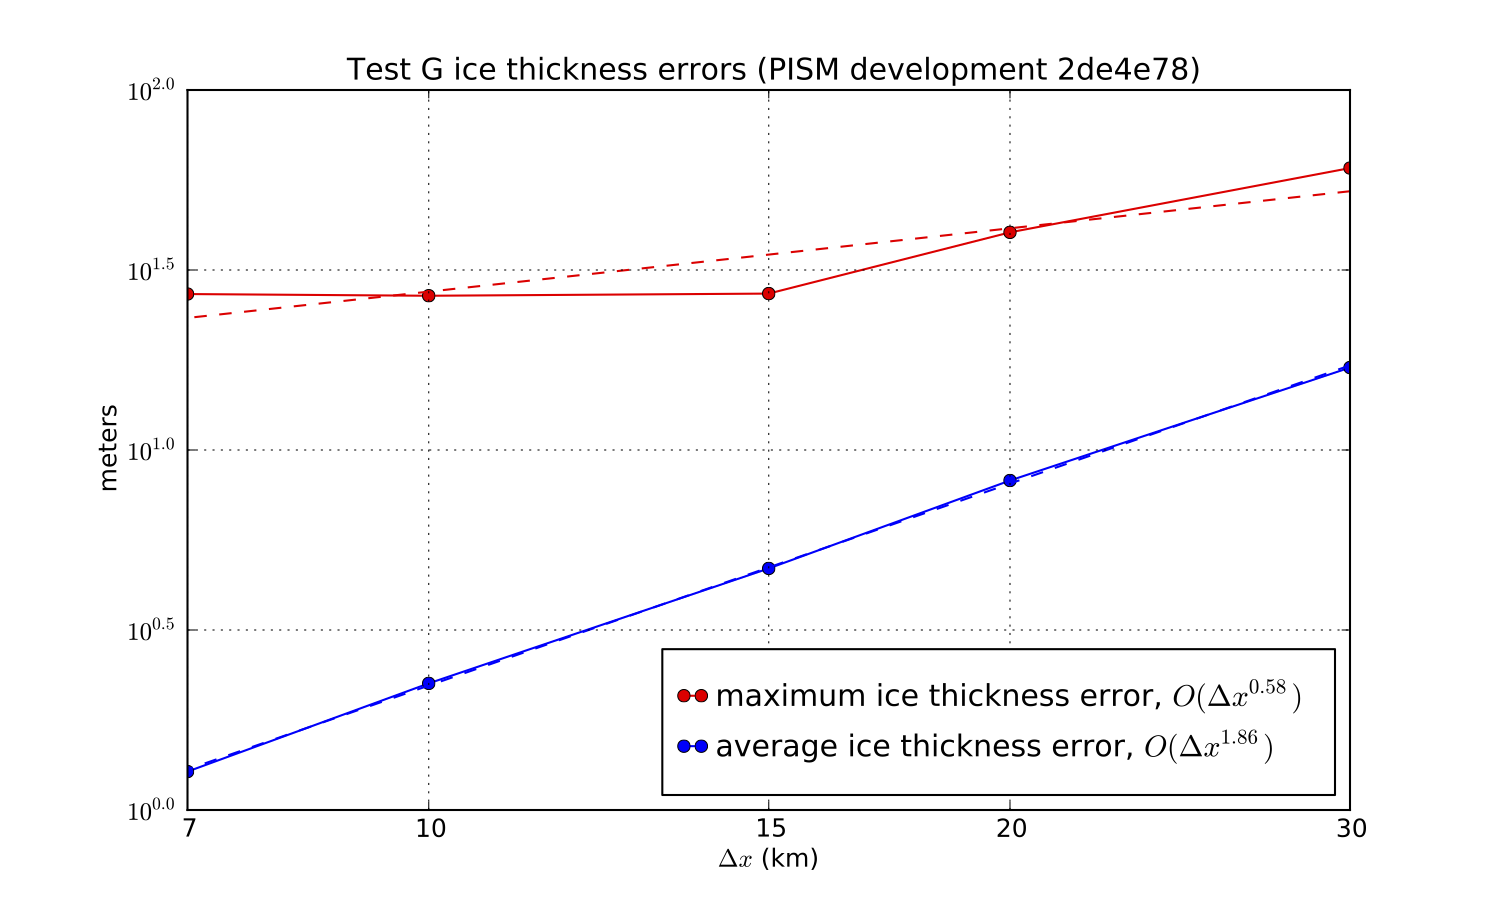
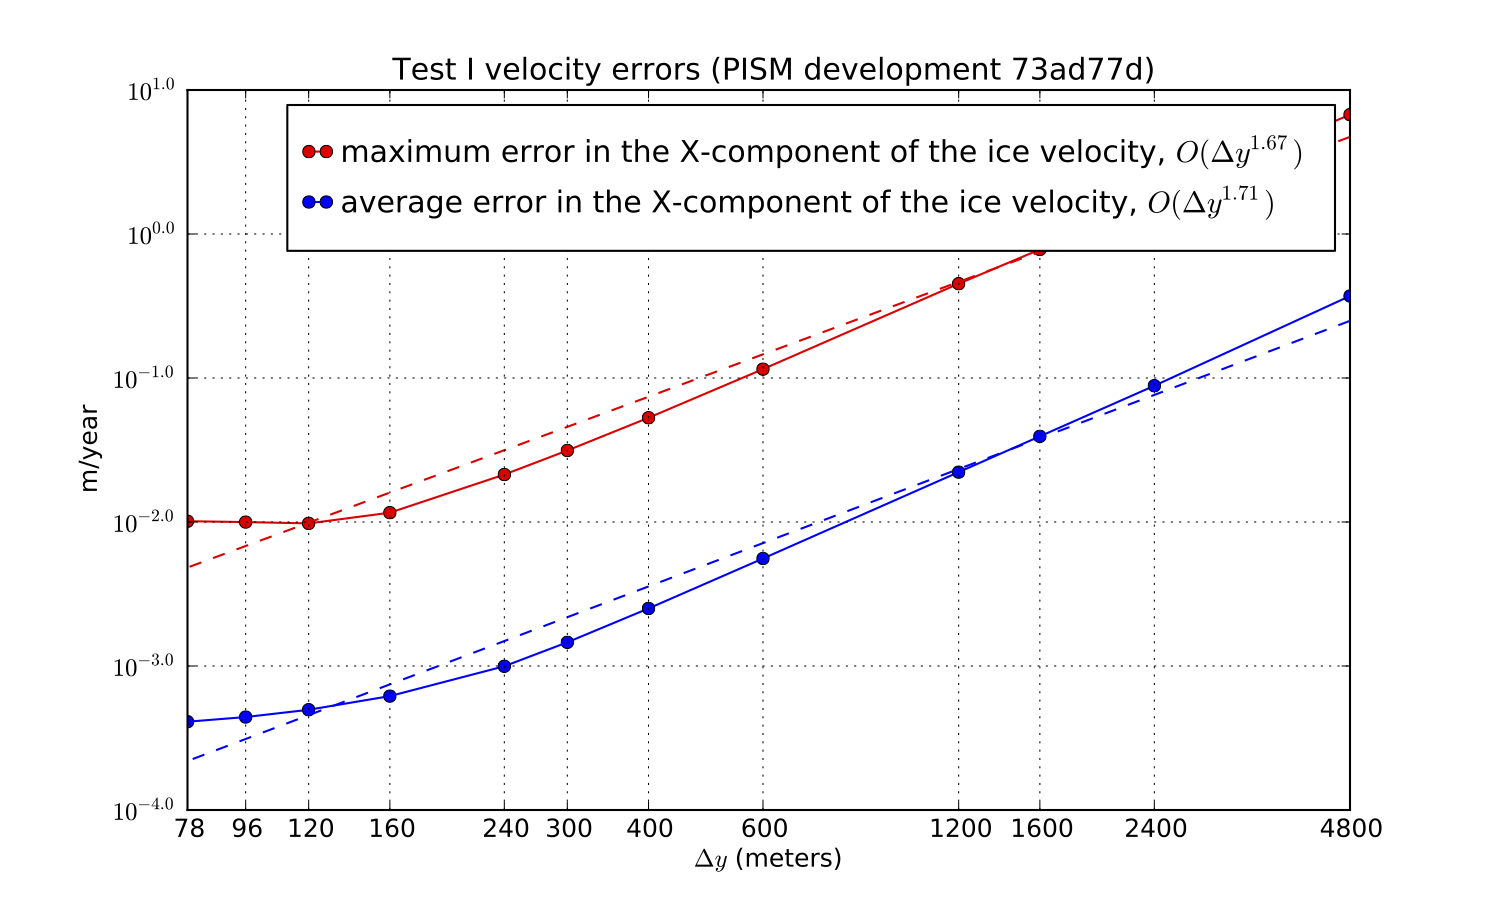
- Simplified geometry experiments
- Verification
- Validation case studies
- Example: A regional model of the Jakobshavn outlet glacier in Greenland
- Configuration parameters
- Diagnostic quantities
- Climate forcing
- Technical notes
- Contributing to PISM
- Authorship
- References