 \n",
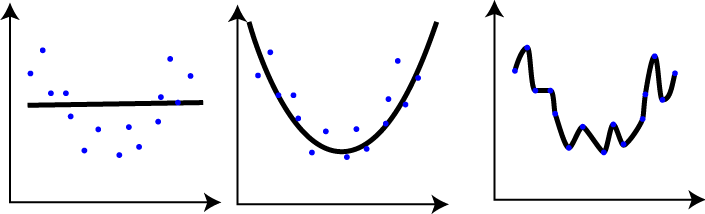
"_while we haven't used polynomials, there's still a balance for our models between simplicity and feature dependence_\n",
"\n",
"#### Why?\n",
"We should aim to keep our models as simple as possible in order to attribute the most gain. \n",
"Simple models are much easier to understand as well"
]
},
{
"cell_type": "markdown",
"metadata": {},
"source": [
"### How do we reduce the number of features in our data?\n",
"\n",
"There's a number of techniques available in sklearn that automate these processes for us:\n",
"\n",
"sklearn_helper | technique\n",
"---------------|----------\n",
"`VarianceThreshold` | Remove features with low variance, based on a tolerance level\n",
"`SelectKBest` | Select the best group of correlated features using `feature_selection` tools. K (as usual) is something you search for and define.\n",
"`L1 and Trees` | using fit_transform on any supervised learning algorithm that has it can drop features with low coefficients or importances.\n",
"\n",
"While SKlearn also has a `pipeline` module to _further_ automate this process for you, it is more recommended to explore the data first to get a sense of what you are working with. There's no magic button that says \"solve my problem,\" but if you are interested in automating a model fit (say, a nightly procedue on a deployed model with constantly updated data), then it might be something worth exploring. \n",
"\n",
"For each below we'll work through Iris and notice how it picks out the best features for us. We'll use iris because the data is well scaled (which otherwise requires finetuning) and relatively predictive (we know there are features more predictive than others).\n",
"\n",
"For each code sample below:\n",
"\n",
"1. Review what the code is doing. Consider opening up the help function or reading the documentation on sklearn.\n",
"2. find the `.shape` of the new array returned and compare to the original dataset. What columns did it end up keeping, vs removing?\n",
"3. Adjust the parameters. Do results change?\n",
"4. ** \\* **These are all considered data preprocessing steps. In your final project, what and where might you consider adding one of these processes?"
]
},
{
"cell_type": "code",
"execution_count": 2,
"metadata": {
"collapsed": false
},
"outputs": [],
"source": [
"import pandas as pd\n",
"def make_irisdf():\n",
" from sklearn.datasets import load_iris\n",
" from pandas import DataFrame\n",
" iris = load_iris()\n",
" df = DataFrame(iris.data, columns=iris.feature_names)\n",
" df['target'] = iris.target\n",
" return df\n",
"\n",
"iris = make_irisdf()"
]
},
{
"cell_type": "code",
"execution_count": 3,
"metadata": {
"collapsed": true
},
"outputs": [],
"source": [
"from sklearn import feature_selection"
]
},
{
"cell_type": "markdown",
"metadata": {},
"source": [
"#### `VarianceThreshold`\n",
"\n",
"Goals:\n",
"\n",
"1. What is variance?\n",
"2. How does changing the threshold change the fit_transform?"
]
},
{
"cell_type": "code",
"execution_count": 4,
"metadata": {
"collapsed": false
},
"outputs": [
{
"name": "stdout",
"output_type": "stream",
"text": [
"sepal length (cm) 0.685694\n",
"sepal width (cm) 0.188004\n",
"petal length (cm) 3.113179\n",
"petal width (cm) 0.582414\n",
"dtype: float64\n",
" sepal length (cm) sepal width (cm) petal length (cm) petal width (cm)\n",
"0 5.1 3.5 1.4 0.2\n",
"1 4.9 3.0 1.4 0.2\n",
"2 4.7 3.2 1.3 0.2\n",
"3 4.6 3.1 1.5 0.2\n",
"4 5.0 3.6 1.4 0.2\n",
"[[ 5.1 1.4]\n",
" [ 4.9 1.4]\n",
" [ 4.7 1.3]\n",
" [ 4.6 1.5]\n",
" [ 5. 1.4]]\n"
]
}
],
"source": [
"print iris.ix[:,:4].apply(lambda x: x.var())\n",
"print iris.ix[:,:4].head()\n",
"print feature_selection.VarianceThreshold(threshold=.6).fit_transform(iris.ix[:,:4])[:5]"
]
},
{
"cell_type": "markdown",
"metadata": {},
"source": [
"#### `SelectKBest`\n",
"Goals:\n",
"\n",
"1. while f test and chi2 are different tests, are the results the same?\n",
"2. How might you solve for k?"
]
},
{
"cell_type": "markdown",
"metadata": {},
"source": [
"_math sidebar:_\n",
"\n",
"$X^2 = \\dfrac{(O-E)^2}{E}$
\n",
"_while we haven't used polynomials, there's still a balance for our models between simplicity and feature dependence_\n",
"\n",
"#### Why?\n",
"We should aim to keep our models as simple as possible in order to attribute the most gain. \n",
"Simple models are much easier to understand as well"
]
},
{
"cell_type": "markdown",
"metadata": {},
"source": [
"### How do we reduce the number of features in our data?\n",
"\n",
"There's a number of techniques available in sklearn that automate these processes for us:\n",
"\n",
"sklearn_helper | technique\n",
"---------------|----------\n",
"`VarianceThreshold` | Remove features with low variance, based on a tolerance level\n",
"`SelectKBest` | Select the best group of correlated features using `feature_selection` tools. K (as usual) is something you search for and define.\n",
"`L1 and Trees` | using fit_transform on any supervised learning algorithm that has it can drop features with low coefficients or importances.\n",
"\n",
"While SKlearn also has a `pipeline` module to _further_ automate this process for you, it is more recommended to explore the data first to get a sense of what you are working with. There's no magic button that says \"solve my problem,\" but if you are interested in automating a model fit (say, a nightly procedue on a deployed model with constantly updated data), then it might be something worth exploring. \n",
"\n",
"For each below we'll work through Iris and notice how it picks out the best features for us. We'll use iris because the data is well scaled (which otherwise requires finetuning) and relatively predictive (we know there are features more predictive than others).\n",
"\n",
"For each code sample below:\n",
"\n",
"1. Review what the code is doing. Consider opening up the help function or reading the documentation on sklearn.\n",
"2. find the `.shape` of the new array returned and compare to the original dataset. What columns did it end up keeping, vs removing?\n",
"3. Adjust the parameters. Do results change?\n",
"4. ** \\* **These are all considered data preprocessing steps. In your final project, what and where might you consider adding one of these processes?"
]
},
{
"cell_type": "code",
"execution_count": 2,
"metadata": {
"collapsed": false
},
"outputs": [],
"source": [
"import pandas as pd\n",
"def make_irisdf():\n",
" from sklearn.datasets import load_iris\n",
" from pandas import DataFrame\n",
" iris = load_iris()\n",
" df = DataFrame(iris.data, columns=iris.feature_names)\n",
" df['target'] = iris.target\n",
" return df\n",
"\n",
"iris = make_irisdf()"
]
},
{
"cell_type": "code",
"execution_count": 3,
"metadata": {
"collapsed": true
},
"outputs": [],
"source": [
"from sklearn import feature_selection"
]
},
{
"cell_type": "markdown",
"metadata": {},
"source": [
"#### `VarianceThreshold`\n",
"\n",
"Goals:\n",
"\n",
"1. What is variance?\n",
"2. How does changing the threshold change the fit_transform?"
]
},
{
"cell_type": "code",
"execution_count": 4,
"metadata": {
"collapsed": false
},
"outputs": [
{
"name": "stdout",
"output_type": "stream",
"text": [
"sepal length (cm) 0.685694\n",
"sepal width (cm) 0.188004\n",
"petal length (cm) 3.113179\n",
"petal width (cm) 0.582414\n",
"dtype: float64\n",
" sepal length (cm) sepal width (cm) petal length (cm) petal width (cm)\n",
"0 5.1 3.5 1.4 0.2\n",
"1 4.9 3.0 1.4 0.2\n",
"2 4.7 3.2 1.3 0.2\n",
"3 4.6 3.1 1.5 0.2\n",
"4 5.0 3.6 1.4 0.2\n",
"[[ 5.1 1.4]\n",
" [ 4.9 1.4]\n",
" [ 4.7 1.3]\n",
" [ 4.6 1.5]\n",
" [ 5. 1.4]]\n"
]
}
],
"source": [
"print iris.ix[:,:4].apply(lambda x: x.var())\n",
"print iris.ix[:,:4].head()\n",
"print feature_selection.VarianceThreshold(threshold=.6).fit_transform(iris.ix[:,:4])[:5]"
]
},
{
"cell_type": "markdown",
"metadata": {},
"source": [
"#### `SelectKBest`\n",
"Goals:\n",
"\n",
"1. while f test and chi2 are different tests, are the results the same?\n",
"2. How might you solve for k?"
]
},
{
"cell_type": "markdown",
"metadata": {},
"source": [
"_math sidebar:_\n",
"\n",
"$X^2 = \\dfrac{(O-E)^2}{E}$\n", "O = observed frequencies
\n", "E = expected frequencies
" ] }, { "cell_type": "code", "execution_count": 5, "metadata": { "collapsed": false }, "outputs": [ { "name": "stdout", "output_type": "stream", "text": [ " sepal length (cm) sepal width (cm) petal length (cm) petal width (cm)\n", "0 5.1 3.5 1.4 0.2\n", "1 4.9 3.0 1.4 0.2\n", "2 4.7 3.2 1.3 0.2\n", "3 4.6 3.1 1.5 0.2\n", "4 5.0 3.6 1.4 0.2\n", "sepal length (cm) 119.264502\n", "sepal width (cm) 47.364461\n", "petal length (cm) 1179.034328\n", "petal width (cm) 959.324406\n", "dtype: float64\n", "[[ 5.1 1.4 0.2]\n", " [ 4.9 1.4 0.2]\n", " [ 4.7 1.3 0.2]\n", " [ 4.6 1.5 0.2]\n", " [ 5. 1.4 0.2]]\n", "sepal length (cm) 10.817821\n", "sepal width (cm) 3.594499\n", "petal length (cm) 116.169847\n", "petal width (cm) 67.244828\n", "dtype: float64\n", "[[ 5.1 1.4 0.2]\n", " [ 4.9 1.4 0.2]\n", " [ 4.7 1.3 0.2]\n", " [ 4.6 1.5 0.2]\n", " [ 5. 1.4 0.2]]\n" ] } ], "source": [ "print iris.ix[:,:4].head()\n", "ftest = feature_selection.SelectKBest(score_func=feature_selection.f_classif, k=3)\n", "print pd.Series(ftest.fit(iris.ix[:,:4], iris['target']).scores_, index=iris.ix[:,:4].columns)\n", "print ftest.fit_transform(iris.ix[:,:4], iris['target'])[:5]\n", "\n", "chi = feature_selection.SelectKBest(score_func=feature_selection.chi2, k=3)\n", "print pd.Series(chi.fit(iris.ix[:,:4], iris['target']).scores_, index=iris.ix[:,:4].columns)\n", "print chi.fit_transform(iris.ix[:,:4], iris['target'])[:5]" ] }, { "cell_type": "markdown", "metadata": {}, "source": [ "#### `LogisticRegression`\n", "Goals:\n", "\n", "1. How is L1 deciding to keep features?\n", "2. How does changing C change the fit_transform results?" ] }, { "cell_type": "code", "execution_count": 6, "metadata": { "collapsed": false }, "outputs": [ { "name": "stdout", "output_type": "stream", "text": [ " sepal length (cm) sepal width (cm) petal length (cm) petal width (cm)\n", "0 5.1 3.5 1.4 0.2\n", "1 4.9 3.0 1.4 0.2\n", "2 4.7 3.2 1.3 0.2\n", "3 4.6 3.1 1.5 0.2\n", "4 5.0 3.6 1.4 0.2\n", " sepal length (cm) sepal width (cm) petal length (cm) petal width (cm)\n", "0 0.000000 1.124342 -1.344433 0\n", "1 0.000000 -0.386422 0.122768 0\n", "2 -0.987901 0.000000 1.277067 0\n", "[[ 3.5 1.4]\n", " [ 3. 1.4]\n", " [ 3.2 1.3]\n", " [ 3.1 1.5]\n", " [ 3.6 1.4]]\n" ] } ], "source": [ "from sklearn import linear_model as lm\n", "clf = lm.LogisticRegression(penalty='L1', C=0.1)\n", "print iris.ix[:,:4].head()\n", "\n", "print pd.DataFrame(clf.fit(iris.ix[:,:4], iris['target']).coef_, columns=iris.ix[:,:4].columns)\n", "print clf.fit_transform(iris.ix[:,:4], iris['target'])[:5]" ] }, { "cell_type": "markdown", "metadata": {}, "source": [ "#### `DecisionTreeClassifier`\n", "Goals:\n", "\n", "1. What is Gini Importance?\n", "2. How does fit_transform decide what features to keep?\n", "3. How does changing the tree depth (or other preprocessing tools) change the result?" ] }, { "cell_type": "code", "execution_count": 7, "metadata": { "collapsed": false }, "outputs": [ { "name": "stdout", "output_type": "stream", "text": [ " sepal length (cm) sepal width (cm) petal length (cm) petal width (cm)\n", "0 5.1 3.5 1.4 0.2\n", "1 4.9 3.0 1.4 0.2\n", "2 4.7 3.2 1.3 0.2\n", "3 4.6 3.1 1.5 0.2\n", "4 5.0 3.6 1.4 0.2\n", "sepal length (cm) 0.013514\n", "sepal width (cm) 0.000000\n", "petal length (cm) 0.558165\n", "petal width (cm) 0.428322\n", "dtype: float64\n", "[[ 0.2]\n", " [ 0.2]\n", " [ 0.2]\n", " [ 0.2]\n", " [ 0.2]]\n" ] } ], "source": [ "from sklearn import tree\n", "clf = tree.DecisionTreeClassifier(max_depth=4)\n", "print iris.ix[:,:4].head()\n", "print pd.Series(clf.fit(iris.ix[:,:4], iris['target']).feature_importances_, index=iris.ix[:,:4].columns)\n", "print clf.fit_transform(iris.ix[:,:4], iris['target'])[:5]" ] }, { "cell_type": "markdown", "metadata": {}, "source": [ "### What if we believe there are hidden features in our data?\n", "_I don't want to get rid of them!_\n", "\n", "Then Principal Component Analysis to the rescue!" ] }, { "cell_type": "markdown", "metadata": {}, "source": [ "\n", "
What is principal component analysis?
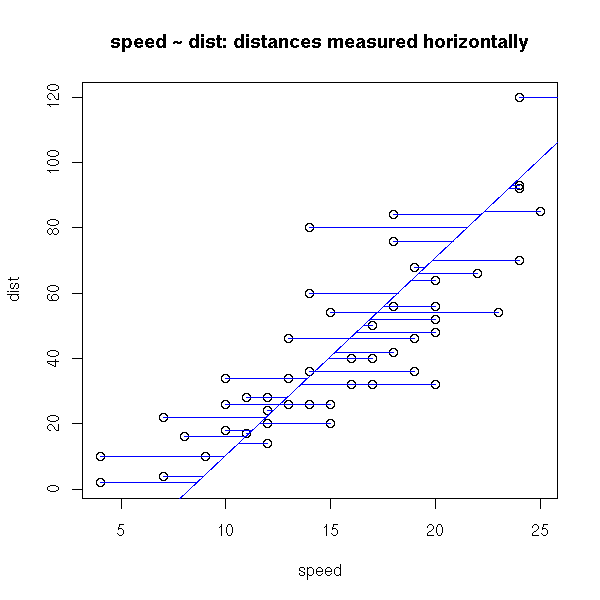
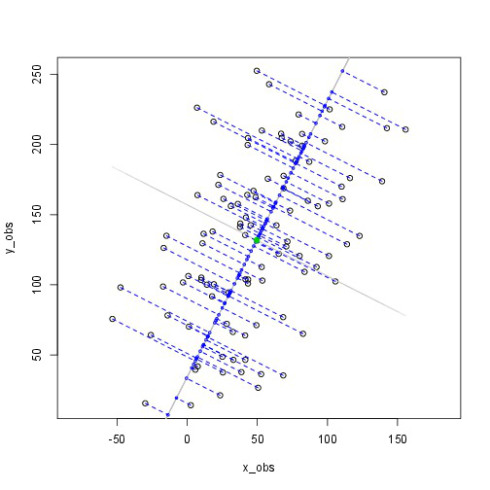
\n", "comparing how we measure residuals in regressions vs noise in pca\n", "\n",
" \n",
"
\n",
" \n",
"
\n",
"
\n",
"\n",
"\n",
"\n", "
\n",
"
\n",
"\n",
"
\n",
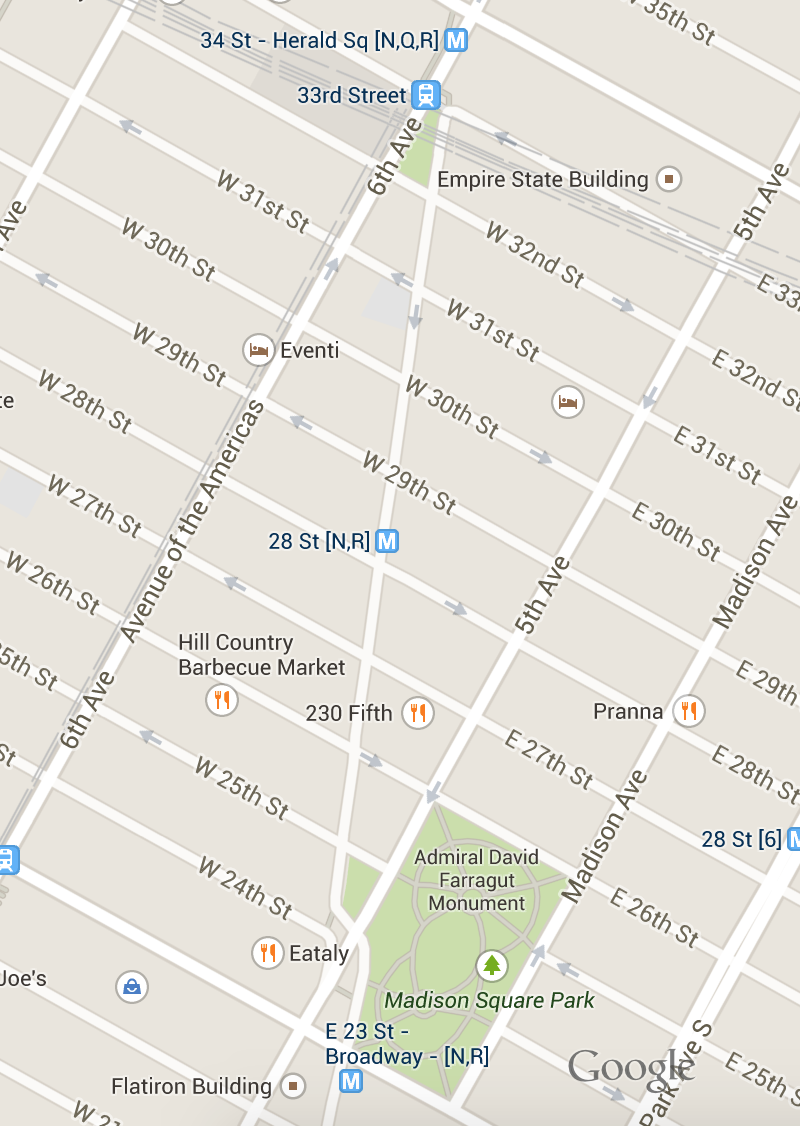
" Consider Broadway...
\n", "Manhattan is built on a grid system, with the exception of a couple key points:
\n", "- \n",
"
- West Village (that's its own story) \n", "
- Broadway \n", "
If we needed to get from Harold Square to Eataly, what is easier to explain?
\n", "- \n",
"
- Walk down 6th avenue until 24th street and then walk east until the park \n", "
- Walk down Broadway until you get to Eataly at 24th \n", "
Why is that one easier to explain?
\n", "\n",
"  \n",
"
\n",
"
\n",
"\n",
" " ] }, { "cell_type": "markdown", "metadata": {}, "source": [ "### When should we use it?\n", "PCA is a common technique already used in your day to day:\n", "\n", "* compressing images or files\n", "* Want to reduce computational expense\n", "* Recognition (signal processing, speach, computer vision)\n", "* Bioinformatics (microarray analysis)" ] }, { "cell_type": "markdown", "metadata": {}, "source": [ "
 "
]
},
{
"cell_type": "markdown",
"metadata": {},
"source": [
"### How does it work?\n",
"\n",
"Recall that variance is a 1-dimensional metric describing the average distance from the mean. **Covariance** is a representation of variance with respect to other features.\n",
"\n",
"If variance is a summary of one metric, and a correlation matrix is a square (the relationships of features against each other), what is our expected shape of the covariance matrix?\n",
"\n",
"
"
]
},
{
"cell_type": "markdown",
"metadata": {},
"source": [
"### How does it work?\n",
"\n",
"Recall that variance is a 1-dimensional metric describing the average distance from the mean. **Covariance** is a representation of variance with respect to other features.\n",
"\n",
"If variance is a summary of one metric, and a correlation matrix is a square (the relationships of features against each other), what is our expected shape of the covariance matrix?\n",
"\n",
"