Experiment Setup
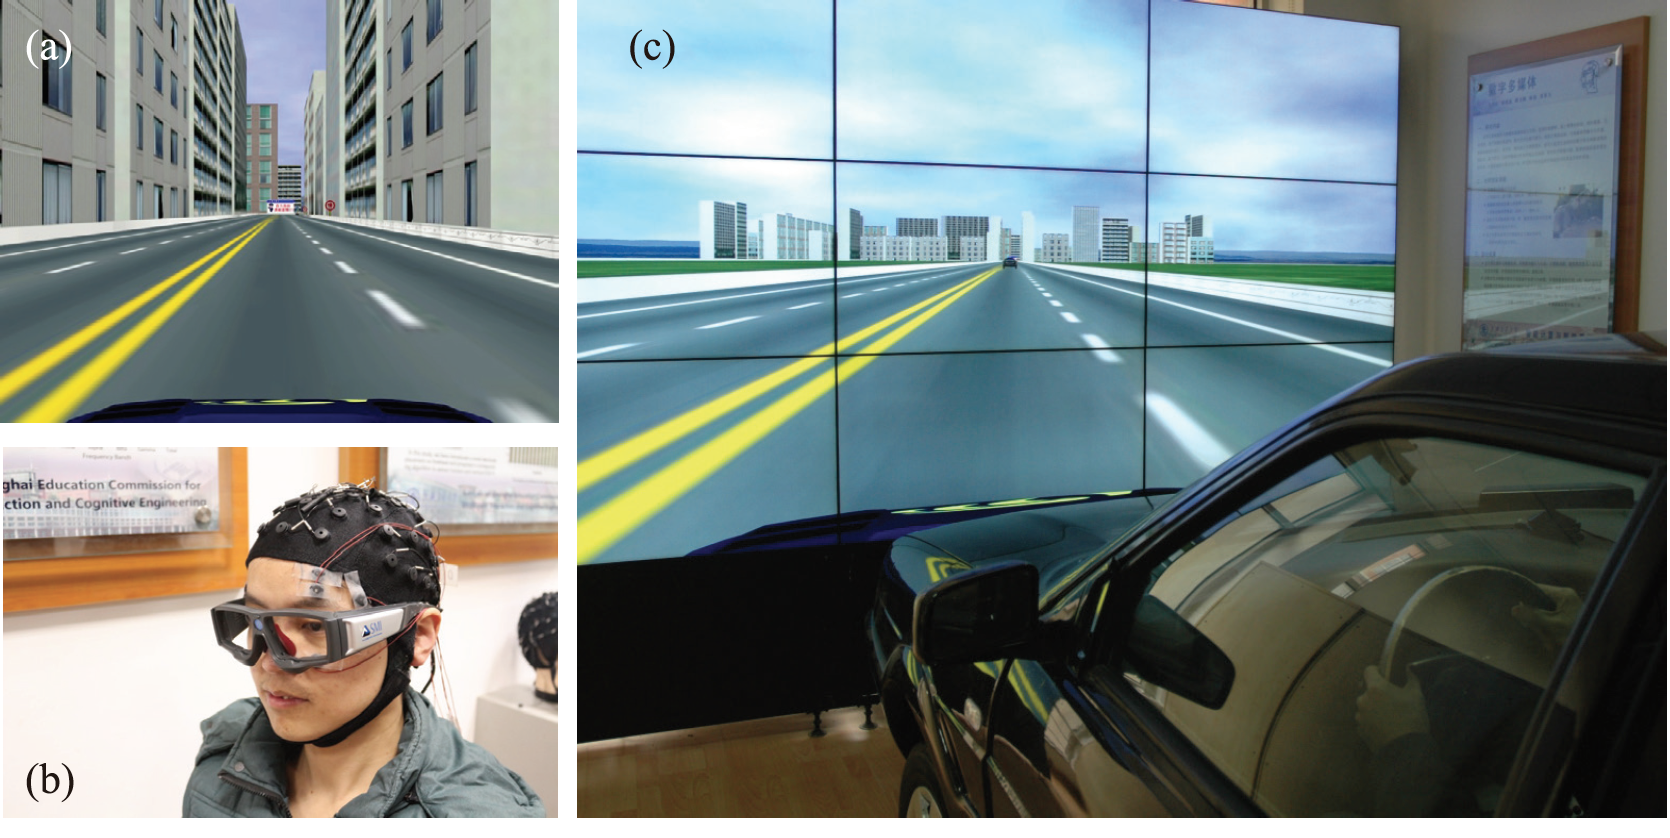
We developed a simulated driving system to collect the EEG and EOG signals, as well as to label the signals.
A four-lane highway scene is shown on a large
LCD screen in front of a real vehicle without the unnecessary
engine and other components. The vehicle movements
in the software are controlled by the steering wheel and gas
pedal, and the scenes are simultaneously updated according
to the participants’ operations. The road is primarily straight
and monotonous to induce fatigue in the subjects more easily.
The simulated driving system and the experimental scene are:
|
Most experiments were performed in the early afternoon
after lunch to induce fatigue easily when
the circadian rhythm of sleepiness reached its peak. The duration of the entire experiments were
approximately 2h. The participants were asked to drive the car
in a simulated, dull environments.
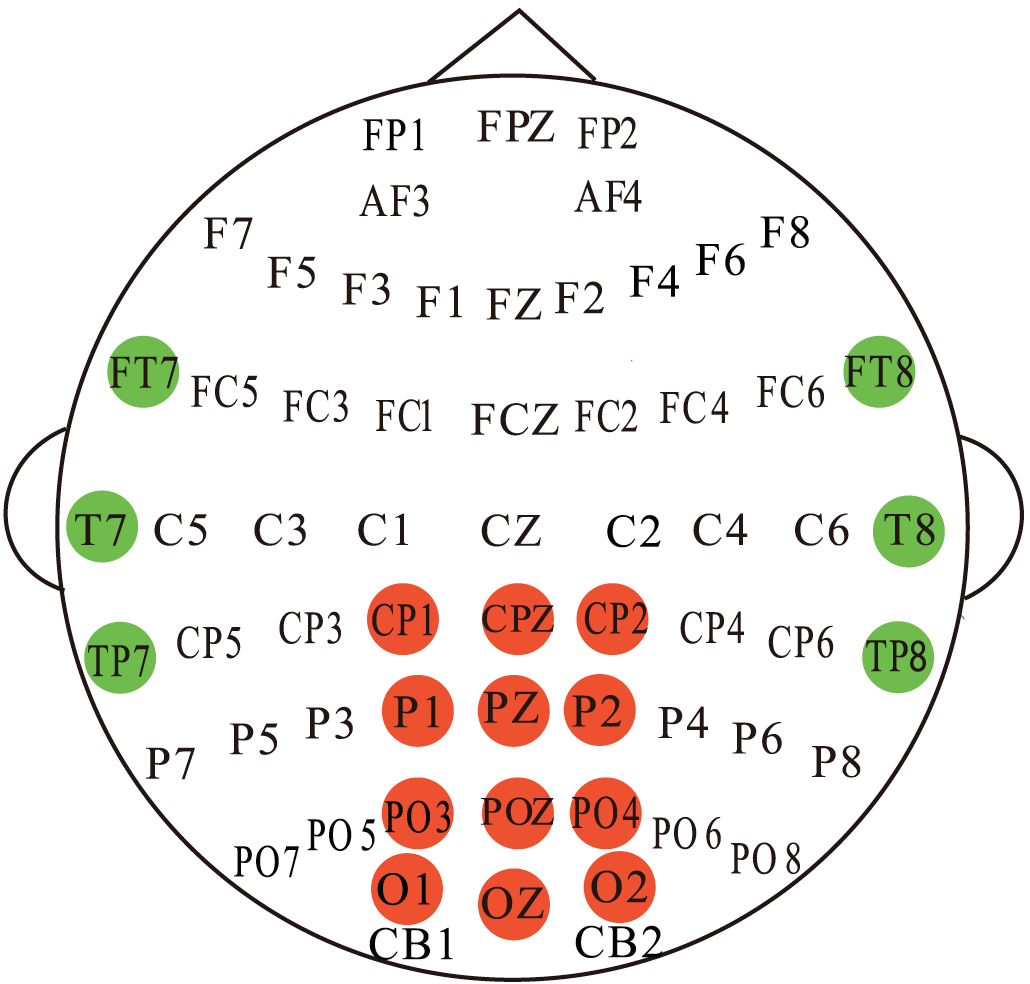
We used Neuroscan system to record the EEG and EOG during the experiments.
The channels that are used in the features extraction are shown as follows.
Additionally, the participants wear
SMI eye-tracking glasses so that
their eye movements were also recorded. We then calculate the PERCLOS indicator values of the participants during the
experiment and use them as the vigilance labels.
Feature Extraction
For the temporal and occipital channels, PSD and DE features are directly extracted at the frequency bands referred
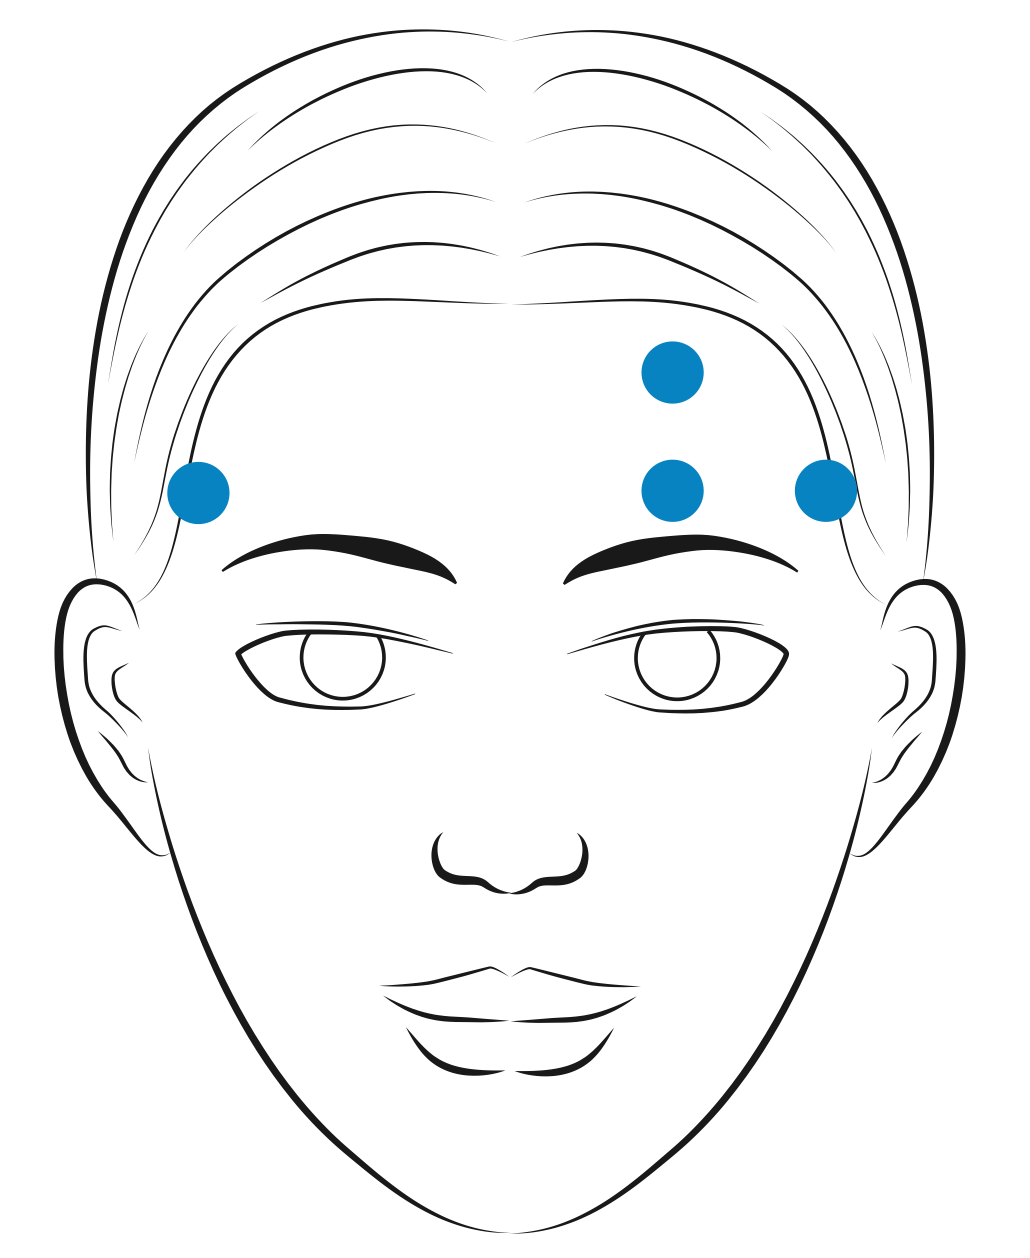
above. For the forehead channels, we decompose the original EEG signals to forehead EEG signals
(which is mostly related to the subjects' brain activity) and
EOG signals (which is mostly related to the subjects' eye movements induced electrical field fluctuation, by means of
ICA and minus methods. The EOG components are then used to produce 36 eye movement related features.
The
SMI eye-tracking glasses provides information about eye closure, so we can simply calculate the PERCLOS labels
by the following formulation.
Dataset Summary
The SEED-VIG dataset is composed of four parts.
-
EEG features include:
-
EEG_Feature_2Hz: EEG features (power spectral density: PSD, differential entropy: DE)
from the total frequency band (1~50 Hz) with a 2 Hz frequency resolution.
The fields "psd_movingAve", "psd_LDS", "de_movingAve", and "de_LDS" indicate PSD with moving average,
PSD with linear dynamic system, DE with moving average, and DE with linear dynamic system, respectively.
The data format is channel*sample_number*frequency_bands (17*885*25).
The first 1-5 in the first dimension 'channel' are corresponding to temporal brain areas,
and the last 7-17 are corresponding to posterior brain areas.
-
EEG_Feature_5Bands: This is similar to the EEG_feature_2Hz file except that EEG features (PSD, DE)
are extracted from five frequency bands: delta (1~4 Hz),
theta (4~8 Hz), alpha (8~14 Hz), beta (14~31 Hz), and gamma (31~50 Hz).
The data format is channel*sample number*frequency bands (17*885*5).
-
Forehead EEG feature files have similar architecture with EEG feature's, but there has only four channels for the
data tensor (4*885*25 and 4*885*5).
-
EOG features. The fields "features_table_ica", "features_table_minus", and "features_table_icav_minh"
indicate forehead EOG features corresponding to different VEO and HEO separation methods using ICA and
minus approaches. The data format is sample number*feature dimension (885*36).
-
The PERCLOS label files contain continuous vigilance labels (range from 0 to 1) calculated from eye
tracking data.
Download
 Download SEED-VIG
Reference
If you feel the dataset helpful for your study, please add the following reference to your publications.
1. Wei-Long Zheng and Bao-Liang Lu, A multimodal approach to estimating vigilance using EEG and forehead EOG.
Journal of Neural Engineering, 14(2): 026017, 2017.
[link]
[BibTex]