{
"cells": [
{
"cell_type": "markdown",
"metadata": {
"collapsed": true
},
"source": [
"# Using Google BigQuery With Plotly and Pandas"
]
},
{
"cell_type": "markdown",
"metadata": {},
"source": [
"In this IPython Notebook, we will learn about integrating Google's BigQuery with Plotly.\n",
"\n",
"We will query a BigQuery dataset and visualize the results using the Plotly library."
]
},
{
"cell_type": "markdown",
"metadata": {},
"source": [
"### What is BigQuery?\n",
"\n",
"It's a service by Google, which enables analysis of massive datasets. You can use the traditional SQL-like language to query the data.\n",
"\n",
"You can host your own data on BigQuery to use the super fast performance at scale."
]
},
{
"cell_type": "markdown",
"metadata": {},
"source": [
"### Google BigQuery Public Datasets\n",
"\n",
"There are [a few datasets](https://cloud.google.com/bigquery/public-data/) stored in BigQuery, available for general public to use.\n",
"\n",
"Some of the publicly available datasets are:\n",
"- Hacker News (stories and comments)\n",
"- USA Baby Names\n",
"- GitHub activity data\n",
"- USA disease surveillance"
]
},
{
"cell_type": "markdown",
"metadata": {},
"source": [
"We will use the [Hacker News](https://cloud.google.com/bigquery/public-data/hacker-news) dataset for our analysis."
]
},
{
"cell_type": "code",
"execution_count": 1,
"metadata": {
"collapsed": true
},
"outputs": [],
"source": [
"import pandas as pd\n",
"\n",
"# to communicate with Google BigQuery\n",
"from pandas.io import gbq"
]
},
{
"cell_type": "code",
"execution_count": 2,
"metadata": {
"collapsed": true
},
"outputs": [],
"source": [
"import plotly.plotly as py\n",
"import plotly.graph_objs as go\n",
"from plotly.tools import FigureFactory as FF"
]
},
{
"cell_type": "markdown",
"metadata": {},
"source": [
"### Prerequisites\n",
"\n",
"You need to have the following libraries:\n",
"* [python-gflags](http://code.google.com/p/python-gflags/)\n",
"* httplib2\n",
"* google-api-python-client\n",
"\n",
"#### Create Project\n",
"\n",
"A project can be created on the [Google Developer Console](https://console.developers.google.com/iam-admin/projects).\n",
"\n",
"#### Enable BigQuery API\n",
"\n",
"You need to activate the BigQuery API for the project."
]
},
{
"cell_type": "markdown",
"metadata": {},
"source": [
"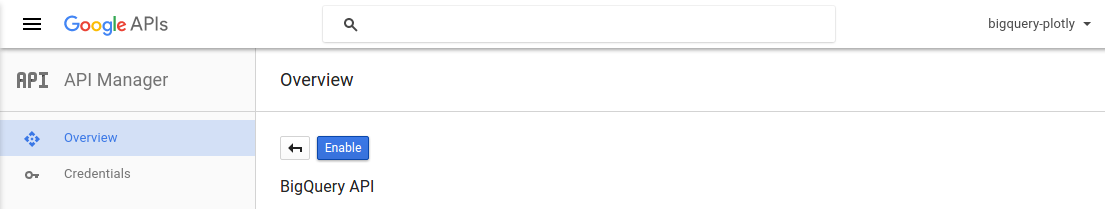"
]
},
{
"cell_type": "markdown",
"metadata": {},
"source": [
"You will have find the `Project ID` for your project to get the queries working.\n",
"\n",
"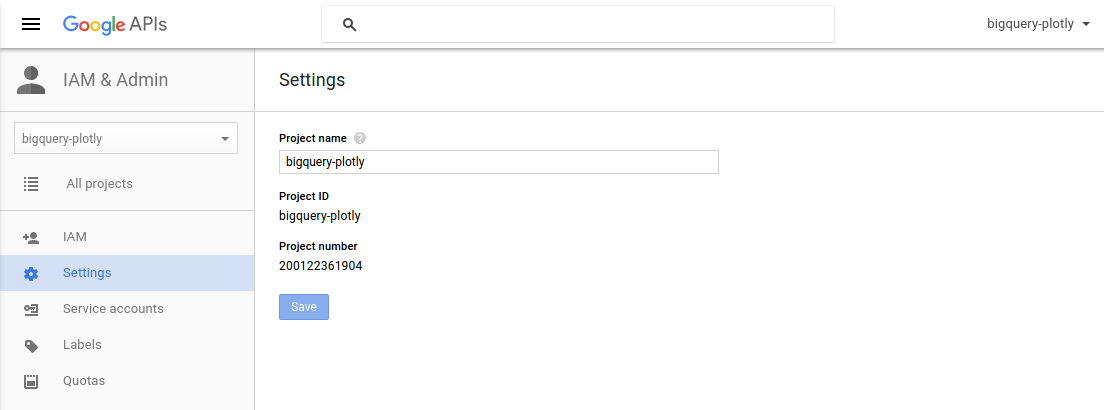"
]
},
{
"cell_type": "markdown",
"metadata": {
"collapsed": true
},
"source": [
"project_id = 'bigquery-plotly'"
]
},
{
"cell_type": "markdown",
"metadata": {},
"source": [
"### Top 10 Most Active Users on Hacker News (by total stories submitted)\n",
"\n",
"We will select the top 10 high scoring `author`s and their respective `score` values."
]
},
{
"cell_type": "code",
"execution_count": 4,
"metadata": {
"collapsed": true
},
"outputs": [],
"source": [
"top10_active_users_query = \"\"\"\n",
"SELECT\n",
" author AS User,\n",
" count(author) as Stories\n",
"FROM\n",
" [fh-bigquery:hackernews.stories]\n",
"GROUP BY\n",
" User\n",
"ORDER BY\n",
" Stories DESC\n",
"LIMIT\n",
" 10\n",
"\"\"\""
]
},
{
"cell_type": "markdown",
"metadata": {},
"source": [
"The `pandas.gbq` module provides a method `read_gbq` to query the BigQuery stored dataset and stores the result as a `DataFrame`."
]
},
{
"cell_type": "code",
"execution_count": 5,
"metadata": {
"collapsed": false,
"scrolled": true
},
"outputs": [
{
"name": "stdout",
"output_type": "stream",
"text": [
"Requesting query... ok.\n",
"Query running...\n",
" Elapsed 8.74 s. Waiting...\n",
"Query done.\n",
"Cache hit.\n",
"\n",
"Retrieving results...\n",
" Got page: 1; 100.0% done. Elapsed 9.36 s.\n",
"Got 10 rows.\n",
"\n",
"Total time taken 9.37 s.\n",
"Finished at 2016-07-19 17:28:38.\n"
]
}
],
"source": [
"try:\n",
" top10_active_users_df = gbq.read_gbq(top10_active_users_query, project_id=project_id)\n",
"except:\n",
" print 'Error reading the dataset'"
]
},
{
"cell_type": "markdown",
"metadata": {},
"source": [
"Here is the resultant `DataFrame` from the query."
]
},
{
"cell_type": "code",
"execution_count": 6,
"metadata": {
"collapsed": false
},
"outputs": [
{
"data": {
"text/html": [
"\n",
"
\n",
" \n",
" \n",
" | \n",
" User | \n",
" Stories | \n",
"
\n",
" \n",
" \n",
" \n",
" | 0 | \n",
" cwan | \n",
" 7077 | \n",
"
\n",
" \n",
" | 1 | \n",
" shawndumas | \n",
" 6602 | \n",
"
\n",
" \n",
" | 2 | \n",
" evo_9 | \n",
" 5659 | \n",
"
\n",
" \n",
" | 3 | \n",
" nickb | \n",
" 4322 | \n",
"
\n",
" \n",
" | 4 | \n",
" iProject | \n",
" 4266 | \n",
"
\n",
" \n",
" | 5 | \n",
" bootload | \n",
" 4212 | \n",
"
\n",
" \n",
" | 6 | \n",
" edw519 | \n",
" 3844 | \n",
"
\n",
" \n",
" | 7 | \n",
" ColinWright | \n",
" 3766 | \n",
"
\n",
" \n",
" | 8 | \n",
" nreece | \n",
" 3724 | \n",
"
\n",
" \n",
" | 9 | \n",
" tokenadult | \n",
" 3659 | \n",
"
\n",
" \n",
"
\n",
"
\n",
"
\n",
" \n",
" \n",
" | \n",
" domain | \n",
" stories | \n",
"
\n",
" \n",
" \n",
" \n",
" | 0 | \n",
" .com | \n",
" 1324329 | \n",
"
\n",
" \n",
" | 1 | \n",
" .org | \n",
" 120716 | \n",
"
\n",
" \n",
" | 2 | \n",
" None | \n",
" 111744 | \n",
"
\n",
" \n",
" | 3 | \n",
" .net | \n",
" 58754 | \n",
"
\n",
" \n",
" | 4 | \n",
" .co.uk | \n",
" 43955 | \n",
"
\n",
" \n",
" | 5 | \n",
" .io | \n",
" 23507 | \n",
"
\n",
" \n",
" | 6 | \n",
" .edu | \n",
" 14727 | \n",
"
\n",
" \n",
" | 7 | \n",
" .co | \n",
" 10692 | \n",
"
\n",
" \n",
" | 8 | \n",
" .me | \n",
" 10565 | \n",
"
\n",
" \n",
" | 9 | \n",
" .info | \n",
" 8121 | \n",
"
\n",
" \n",
"
\n",
"