# ◢ Prisme Analytics
[An Open Source, privacy-focused and progressive analytics service.](https://www.prismeanalytics.com/docs/next/)
[Documentation](https://www.prismeanalytics.com/docs)
|
[Live demo](https://app.prismeanalytics.com/grafana)
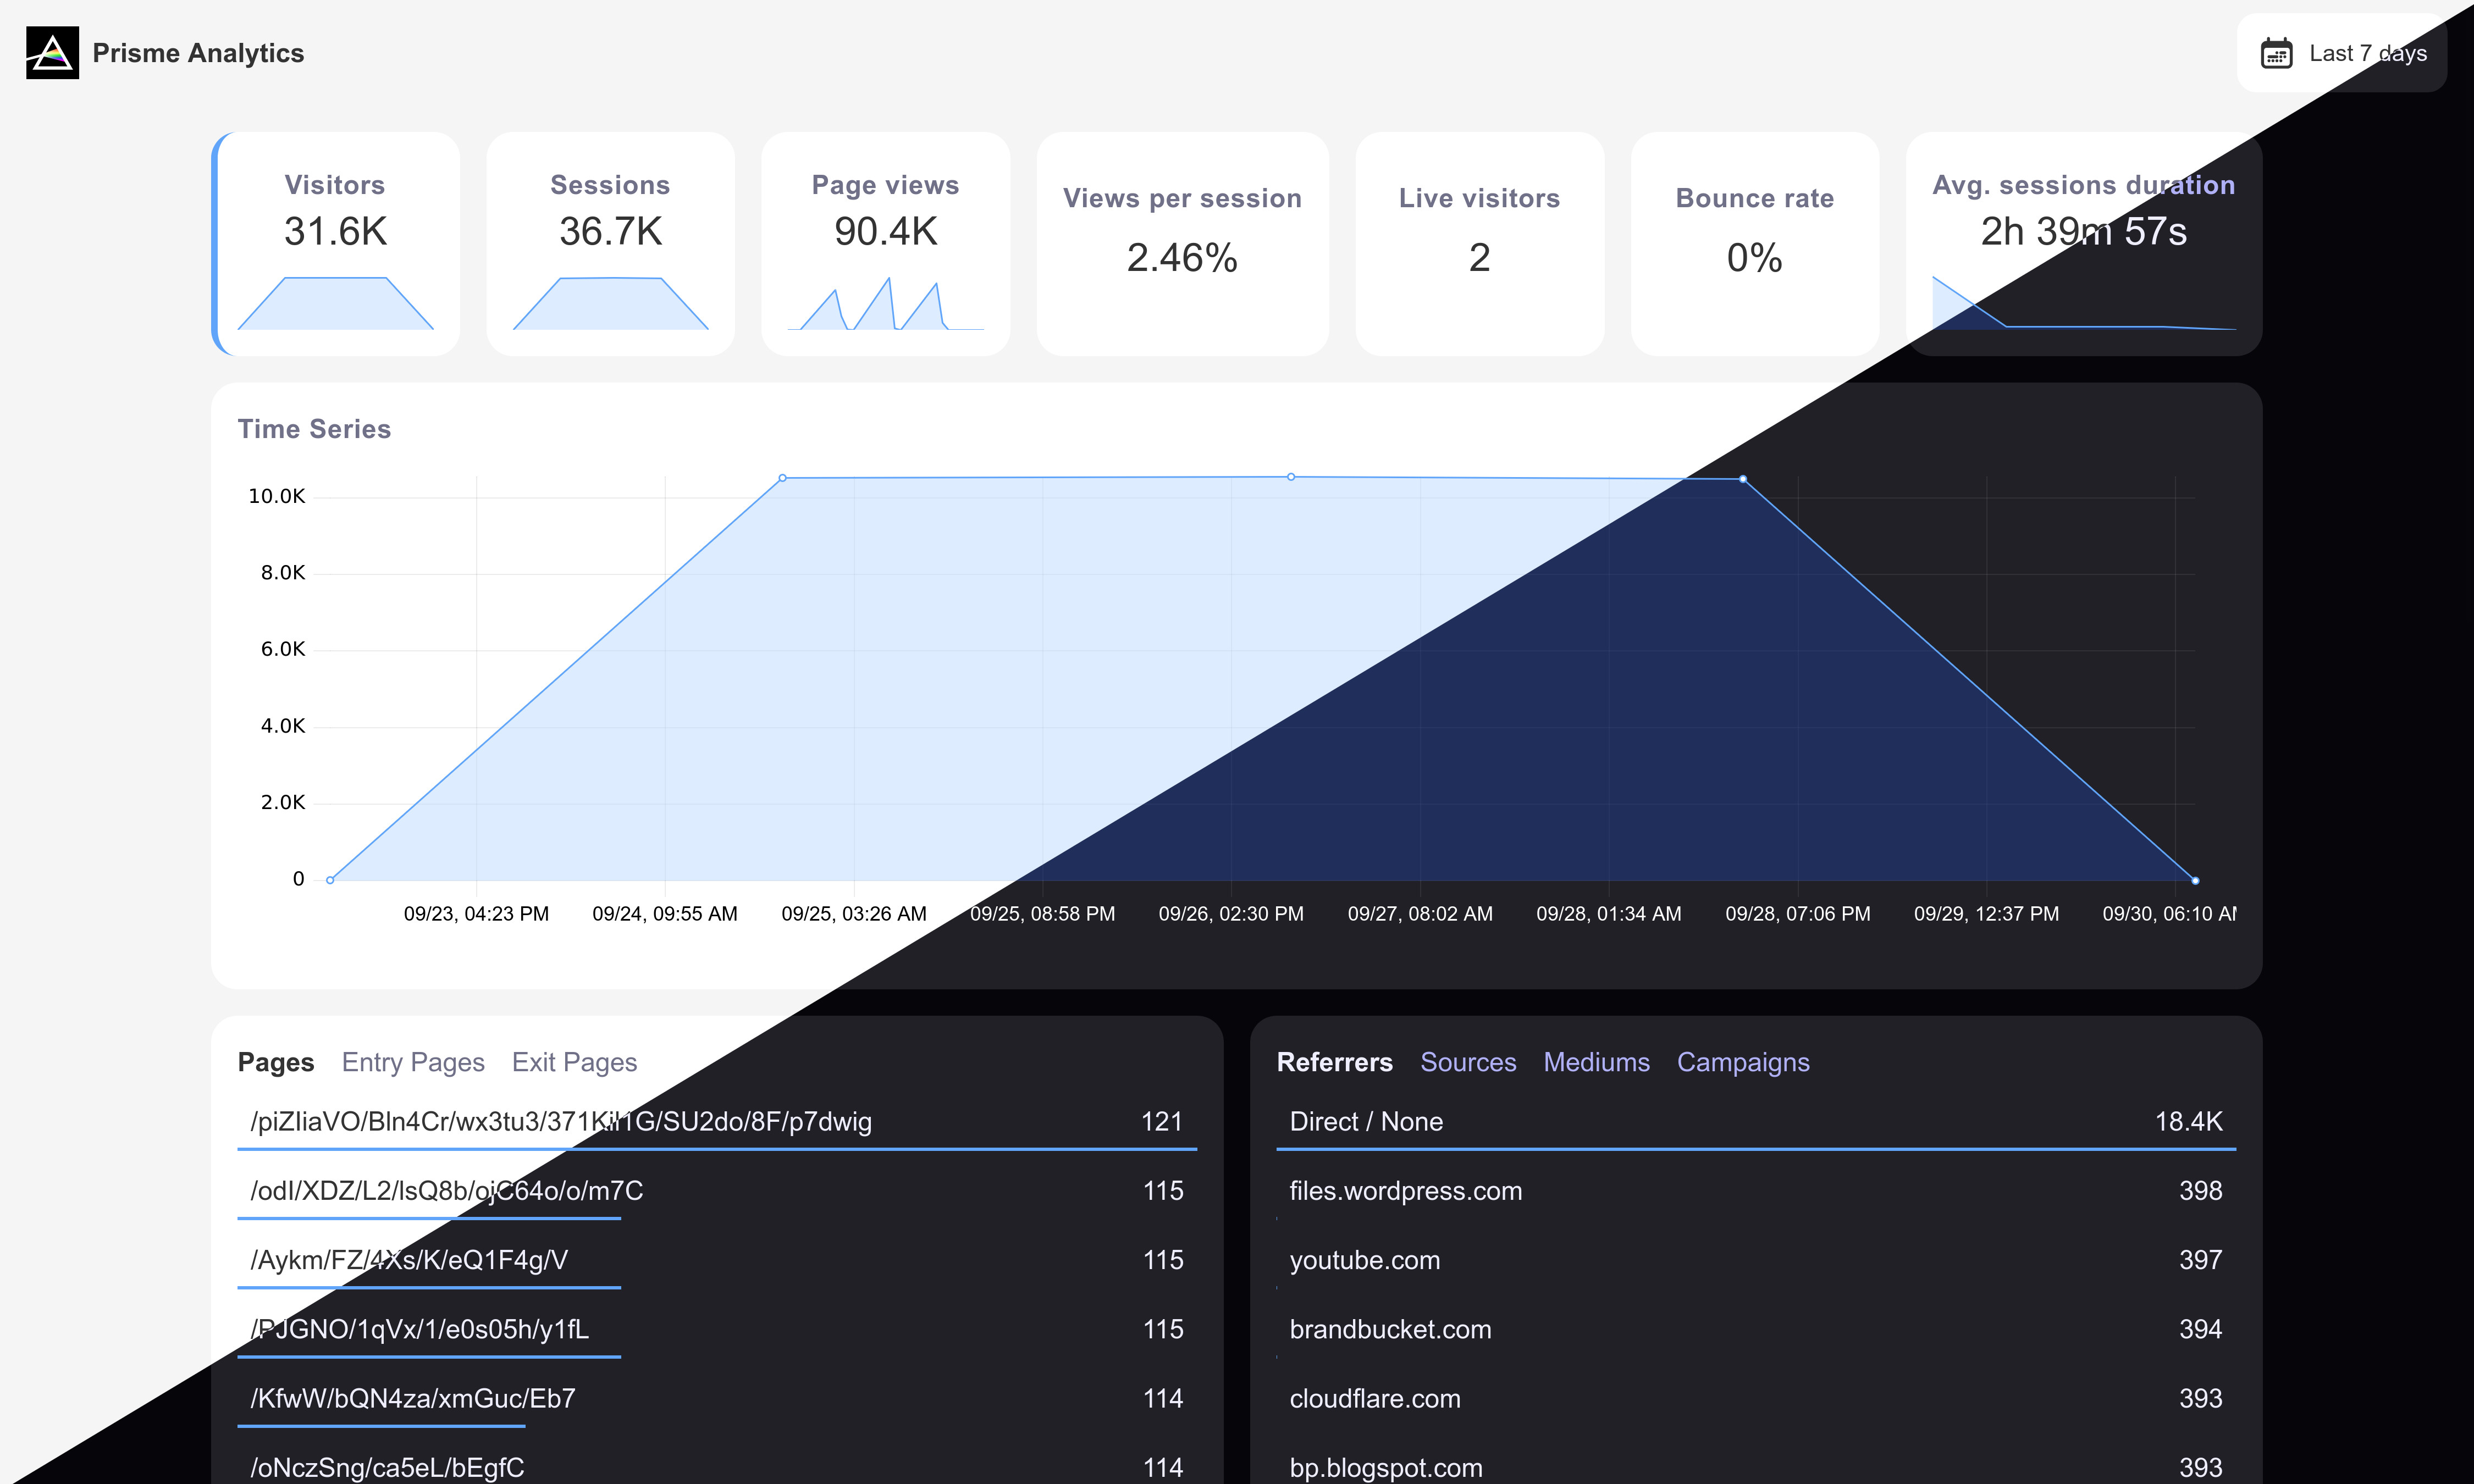
## Why Prisme ?
Here's what makes Prisme a great alternative to other analytics:
* **Easy setup**: Gain valuable insights into your website or web application
after a 3-minutes setup.
* **Simple analytics**: Easy to use dashboards with filters and definition for
each metrics.
* **Analytics that matter**: Custom events and dashboards gives you the
flexibility to measure what matters most, providing personalized insights to
inform your business decisions.
* **Privacy-focused**: Worry-free GDPR, PPCA, PECR and Shrems II compliance with
cookie-less analytics that collect only anonymized data.
* **Lightweight**: Prisme tracking script is around 2kB (~22x smaller than
Google Analytics) and single pixel image returned for javascript less tracking
is 35 bytes.
* **Humans only**: Bots, scrapers and spam traffic are automatically filtered.
* **Campaigns & newsletters**: Use UTM to collect data on how much traffic your
campaigns generate.
* **No vendor lock-in**: all features are available in Open Source versions, and
Prisme is designed to be easy to self-host.
* **SPA support**: Prisme is built with modern web frameworks in mind and it
works automatically with any pushState based router on the frontend.
* **[Grafana](https://github.com/grafana/grafana) based**: Prisme integrates
with [Grafana](https://github.com/grafana/grafana) that provides:
* User managements
* Team managements
* Permissions managements
* Multi organizations support
* Custom dashboards
## Getting started
Follow
[this guide](https://www.prismeanalytics.com/docs/guides/self-host-prisme-docker/)
to self-host a Prisme analytics instance or create an account on
[Prisme Cloud](https://app.prismeanalytics.com/sign_up).
Then, you can simply add tracking script to your website:
```html
```
That's it! You should now see data in your `Web Analytics` dashboard.
## Configuration
You can find configuration documentation on
[our website](https://www.prismeanalytics.com/docs/next/reference/server/server-modes/).
## Performance
Prisme Analytics ingestion server is **easily** capable of ingesting more than
50,000 req/s on my AMD Ryzen 7 7840U w/ Radeon 780M Graphics with injectors
running on the same machine.
```
$ cat /proc/cpuinfo | head | grep 'model name'
model name : AMD Ryzen 7 7840U w/ Radeon 780M Graphics
$ cd tests/k6/events
$ make start test clean
/\ |‾‾| /‾‾/ /‾‾/
/\ / \ | |/ / / /
/ \/ \ | ( / ‾‾\
/ \ | |\ \ | (‾) |
/ __________ \ |__| \__\ \_____/ .io
execution: local
script: /data/main.js
output: -
scenarios: (100.00%) 1 scenario, 4096 max VUs, 10m30s max duration (incl. graceful stop):
* sharedIterationsPageViewEvents: 131072 iterations shared among 4096 VUs (maxDuration: 10m0s, gracefulStop: 30s)
data_received..................: 90 MB 9.9 MB/s
data_sent......................: 130 MB 14 MB/s
http_req_blocked...............: avg=928.82µs min=330ns med=1.07µs max=268.74ms p(90)=2.45µs p(95)=3.16µs
http_req_connecting............: avg=911.42µs min=0s med=0s max=268.71ms p(90)=0s p(95)=0s
http_req_duration..............: avg=73.92ms min=57.4µs med=67.47ms max=808.82ms p(90)=139.72ms p(95)=167.03ms
{ expected_response:true }...: avg=74.08ms min=60.26µs med=67.63ms max=808.82ms p(90)=139.92ms p(95)=167.43ms
http_req_failed................: 13.80% ✓ 62640 ✗ 391185
http_req_receiving.............: avg=3.71ms min=3.4µs med=12.13µs max=221.36ms p(90)=729.89µs p(95)=19.92ms
http_req_sending...............: avg=282.26µs min=2.37µs med=7.27µs max=216.54ms p(90)=19.27µs p(95)=105.73µs
http_req_tls_handshaking.......: avg=0s min=0s med=0s max=0s p(90)=0s p(95)=0s
http_req_waiting...............: avg=69.92ms min=45.89µs med=67.16ms max=750.36ms p(90)=125.53ms p(95)=140.88ms
http_reqs......................: 453825 50018.387644/s
✓ { event_type:custom }........: 117531 12953.696068/s
✓ { event_type:pageview }......: 336294 37064.691576/s
iteration_duration.............: avg=274.18ms min=121.44µs med=152.26ms max=3.12s p(90)=680.26ms p(95)=958.77ms
iterations.....................: 131072 14446.119331/s
vus............................: 2100 min=2100 max=4096
vus_max........................: 4096 min=4096 max=4096
running (00m09.1s), 0000/4096 VUs, 131072 complete and 0 interrupted iterations
sharedIterationsPageViewEvents ✓ [ 100% ] 4096 VUs 00m09.1s/10m0s 131072/131072 shared iters
```
## Contributing
If you want to contribute to `prismeanalytics` to add a feature or improve the
code, open an [issue](https://github.com/prismelabs/analytics/issues)
or make a [pull request](https://github.com/prismelabs/analytics/pulls).
## :stars: Show your support
Please give a :star: if this project helped you!
[](https://www.buymeacoffee.com/prismelabs)
## :scroll: License
[Prisme Analytics](https://www.prismeanalytics.com/) is distributed under
[AGPL-3.0-only](LICENSE). For MIT exceptions, see [LICENSING.md](LICENSING.md)